New Beginnings
Welcome to the first discussion of the year in the Platinum Newsletter. I hope the end of last year offered time for rejuvenation and that you have sprung into 2024 with new goals and plans for trading success. I find this time of year busy for many reasons and it’s easy to be distracted and find the year getting away from us before we have even started. The lesson is to plan the year ahead with as much routine as you can muster and build repeatable processes and patterns into your routine.
Given I have experienced the new year vibe of markets on many occasions, it’s fair to say I don’t get particularly flustered with what I am expecting in the year ahead as I have done a lot of the work around the big cycles I am expecting well before the year kicks off.
Let’s time travel back to December when we last discussed Crude Oil. Chart 1 below shows us the current position and price of approximately $78 USD a barrel. You should refresh yourself on the article from December 2023 where I suggested some large cycles could meet in December which is traditionally a strong month for turns, and in particular lows.
The run down from September was later than the seasonal time and the low came in earlier than the December seasonal footprint. The move was approximately $27 USD and took 46 trading days or 76 calendar days.
This move was a very tradeable option and even if you had expected the move to last a few more days to the downside, the Reward to Risk Ratio was very favourable. The 13th of December low was a great place to exit a position, the notion of reversing the trade direction or entering a fresh long position has been less exciting, as the price action has moved sideways and meandered without strength, however, we could be starting to enter a new phase as the Jan 29th tops are being tested.
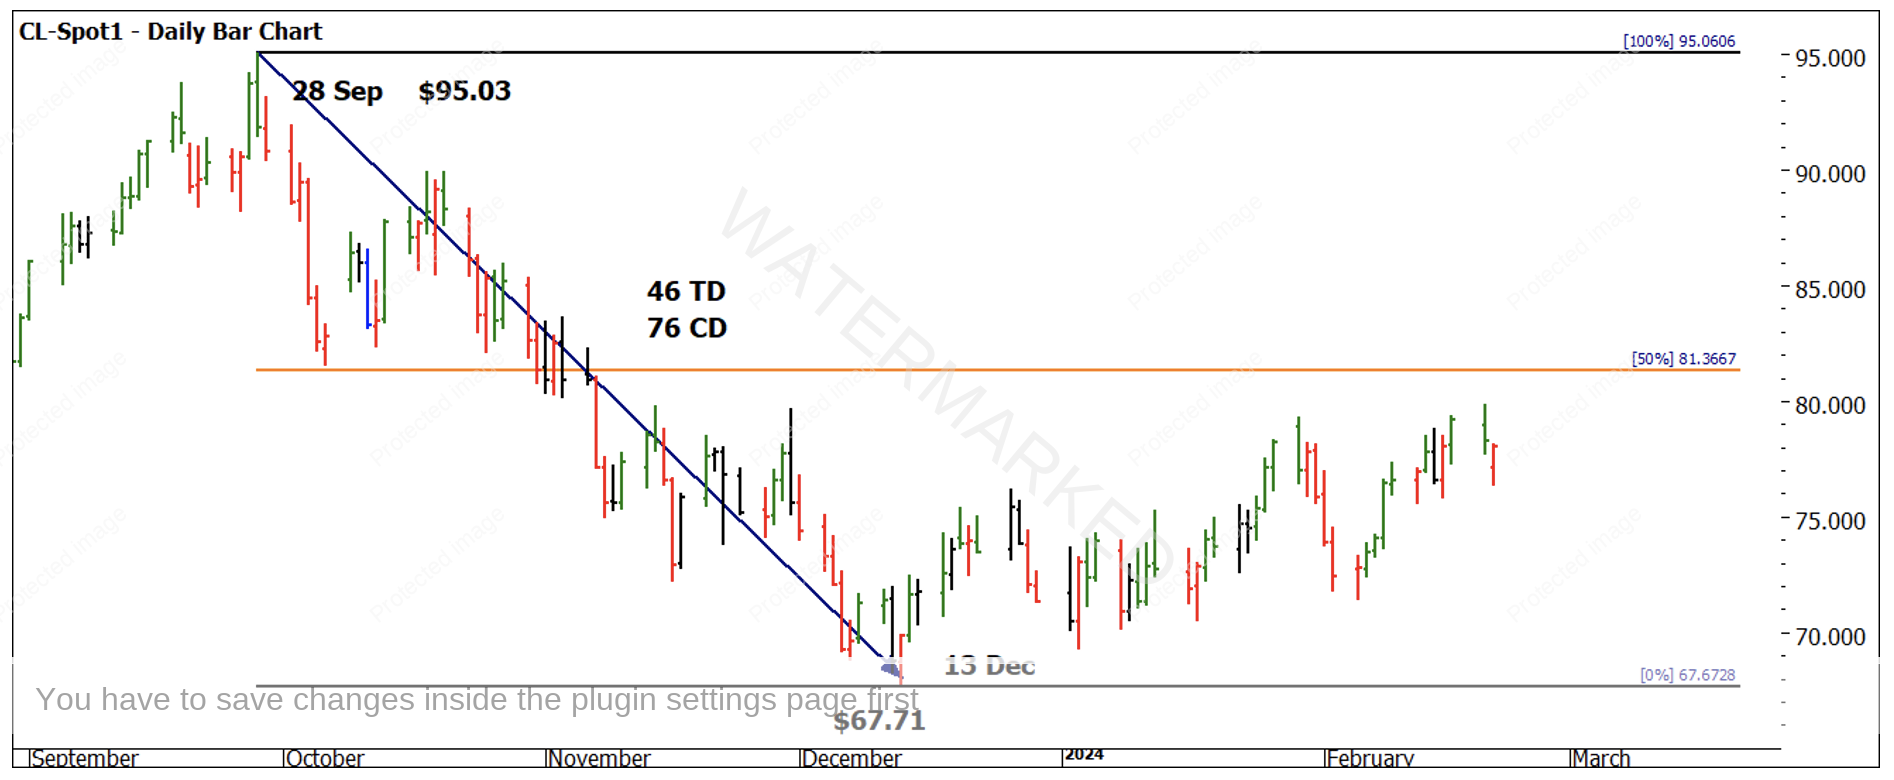
Chart 1 – Daily Bar Chart CL-Spot1
Charts 2 & 3 show the daily and weekly swing chart for this period and confirm whilst broadly trending higher, the patience and ability to set and hold long has been challenging.
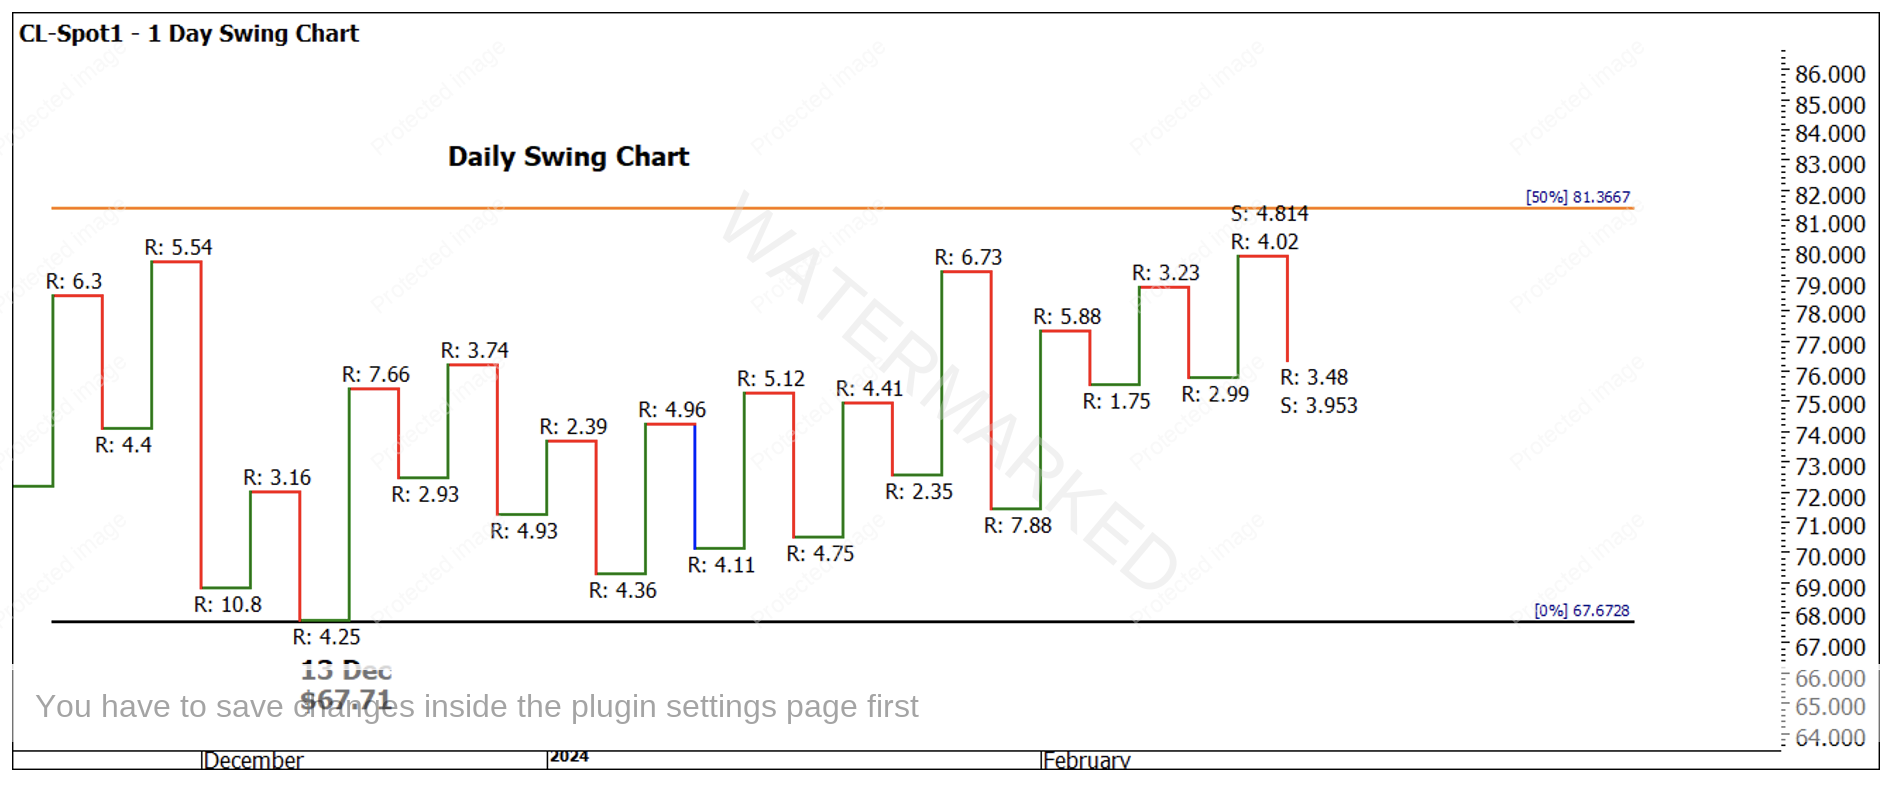
Chart 2 – Daily Swing Chart CL-Spot1
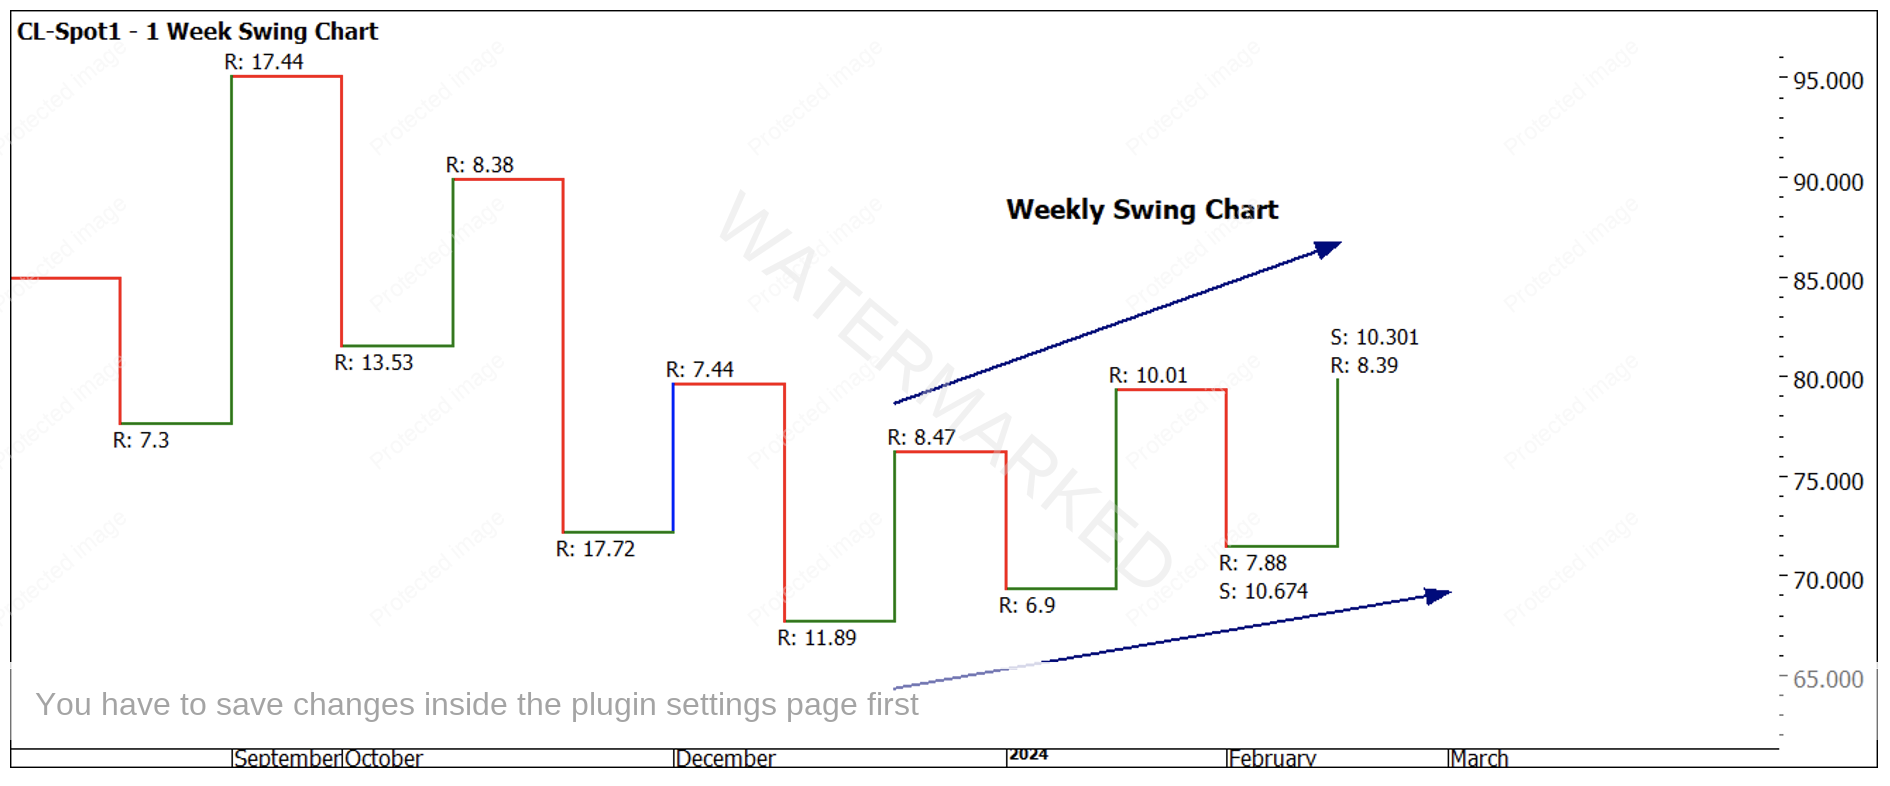
Chart 3 – Weekly Swing Chart CL-Spot1
This type of pattern in Oil is one that we can see in previous major turns. At this time I cannot confirm that the December low will be significant as a low, but a quick study of the following charts helps us understand that in the beginning of each calendar year Oil can move strongly, but also take its time when needed. My study of the fundamentals suggests when the Northern Hemisphere winters are out of expectations either colder or warmer than planned for (due to heating oil use) then the Oil market can stall somewhat in response. Of course, there are a multitude of other geopolitical and economic factors that can drive prices.
Charts 4,5,6 and & 7 look at some major lows in the Oil market and the years they occurred, with a note of how many days it took before the price action climbed away.
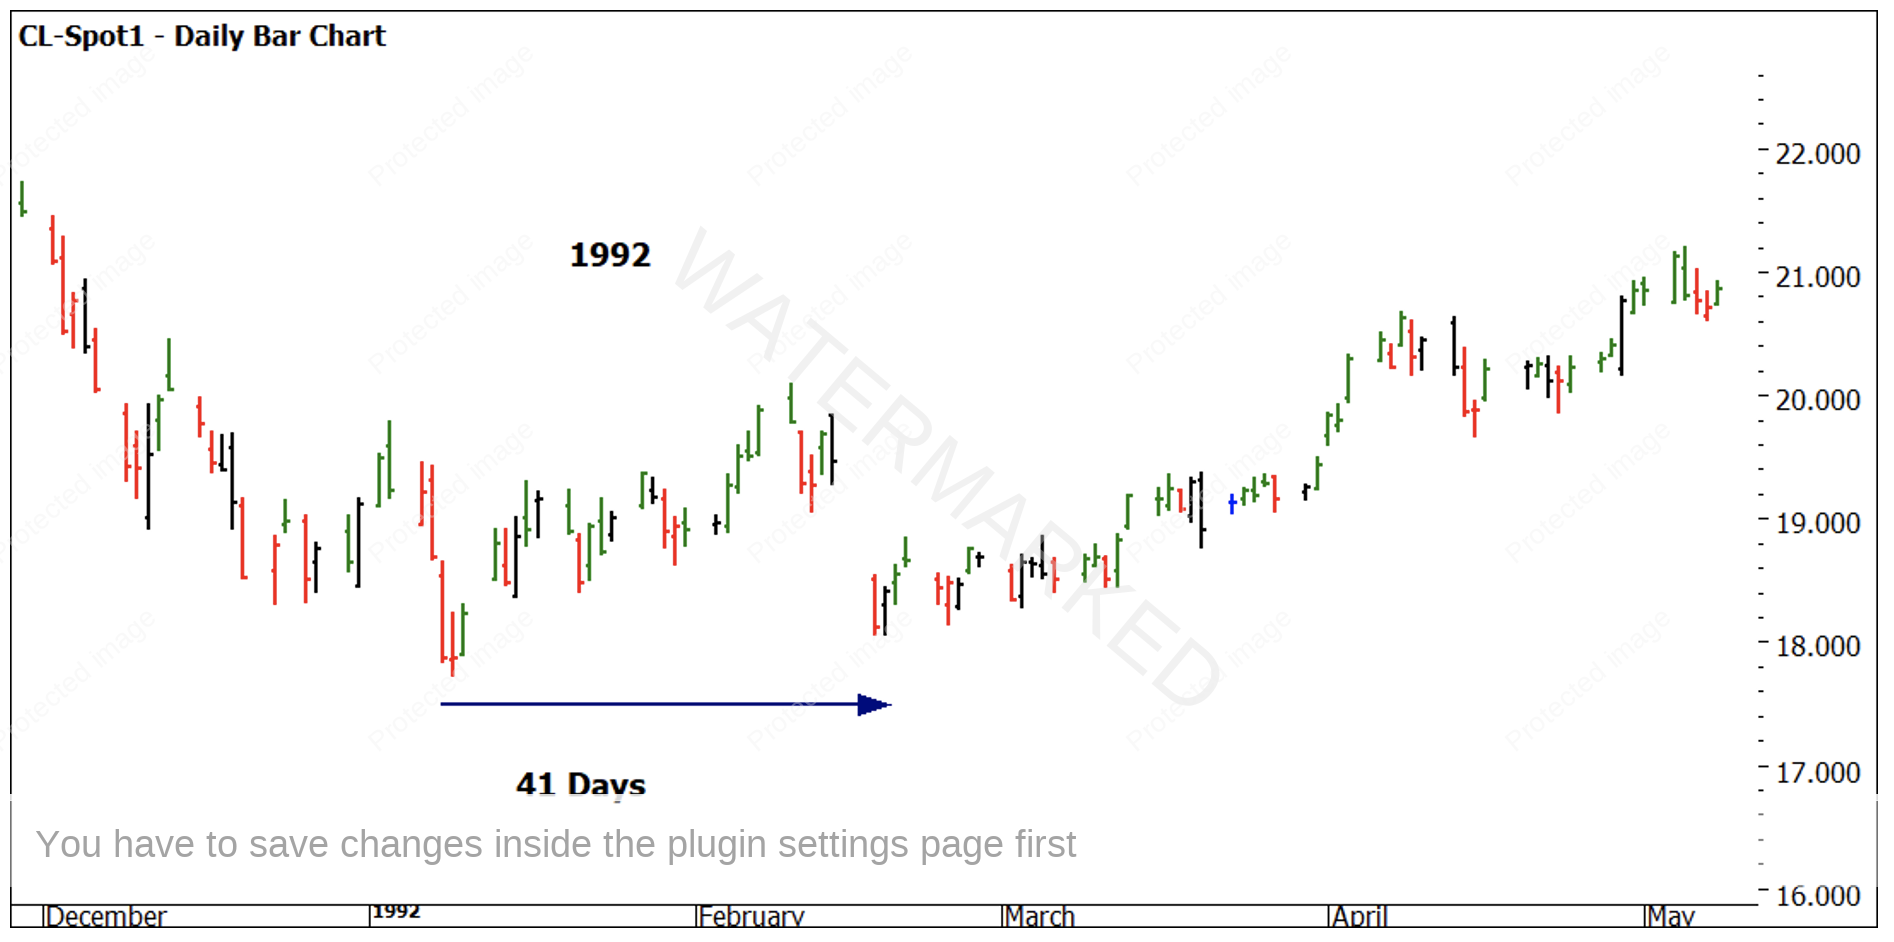
Chart 4 – Daily Bar Chart CL-Spot1
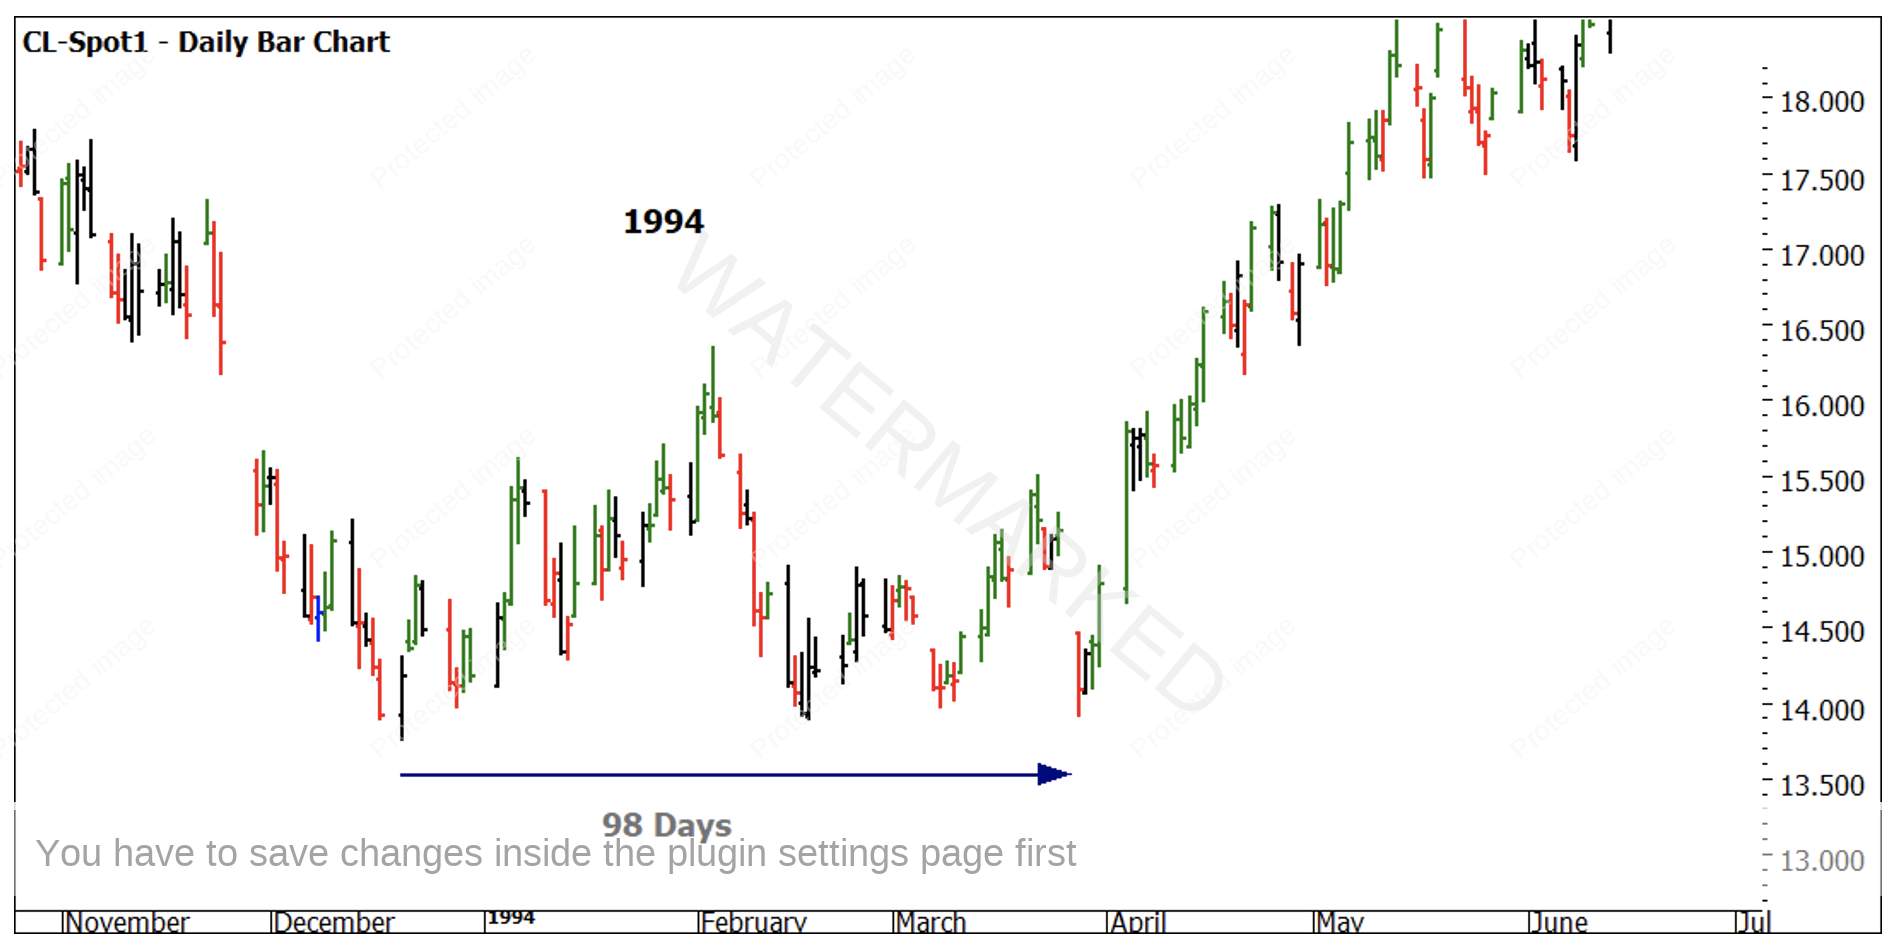
Chart 5 – Daily Bar Chart CL-Spot1
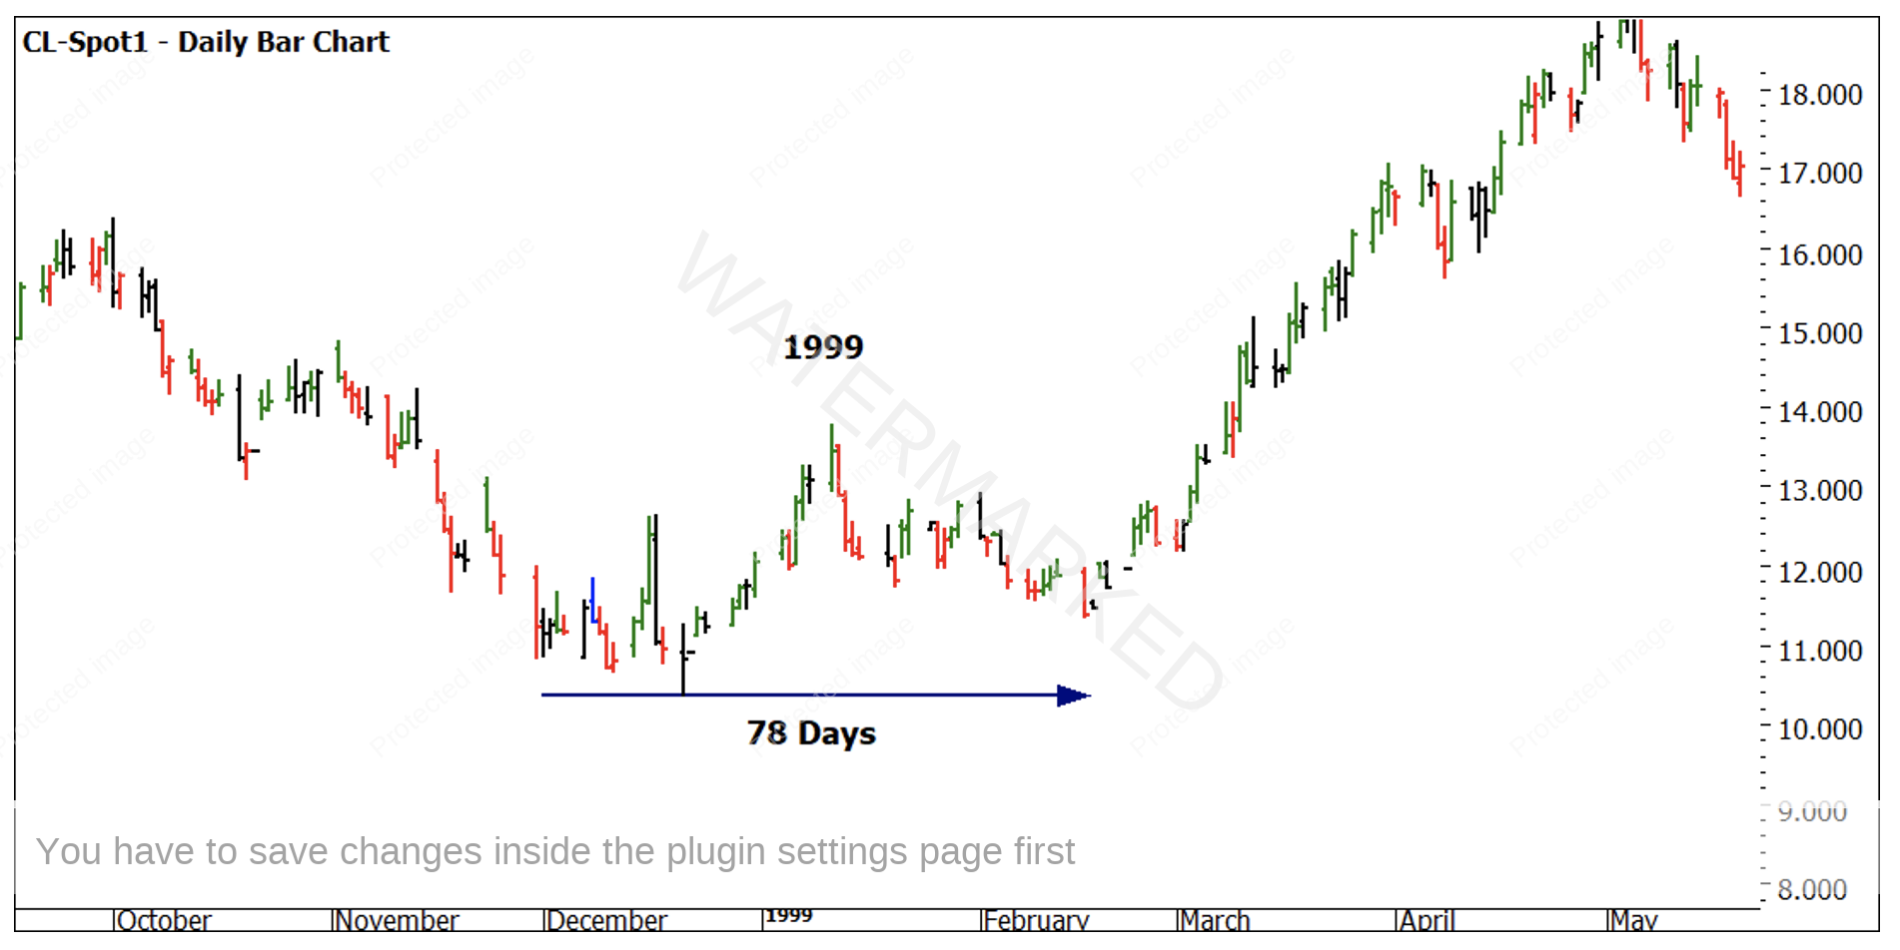
Chart 6 – Daily Bar Chart CL-Spot1
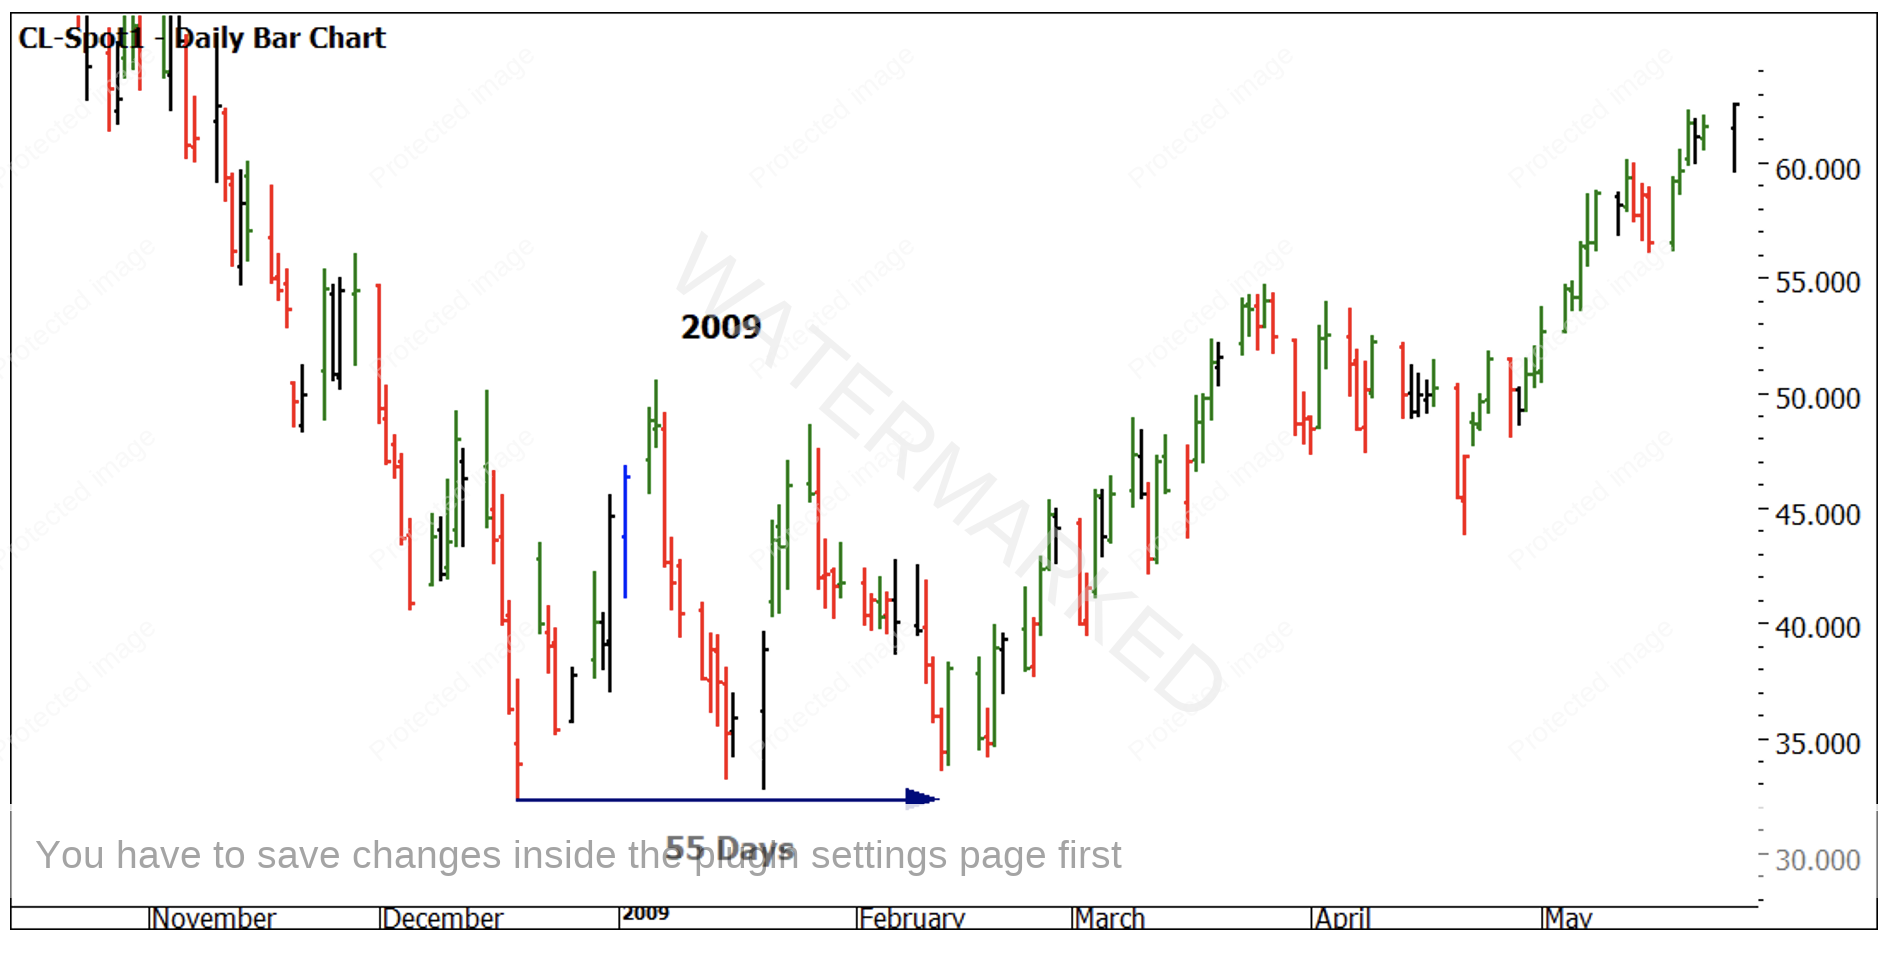
Chart 7 – Daily Bar Chart CL-Spot1
What we can deduce from this sample is that by the end of February the price action in nearly all cases has started to move higher, with one example where it took till the March seasonal time (1994) for the cycle to commence. This is an extra tool we can apply to a market to understand if more patience is required or if we could be expecting a new Point C to come in and further downside potential.
Keeping our setups as simple as possible is key. David tells us to trade from C to D not B to C in our ABC patterns. The next chart is a simple way to create a picture of what could be next. Are we seeing a Point C at the December lows of 2023 or the potential for a new Point C and downside as noted in Chart 8?
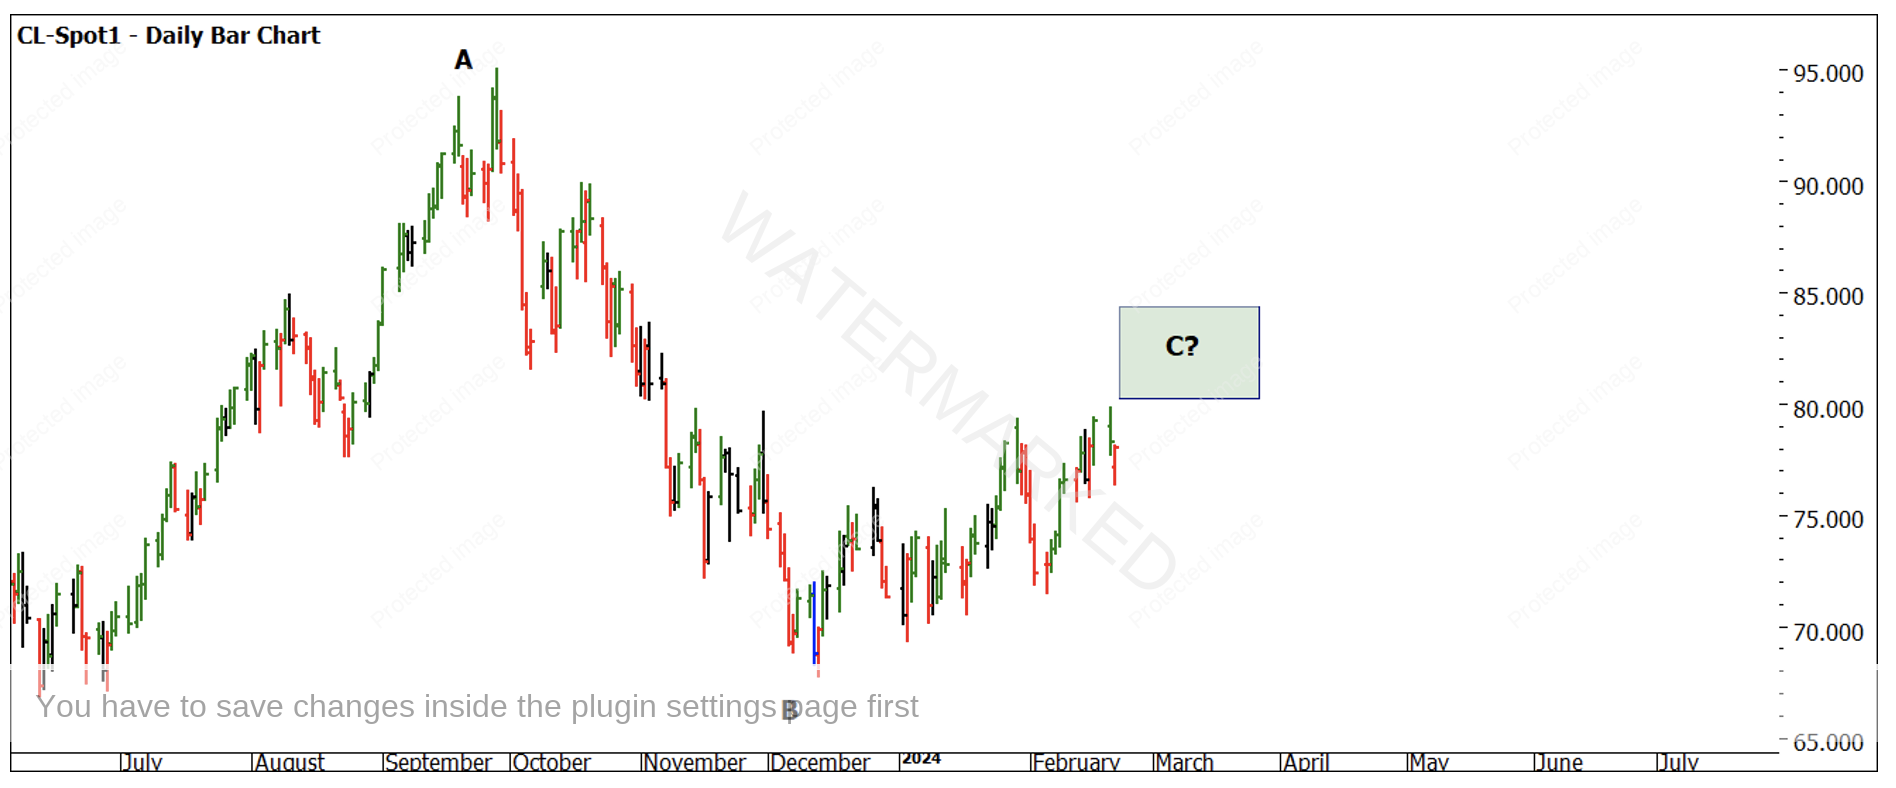
Chart 8 – Daily Bar Chart CL-Spot1
Using seasonality and previous patterns as a guide we can start to see if a market is operating inside or outside its history. Your challenge is to look at the December low of 2023 and compare the other years I have noted in the charts and see if there is any relationship between them to understand how the current pattern could be relevant.
Good Trading
Aaron Lynch