Not Just Squares
Looking at the major US indices against the SPI200, weekly swing lows have been made in the late part of October. The Dow, Nasdaq and S&P500 have now taken out their last weekly swing highs, whereas the SPI200 has only managed a slightly expanding weekly time and price swing up. See Chart 1 below.
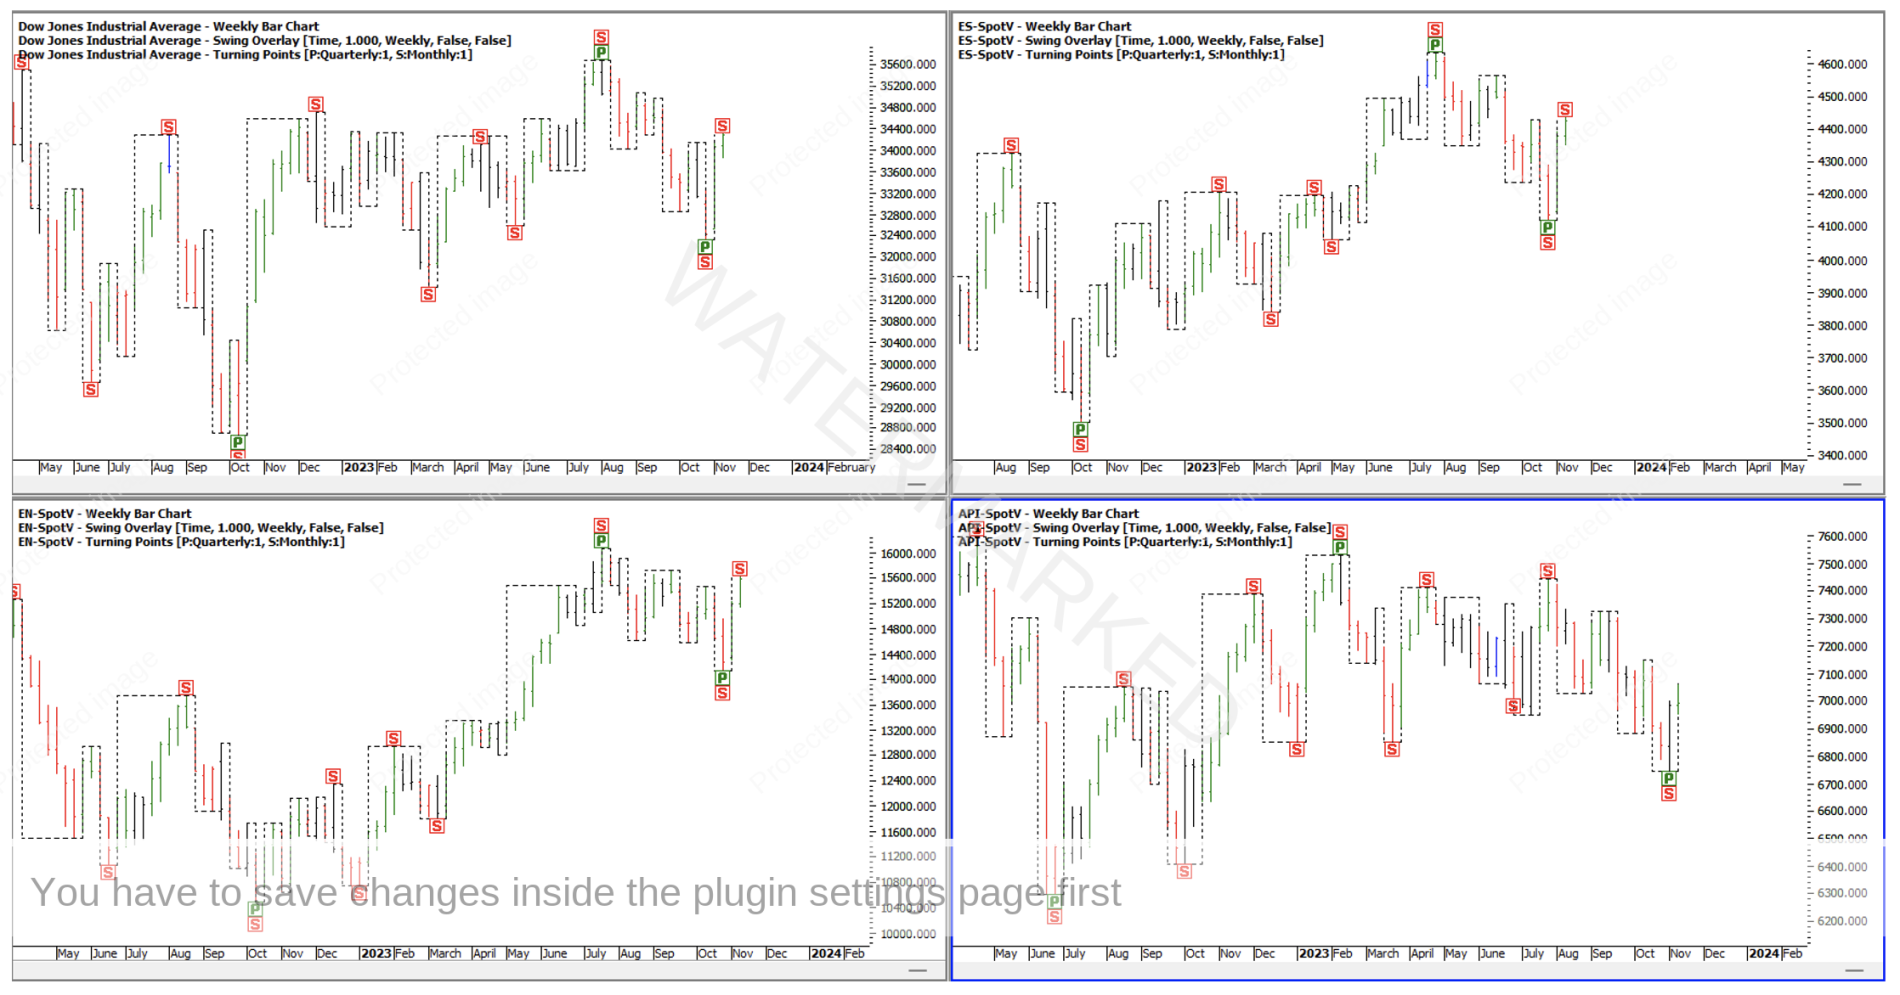
Chart 1 – US and Australian Indices
The recent SPI200 low at 6746 on 30 October is a good case study to pull apart. From the monthly swing ranges:
- 100% of the monthly First Range Out = 6767
- 150% of last monthly swing = 6751
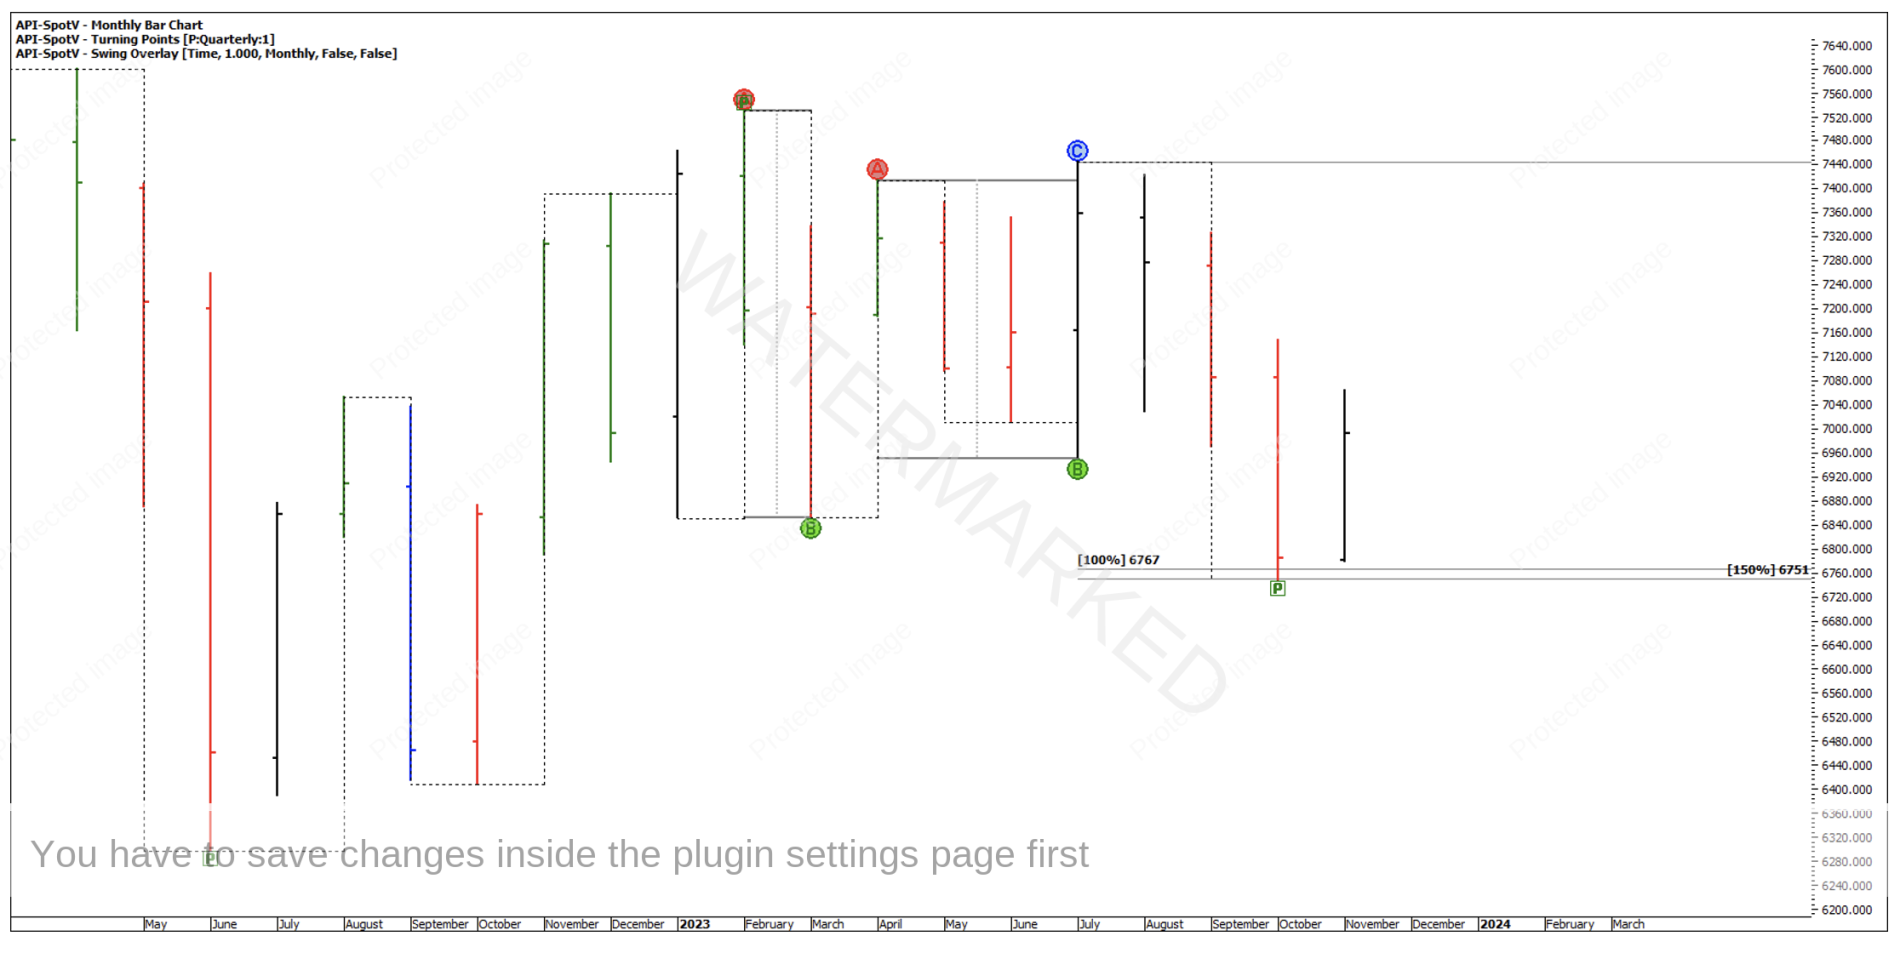
Chart 2 – Monthly Swing Ranges
Within the current monthly swing down there have been three weekly sections with the last weekly section down a contracting range in time and price. On the API-Spotv chart, it showed three daily swings whereas the AAI-Spotv day only chart showed four daily swings down.
This third weekly section ended at 90 degrees from the 28 July monthly swing high.
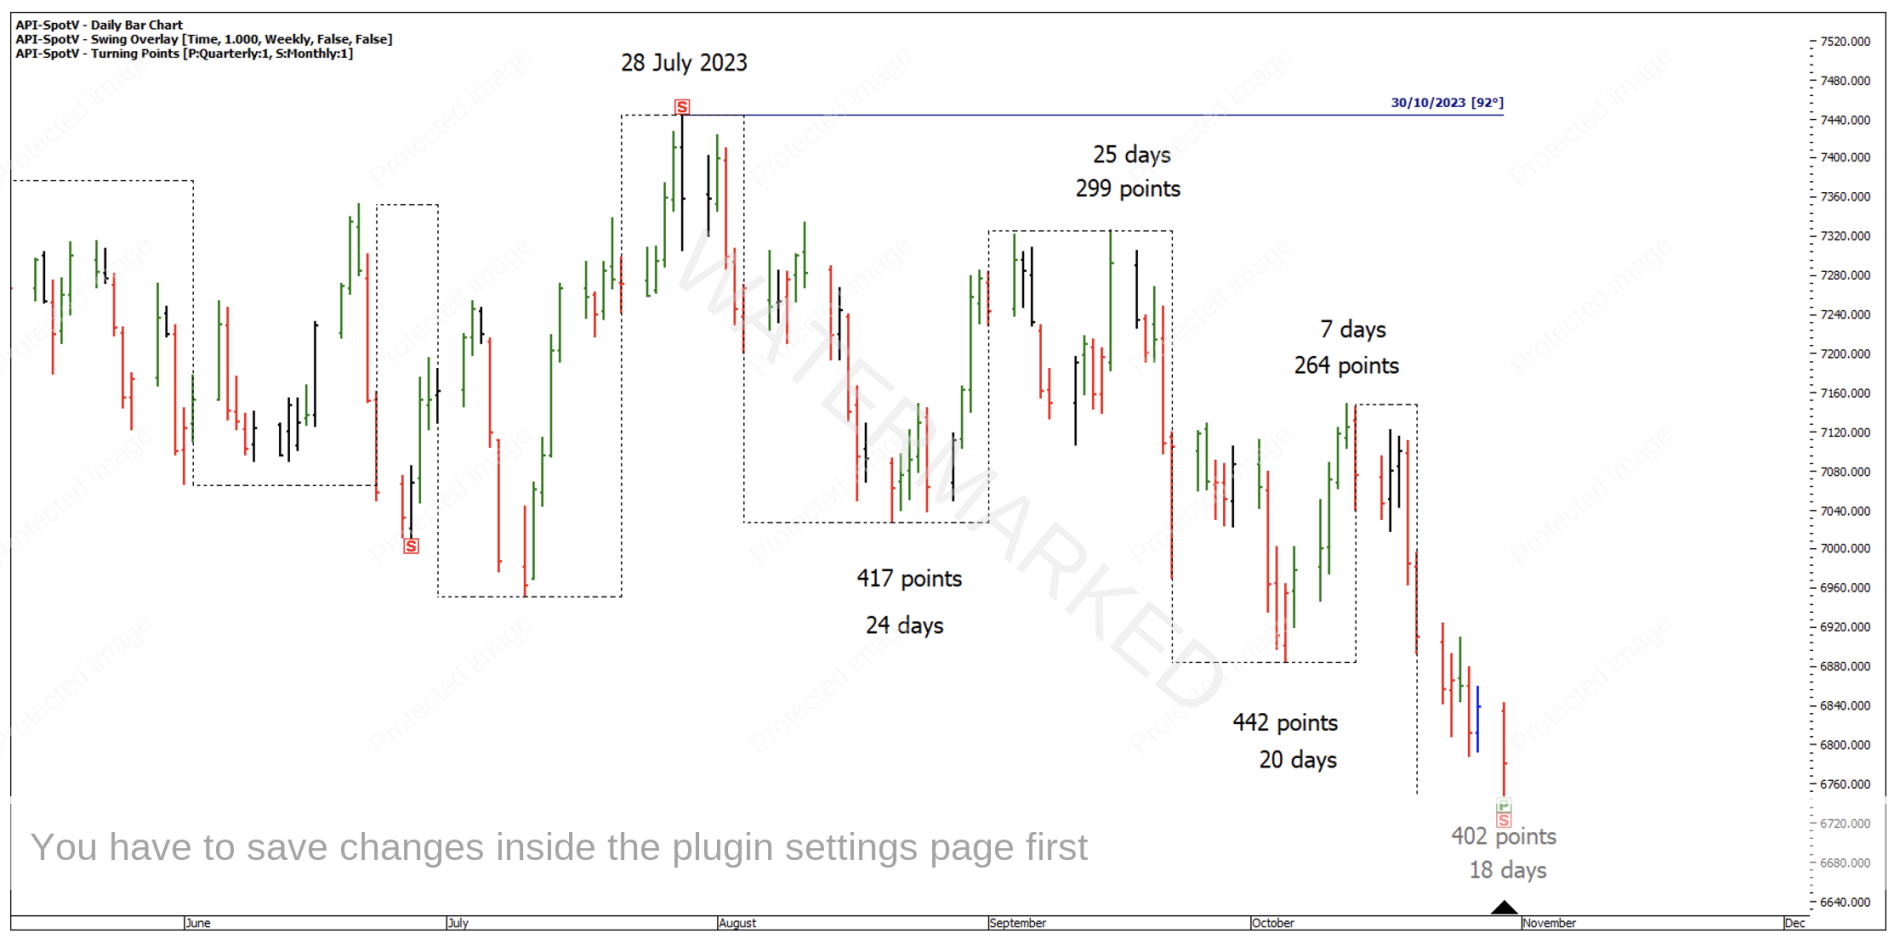
Chart 3 – Weekly Swings
Looking at Ranges Resistance Cards, the 30 October low was also a 62.5% retracement of the June 2022 to February 2023 range and 25% of the total range from March 2020 to April 2022.
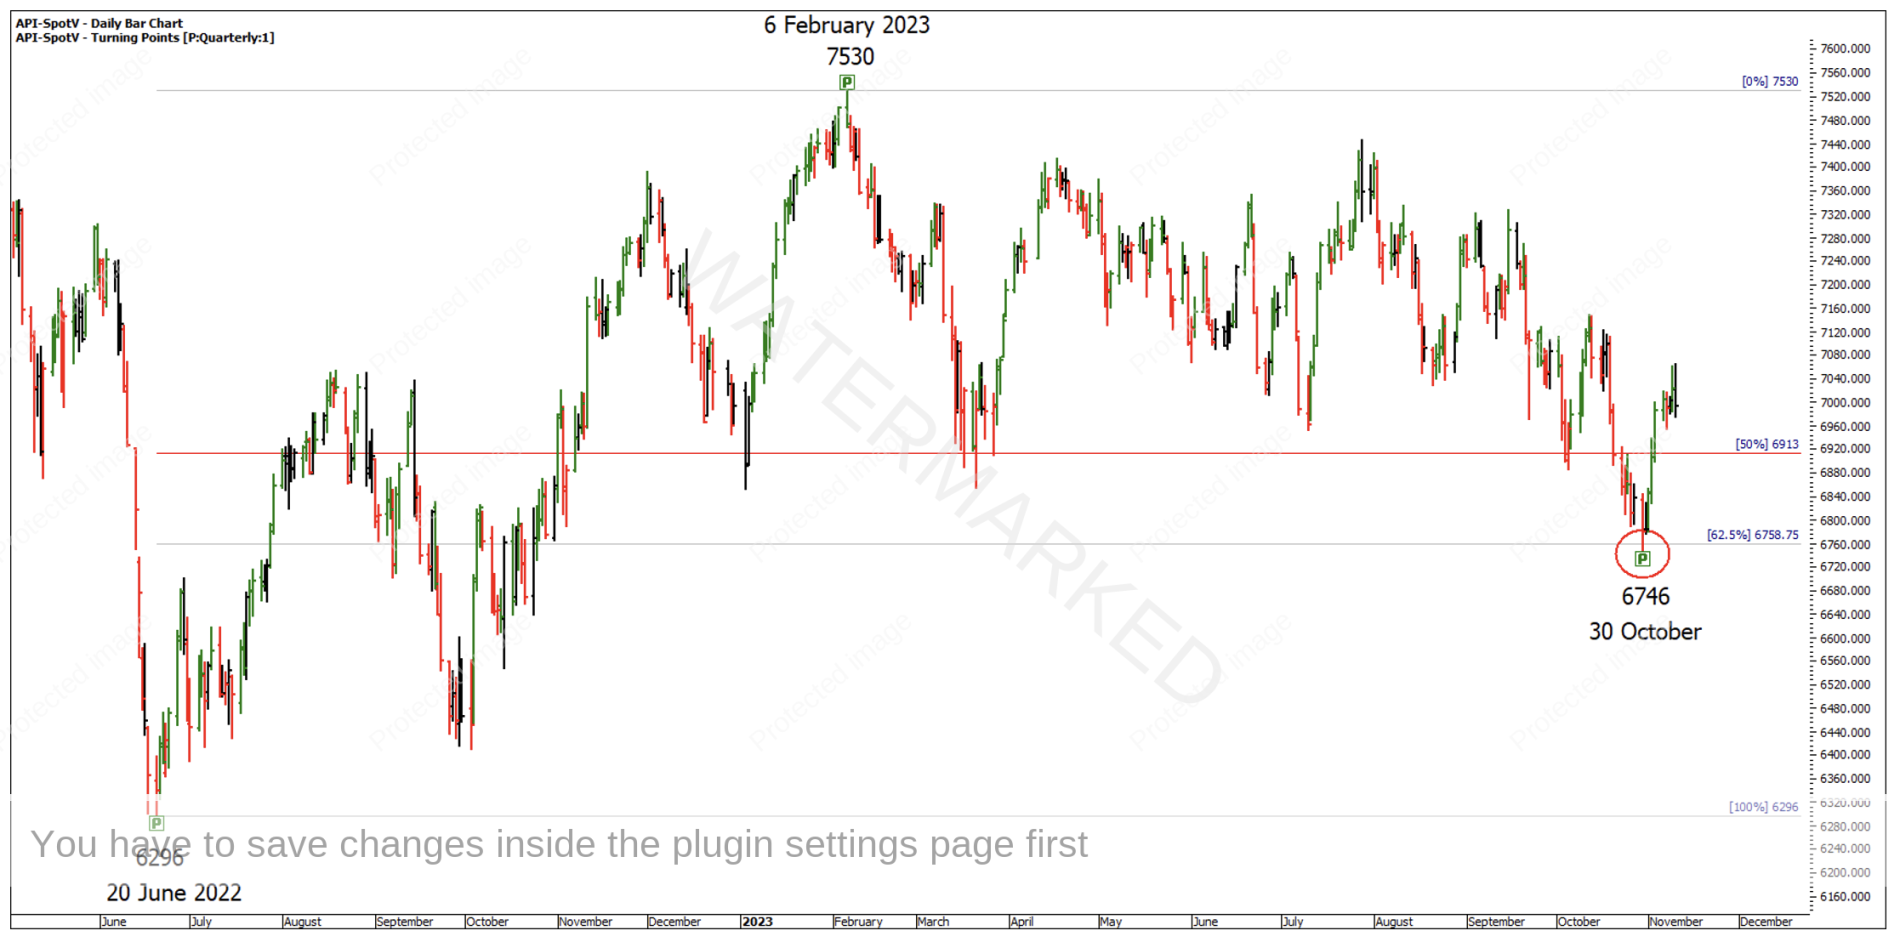
Chart 4 – Ranges Resistance Card
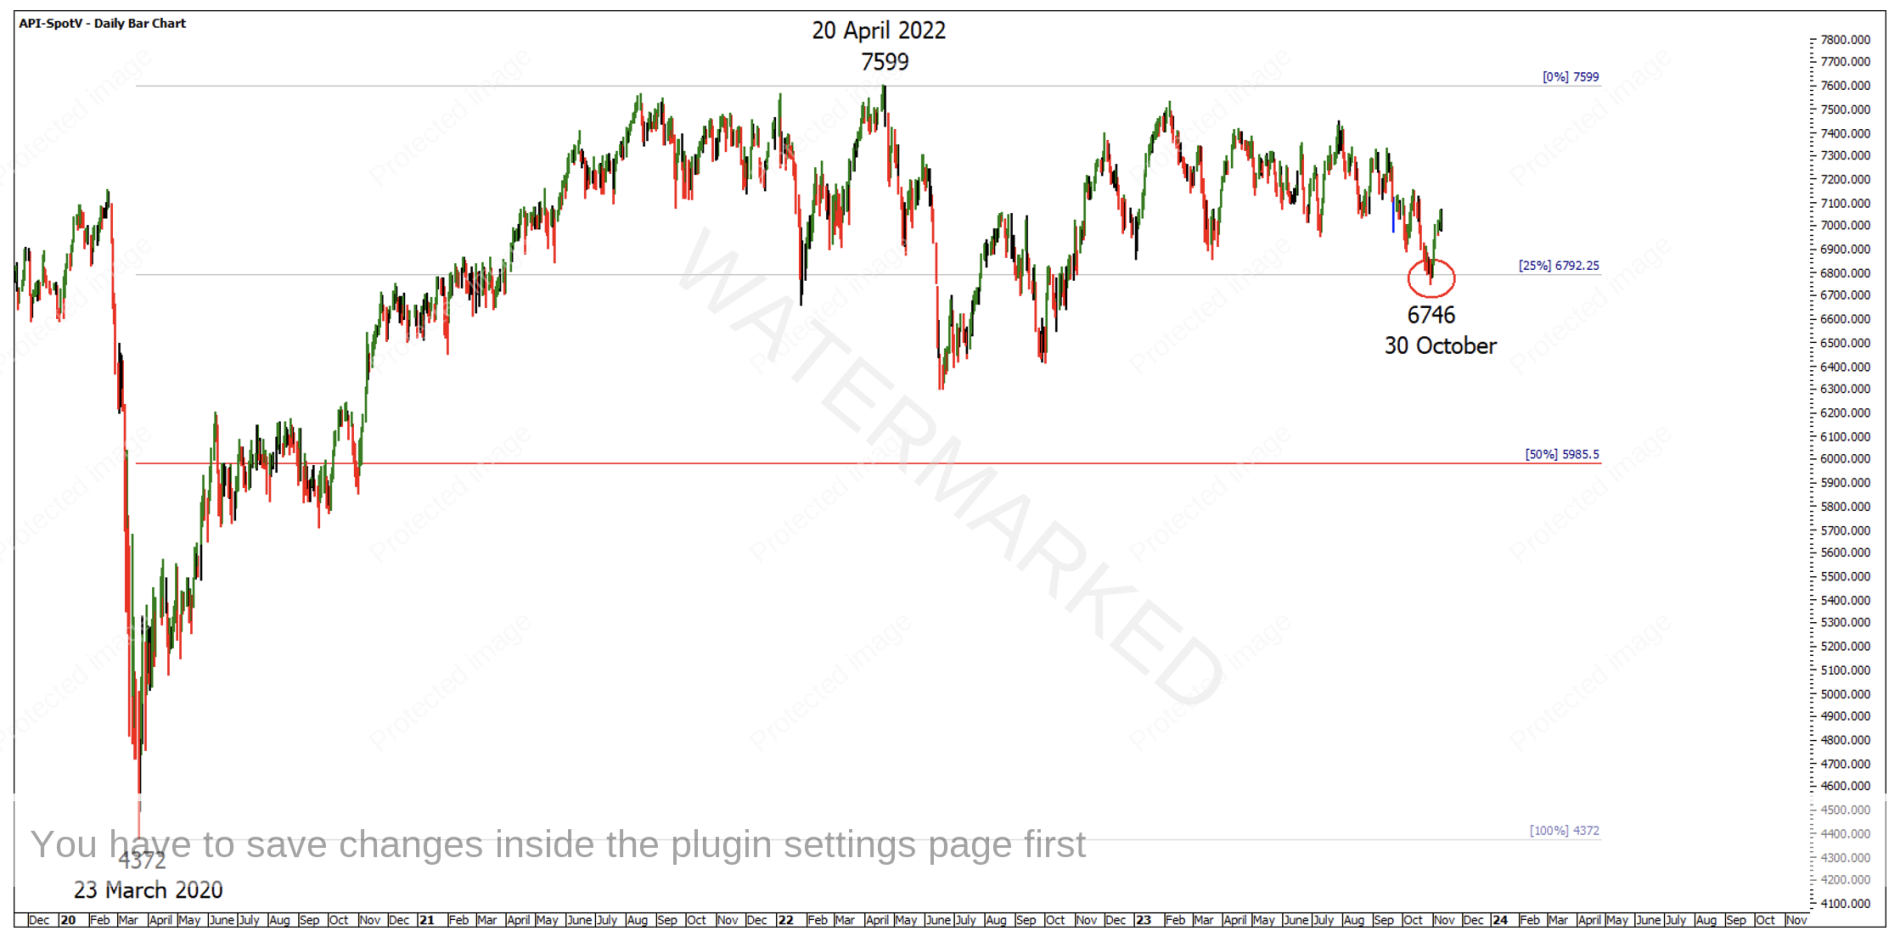
Chart 5 – Ranges Resistance Card
Looking at the Permanent Square of 458, you can see many tops are made in the weak part of the square and many lows are made in the strong part of the square. The current 30 October low is in the strong part of the square.
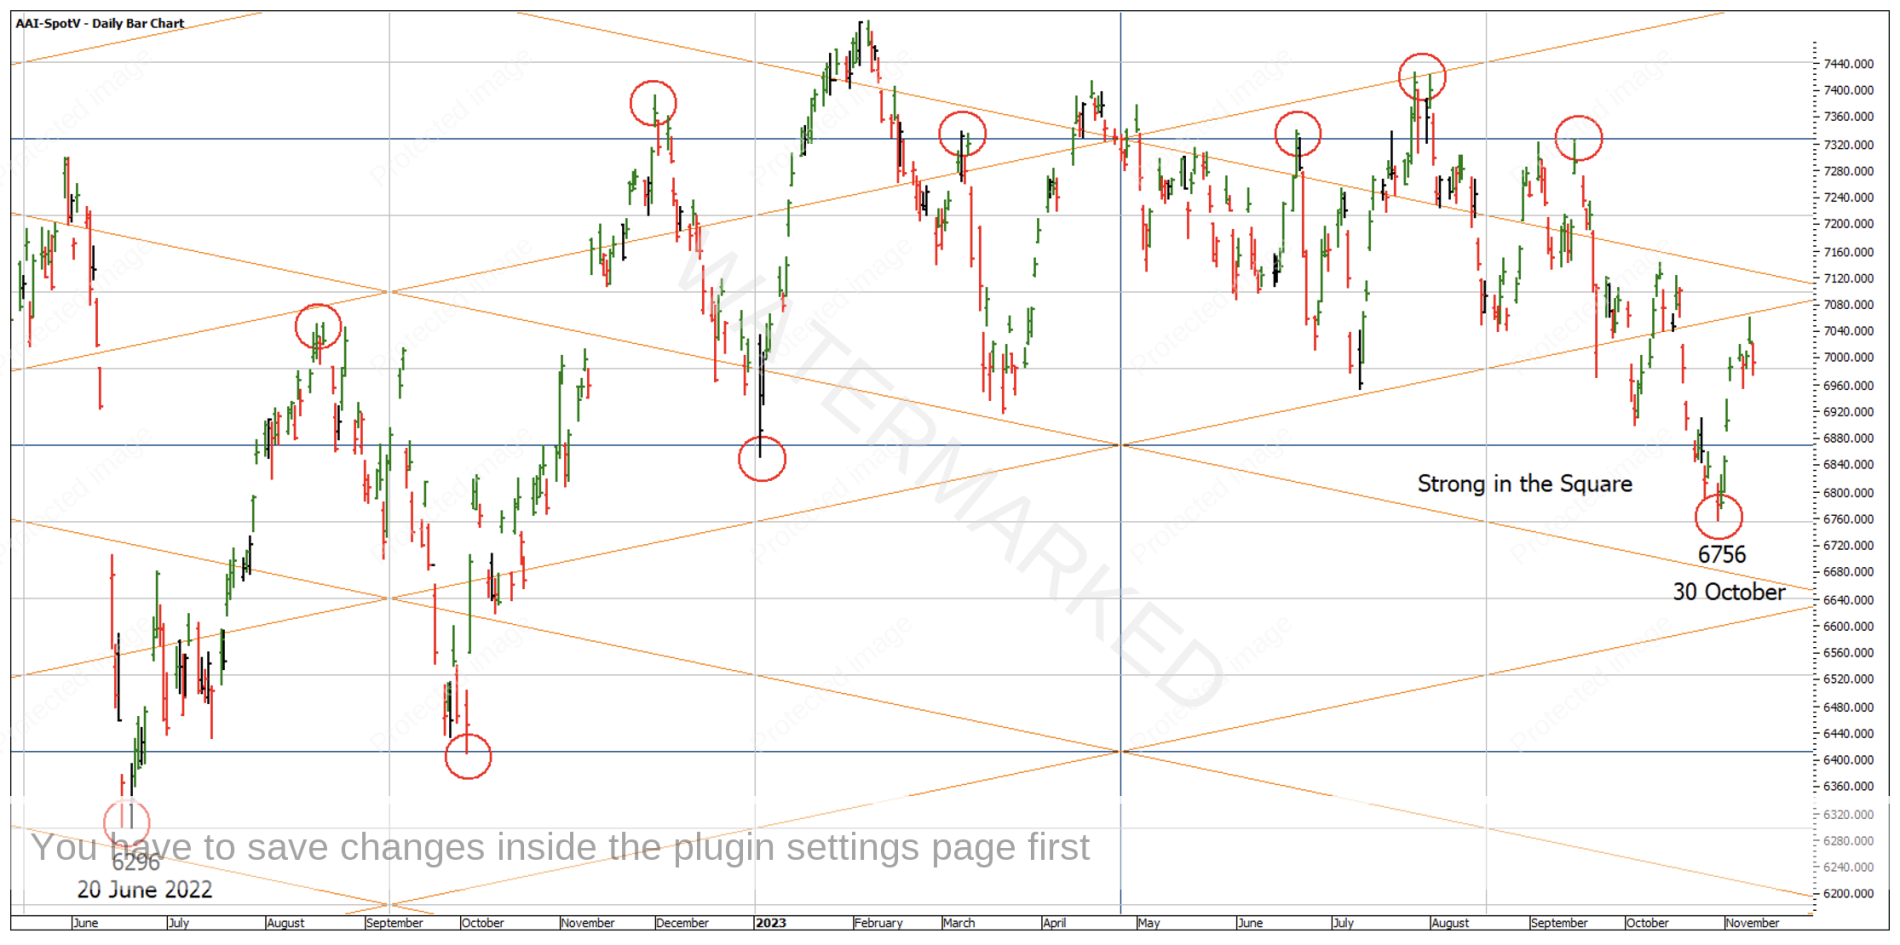
Chart 6 – Permanent Square of 458
If you’ve got your ‘Master Calculator’ drawn up the way David describes in Chapter 6 of the Ultimate Gann Course, you can also see that the 30 October low was a near perfect 458 points from the 20 June 2022 low of 6296, as they are lined up right next to each other. That’s the brilliance of the Master Calculator, you can instantly identify when the market is a number of full squares from a previous high or low without needing to run multiple squares on a chart.
To illustrate this on a separate chart using the API-SpotV chart, the market ran down to 6746 (10 points lower than the AAI) and therefore the low is in the strong part of the square running up from the 6296 low. This means that the SPI has a made a low in the strong part of two squares of 458.
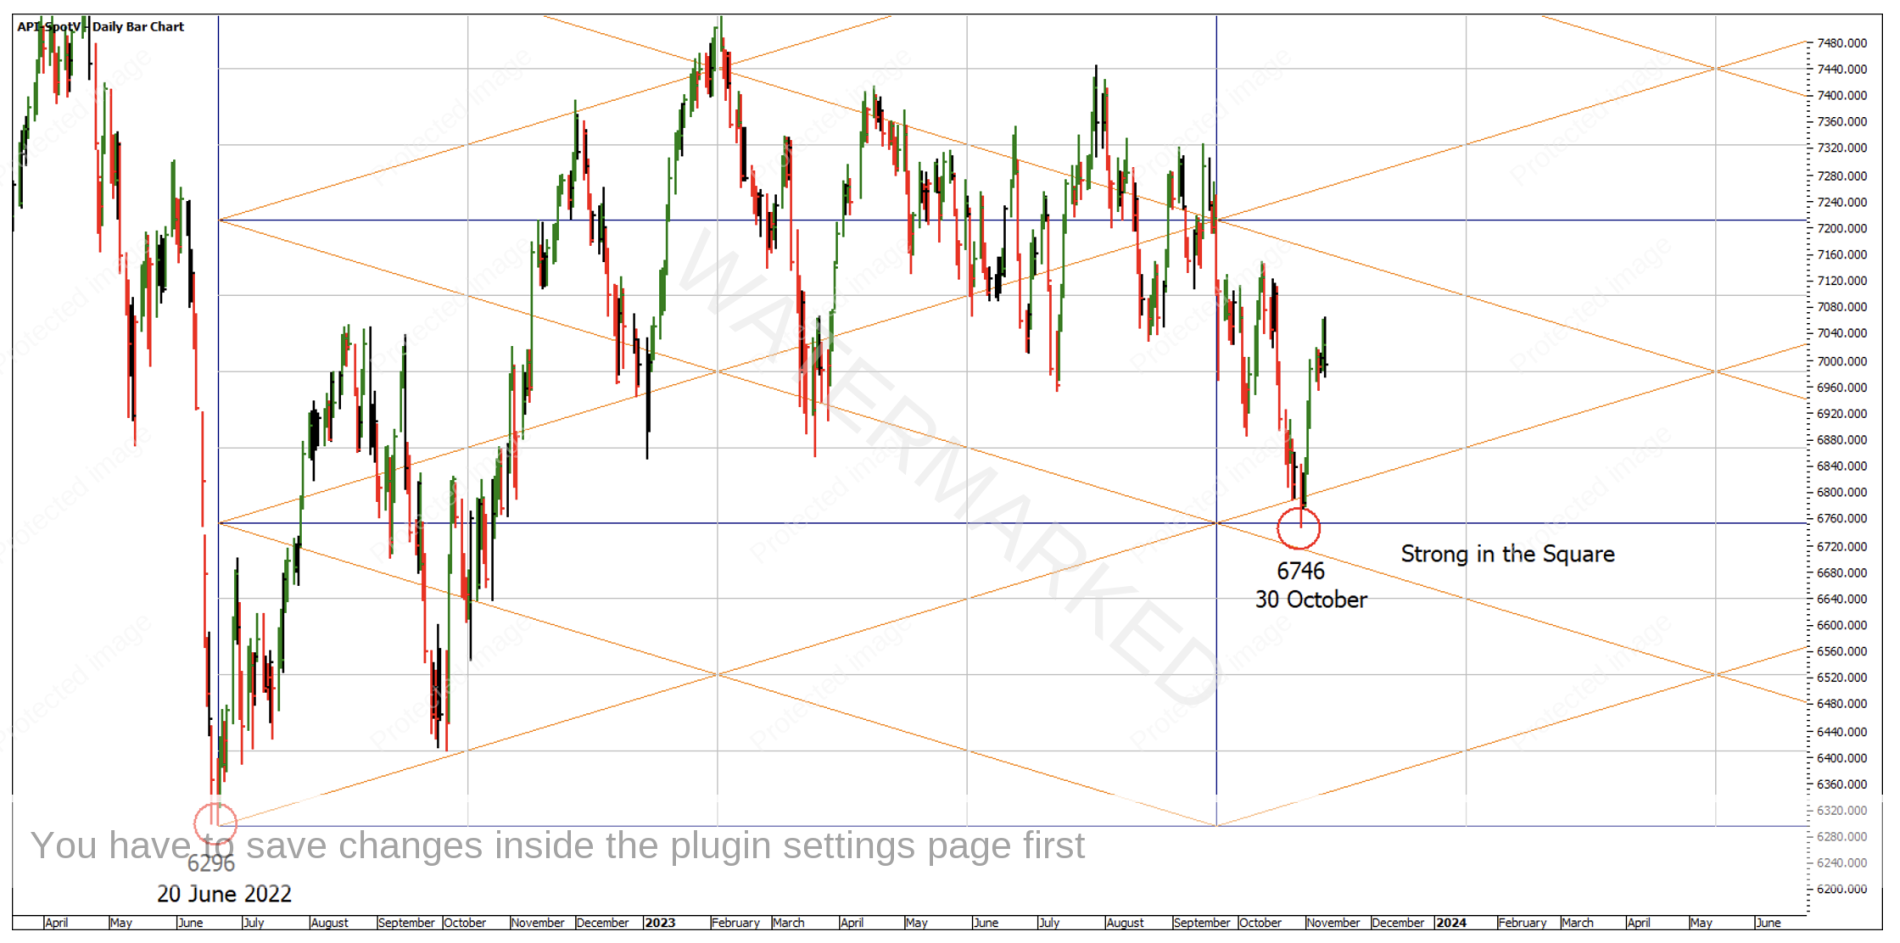
Chart 7 – Square of 458
Looking at the 4-hour chart, there was an 82 point First Range Out, followed by a two part pull back with a contracting 4-hour range down of 50 points.
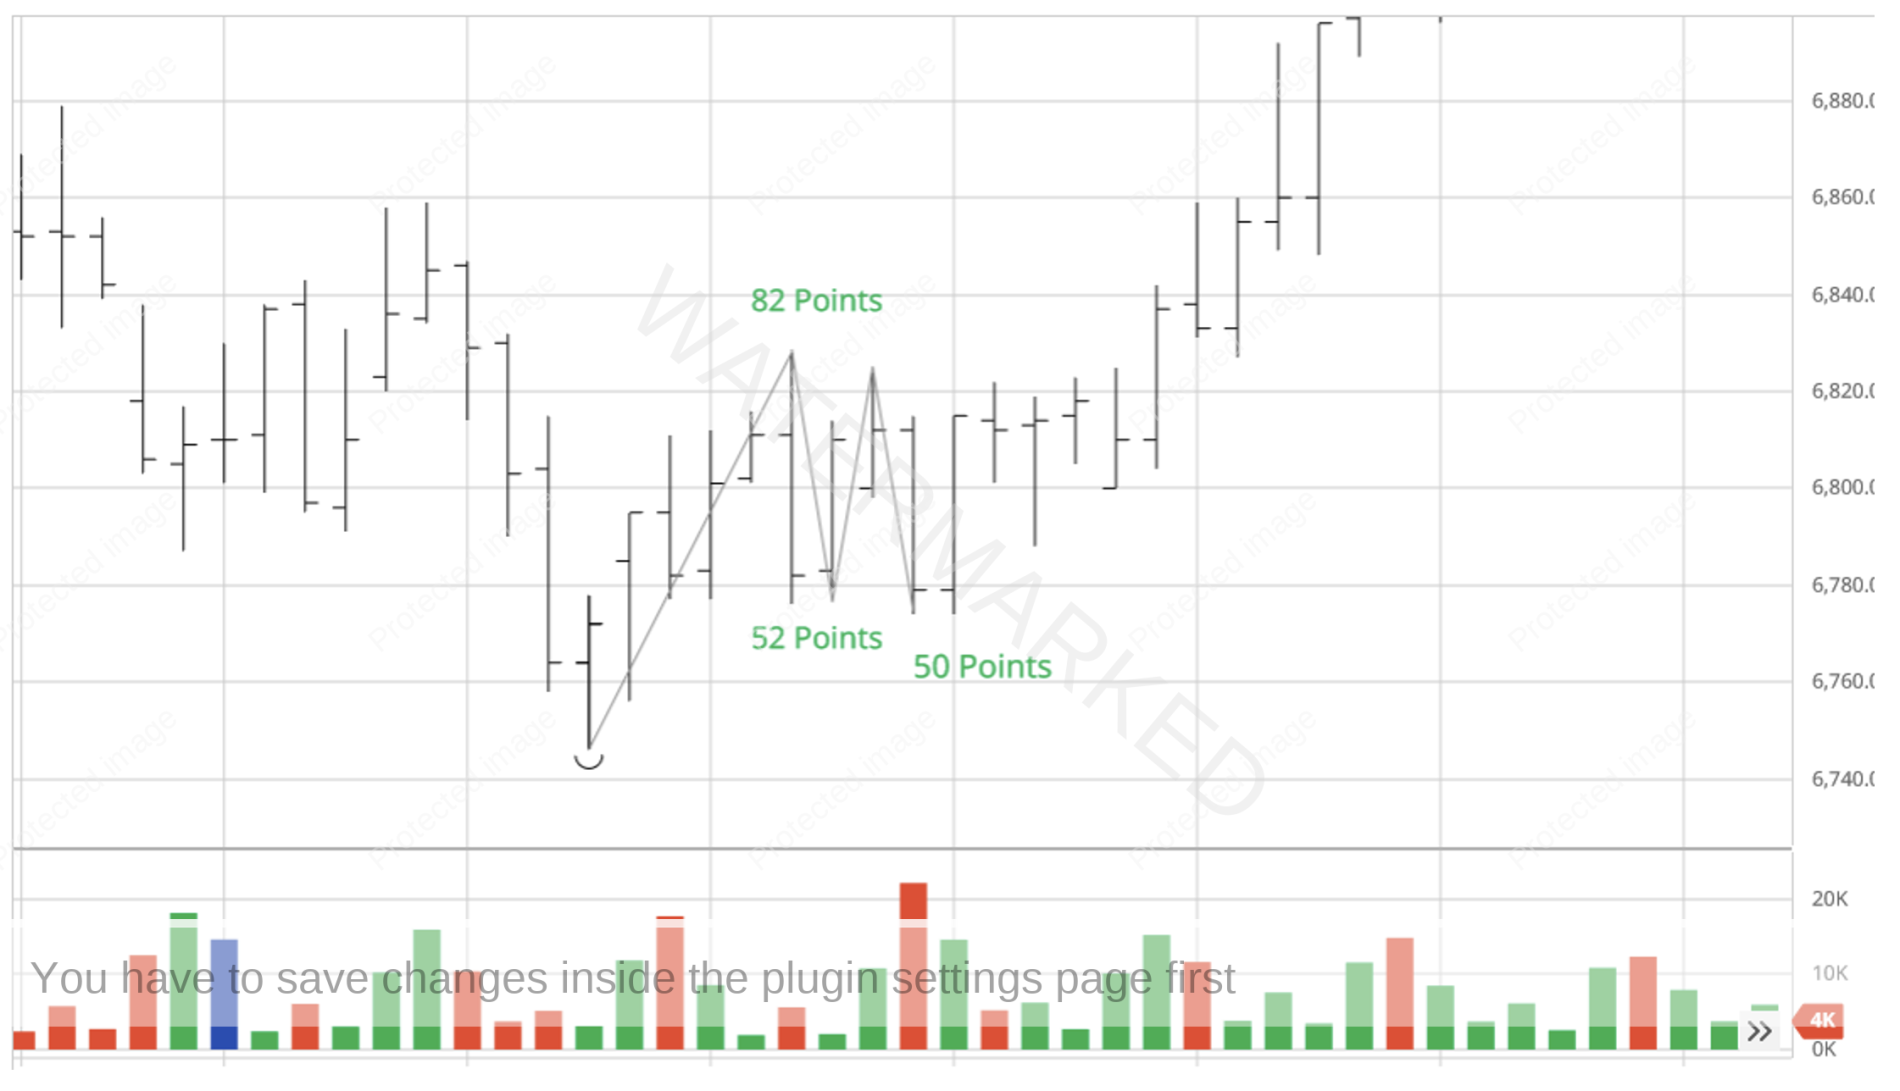
Chart 8 – 4 Hour First Range Out and Retest
Breaking down the last 4-hour swing range, there was a contracting 1-hour swing into the low after a little false break triple bottom. A legitimate entry as the swing chart turned back up would have given you a risk of 19 points for this trade. See Chart 9 below.
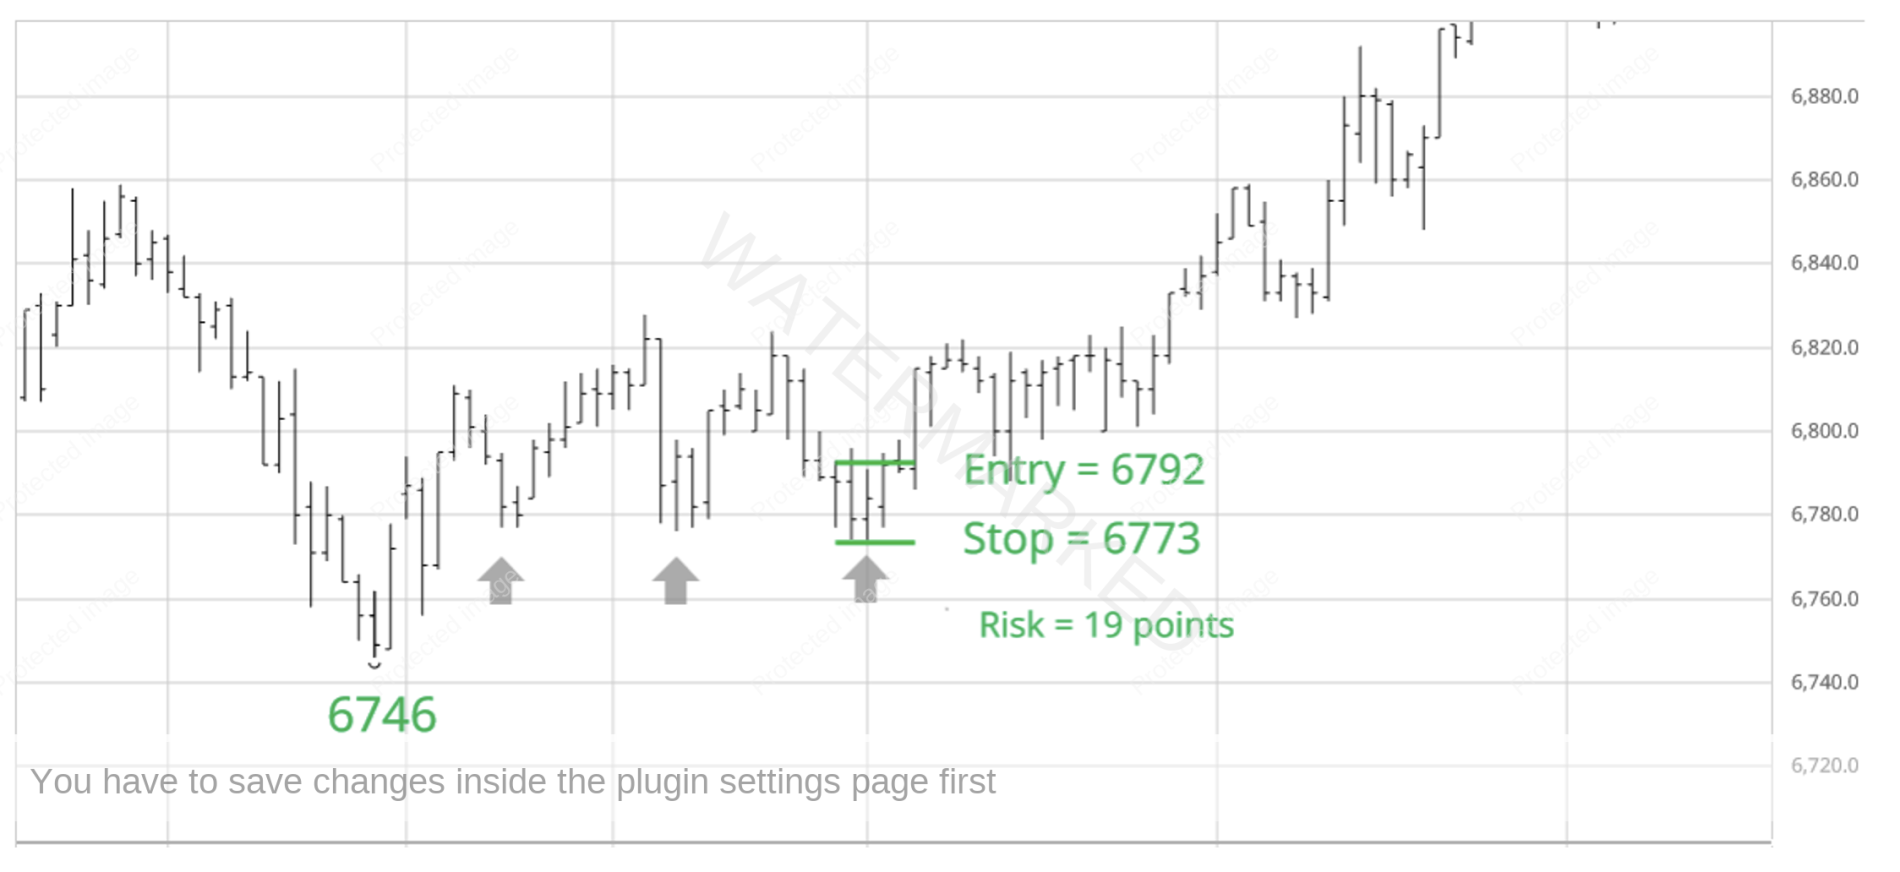
Chart 9 – 1 Hour Entry
That means this market only had to rally 190 points from entry to make your 10 to 1 Reward to Risk Ratio. That gave a target of 6982 which was achieved on 3 November.
The halfway point of the current square of 458 (from the All-Time Low) is day 229 which is equal to Friday, 1 December 2023, at about 8 degrees 30 minutes. On my 30 Degree Vibration wall chart Monday 4 December at 11 degrees 33 minutes shows a clear line of vibration of weekly turning points.
This early December time pressure may turn out to be a nothing date if it doesn’t coincide with price pressure. However, if you do see a cluster approaching around this time, you can look ahead and see where it sits within the square.
I’m in the process of constantly improving my hand charts so they do the job of highlighting the ‘obvious turns’ and in a way doing the work for me. Then it’s up to me to keep them updated.
Happy Trading,
Gus Hingeley