Remember, it’s in the Charts…
When uncertainty arises, it’s wise to go and look at what your charts are telling you
Markets are maintaining their broad upward trends when we look at monthly and weekly charts, though they do face some interesting times ahead in an international space and a domestic one. The main domestic theme is the federal election and if you’re like me you’re likely crying out are we there yet? The Federal election will have some broad implications and uncertainty. As we know markets dislike uncertainty and with the betting agencies pricing a change in government, we can expect some volatility around our markets as anticipation of policies takes its course.
The larger and potentially more damaging issue for global markets is the renewed tension around the US/China trade wars. This ‘tit for tat’ news story dragged out in twitter will trigger some uncertainty for markets as we saw in the 4th quarter of last year as global equity markets fell up to 20% on concerns of an all-out trade war.
Given the current challenges of negotiating policies and agreements with the US political system, it’s fair to say I am glad we have charts to follow and trends, as predicting the next course of action from either the US or China will be difficult. That’s why I am going to focus this article’s discussion on the domestic doyen of Australian markets, BHP.
If we examine the broad sectors of the Australian economy, we have materials and financial markets. It’s amazing how the commodities story that once governed the daily headlines has retreated to the background. The finance sector has grabbed all the headlines given the Royal Commission and difficult interest rate/property market themes. It can often pay to watch the areas that no one is talking about so much, as they can be the areas that are moving.
Chart 1 shows the material sector XMJ on a weekly chart, the price action has more than doubled since the lows in 2016. The repeat of the major range to 100% has some distance left to run. After the initial first range in time, the market has slowed in its time to run to new highs.
We can see the first quarter of 2019 was strong with nearly all green weekly bars with the current pullback around 30%.
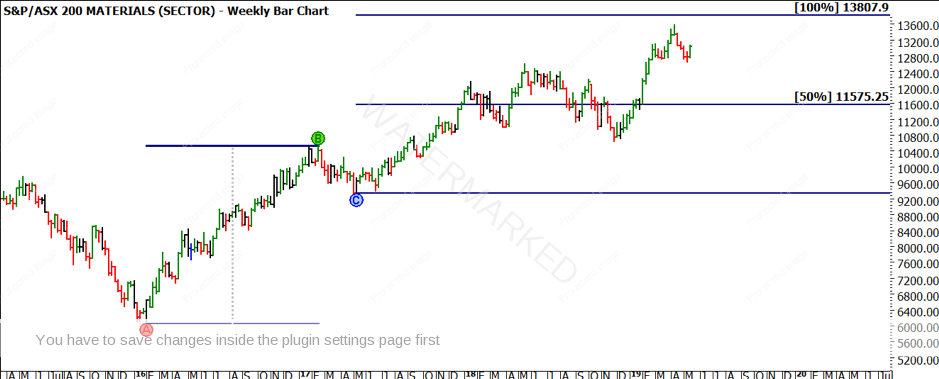
Chart 1 – XMJ Weekly Bar Chart
If we contrast this with the finance sector XFJ, Chart 2 shows since the highs in 2015, this sector has experienced a bearish to neutral bias with prices trading at approximately 50% of the range. That being said there have been some good tradeable ranges during this time so this may have produced better outcomes than purely buying and holding.
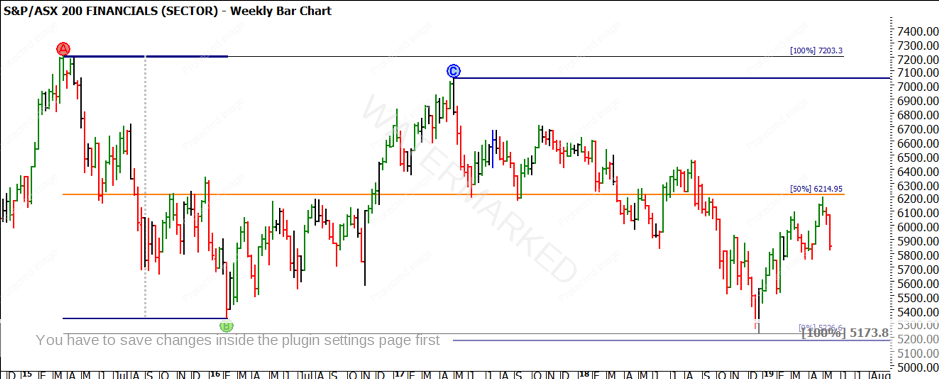
Chart 2 – XFJ Weekly Bar Chart
Indexes can tell us very interesting stories but now we can drill down to the individual stocks like BHP. The big Australian is a well known global player in the materials and mining space, and is a stock that is likely owned by many directly or indirectly through superannuation accounts. Given its size, scale and varied investor demographics it always encourages me when we see technical analysis patterns in play and more so when we see history repeating.
Chart 3 shows the three clear bullish moves we have seen since the low in 2016. The BHP share price has nearly tripled from the low of $13.48 to the recent highs of $40.13. The current pullback of the April highs is approximately 33% (much like the XMJ index) and sitting around a level of previous support and resistance so the question might be are we preparing for another leg higher?
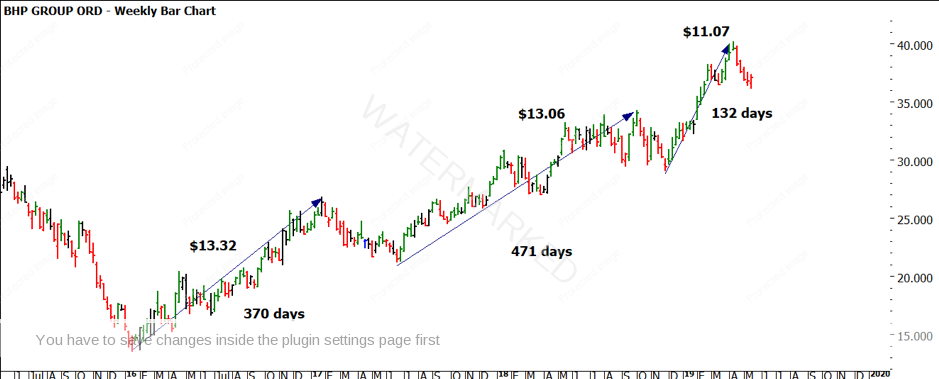
Chart 3 – BHP Weekly Bar Chart
The use of a lows resistance card also allows us to layer our analysis and tell a story. Chart 4 shows us where doubling the 2016 low (in orange) offered two areas to consider in terms of the 2017 high and 2018 lows.
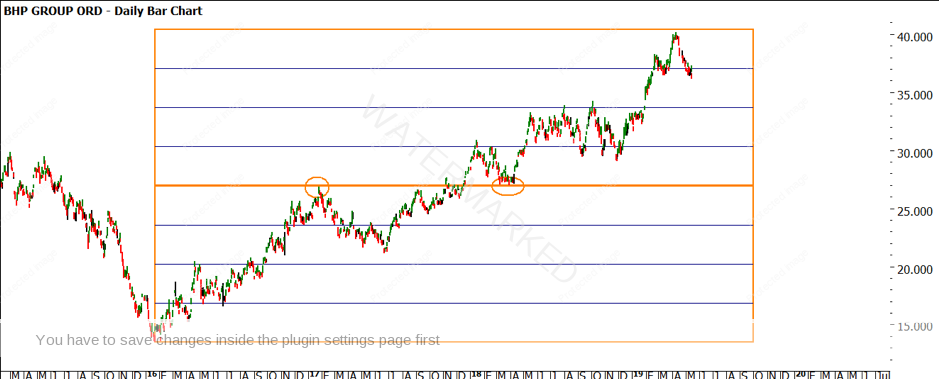
Chart 4 – BHP Weekly Bar Chart
If you had used these areas as staging points for the beginning or end of a campaign this one technique would have likely kept you on the right side of this market.
The recent price action has fallen short of three times the low (possible weakness) and is hovering below 275% of the low. The bulls might need to see some stronger closes and swing chart entries on the upper side of that level before they could be confident of better bullish price action.
I also note in Chart 5 if the price action decreases to the area of old tops and a gap in the price action it will be approximately 50% of the December to April range.
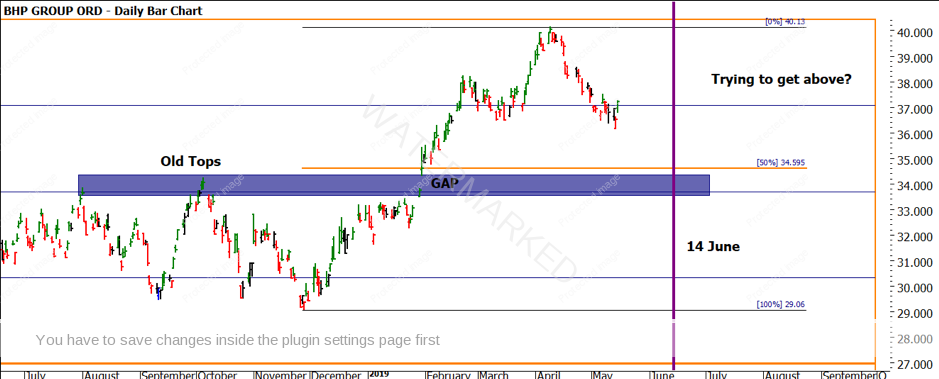
Chart 5 – BHP Daily Bar Chart
I have also marked the vertical line at the 14th of June as this would be 50% in time of the range December to April time frame.
Trading in my mind is about building possible scenarios, waiting for the market to confirm what it’s doing and then executing a trading plan around that setup. We may well see that price action climb higher above the $37 level and you could then look at the scenario of a bullish setup.
What I am seeing is the current high in April as a possible Point A, but as with all markets, we must let the price action confirm its intent. For those who are keen to apply some more time-based techniques in their analysis, a great place to start is with David’s “Chart Setup” diagram on page 26 of the Ultimate Gann Course.
Good Trading,
Aaron Lynch