Rocket Fuel
Let us put this into perspective. We started reviewing TSLA 12 months ago at approximately $200. Today TSLA trades at $1,700. For whatever reason, if you held one stock, you would have seen an 8x return on your capital in 12 months. Holding $10,000 worth of TSLA shares would be worth $85,000. That is worthy of catching your attention and taking the time to review each article and studying the position of the market, so your hindsight can become your foresight.
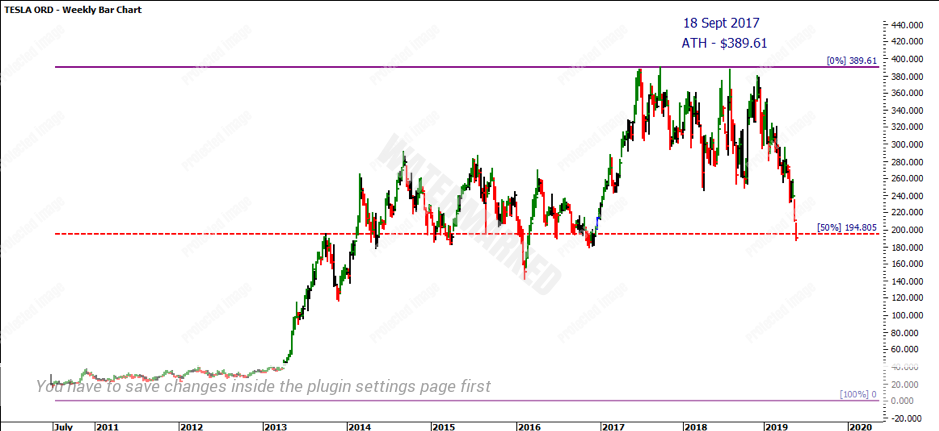
The Ultimate Gann Course students had the privilege of reviewing Tesla (NASD: TSLA) in the Platinum Article of May 2019. Our focus was waiting to see how the market would react off the All-Time High’s 50% level.
As an Active Trader, Gann saw retracements occurring at the halfway point of a move, such as 50% (which is half of 100),25% (which is half of 50%) and 12.5% (which is half of 25%). The importance of these levels is depicted by the market, where we look for pivot points in order to capture a change in trend.
The chart below shows the power of 50%. The negative media attention drove the price of TSLA into the 50% level. Large hedge funds were offloading the stock due to the unrealistic comments by Founding CEO, Elon Musk. It is often during these negative media news events as well as time and price lining up that we can see the overall value of a change in trend.
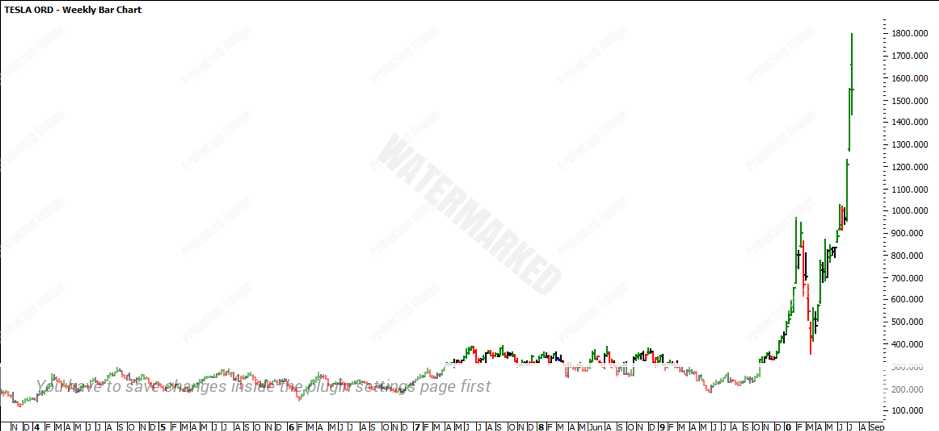
Fast-forwarding 12 months, TSLA currently sits at $1,700 with an All-Time High at $1,800. Not a bad move in 12 months if you ask me, especially given the world economy is apparently diving into a deep recession as per all the news headlines.
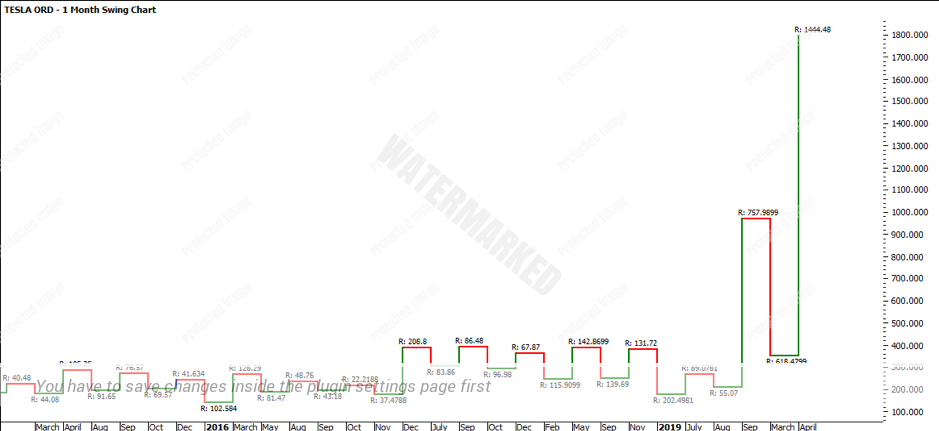
Turning to the charts below, the monthly swing chart has officially created a higher top repeating 200% of the previous monthly swing. While 200% is regarded as overbought, TSLA has broken into new All-Time Highs so there is familiarity with the pricing and it can continue to run. I suggest that you take the time to review the 2018 Bitcoin crash. Understanding the science behind what goes up must come down will give you some insight as to when the winter of the trade is close. I am not saying it is now, but study the markets to be aware of the subtle signs.
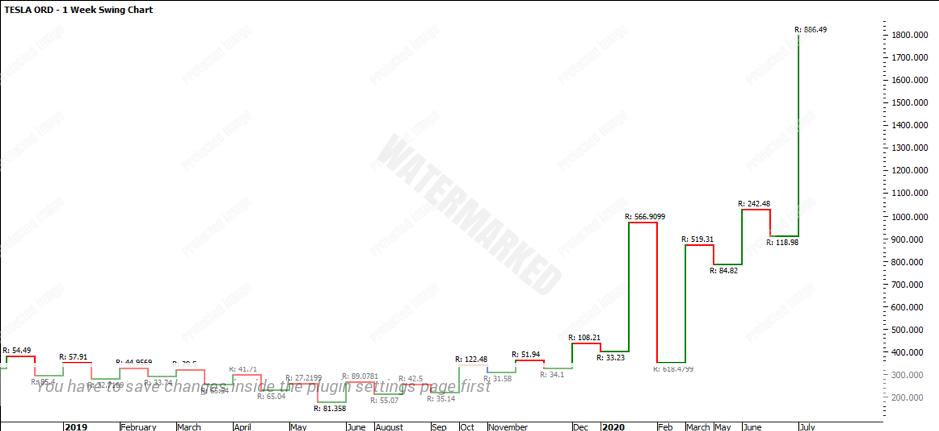
Turning to the Weekly swing chart, we have seen a range of $886.49, which is clearly overextended compared to the previous swing of $242.48. While in theory, this is overbought, experience and wisdom will have you including the range with the previous up range, making it very similar to the monthly swing chart. It is the combination of experience and theory that makes trading fun!
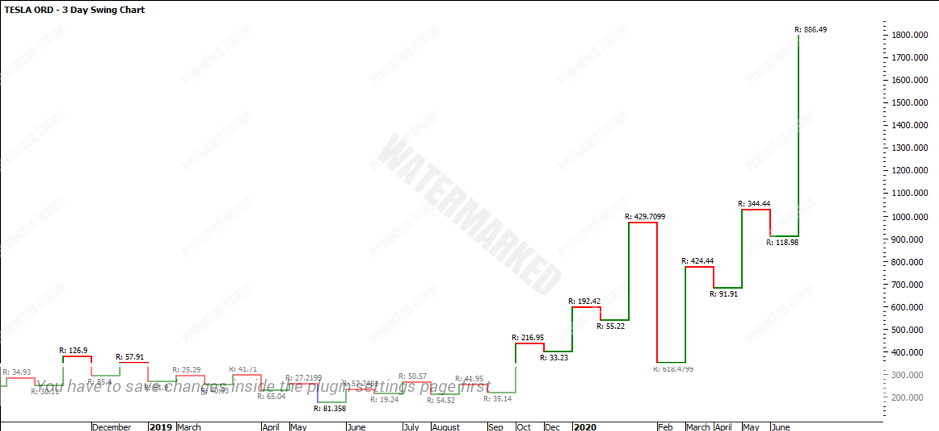
As the market has pushed through its previous ATH and rocketed away, watching the larger swing charts isn’t very practical. It is important to keep them a part of the trading routine but the most value with quick runs in a short period of time is the smaller time frames. For example, looking at the 3-day swing chart and comparing it to the weekly swing charts, they essentially look the same, as per the chart below:
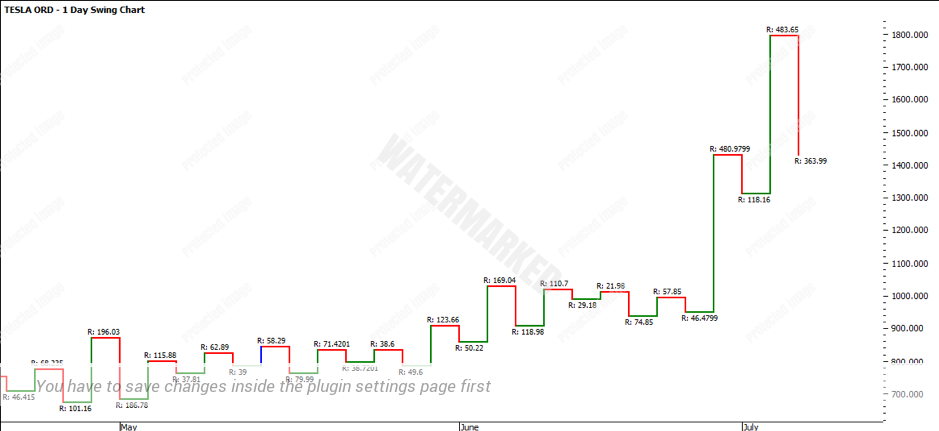
However, tuning into the 1-day swing chart, you can start to see the harmony within each move. On the 1-day swing range, you can see that the most recent swing is $483.65 and comparing this to the previous swing range of $480.97 this would be classed as a balanced market. The retracement, on the other hand, would have you question the probability of the next upswing, comparing the downside ranges of $363.99 to $118.16.
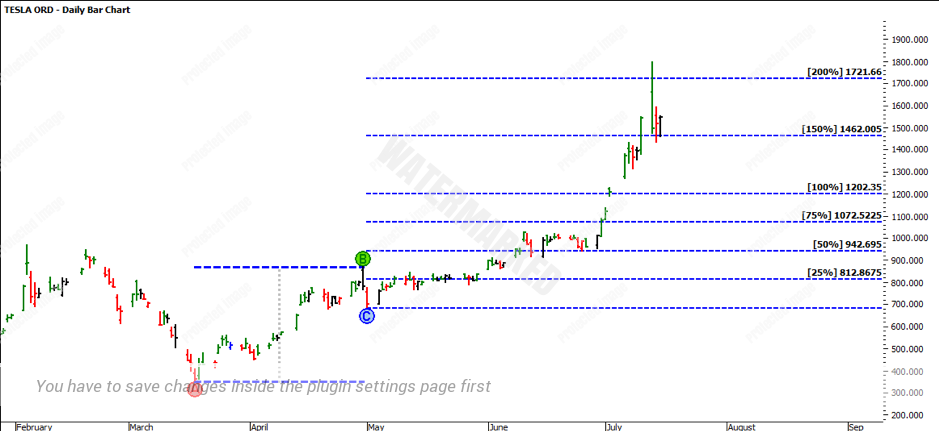
Turning to the bar chart, the FRO of the COVID Low in March 2020 has repeated 200%. The question therefore is, is the likelihood of the market going to repeat again? If so, how can you trade this setup, so you are not whipped into the market? Or would you prefer to take the more conservative approach and see a retracement back to 100%? These are questions you will be faced with every day.
It is the bigger picture that will dictate some of your decisions. Understand the season of the cycle you are trading within. We go into much more detail of the seasonality in the Ultimate Gann Course, and it will be this month in the Platinum newsletter that we can break down the seasons of the TSLA series to understand the journey of the trend.
In closing, I would like to say a huge thank you to those who have followed the TSLA journey, followed your plan and have harvested the rewards! Those who read the newsletter and are involved with Safety in the Market are on the road to a very prosperous journey.
It’s Your Perception,
Robert Steer
