Silver Linings
As we have discussed many times, traders need several markets on the boil at any time with regards to their level of familiarity to combat the scenario of a market that is sideways or not behaving to your rules and that of your trading plan. Think situations where volatility is so large it does not allow for adequate risk management. The case in point would be Crude Oil when we see in Chart 1 a sideways market that has offered no real tradeable ranges (outside of an intra-day time frame) to warrant us taking the risks.
Chart 1 shows Crude Oil and its moves since April 2020, from the new All-Time Low at $6.50 to the June high just past $40 we have seen a sideways range for the last 42 days with prices trapped between $34 and $42. Most would agree that this is not the most appealing range to be trading.

Chart 1 – Daily Bar Chart Crude Oil
It helps to have markets that we can pick up quickly and are trending. It’s fair to say there is always opportunity around, but how do we pick up quickly to allow traders to keep the momentum and account ticking over? David gave us good guidance when he said we should have a stock index, currency, and commodity as three separate markets that should allow us the environment to keep trading.
For me, I have struggled somewhat with selecting a currency that is diversified enough from the commodity space to ensure they are diversified. David chose the Swiss Franc and I can see why, as it’s not necessarily linked to the major commodities. When I think of the USD or the Australian Dollar, they are both linked to similar geopolitical or economic factors so may not offer the outcome required.
I took a different step by selecting several commodities across the spectrum, be it in energies, metals, or soft commodities. You can reflect on the article where I discussed copper last month (insert link), this market has continued back above the 50% level and added about 10% since the article, so it’s a market we can get into.
The question of where to start to set up a new market is a valid one. I tend to keep it simple and I look for swing charts that offer the textbook staircase pattern and then also ranges in price and time that either repeat or vibrate to numbers that Gann and David tell us to watch.
If I asked you to digest the following time frames in the table below, would this get you thinking this could be a good Gann market?
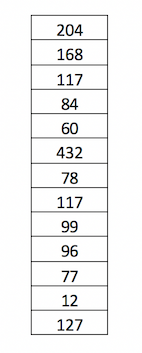
We can see natural numbers (168, 84 is half), 117 is repeated (close to 120). These time frames are taken in calendar days and span a market period of nearly 4 years with price action swinging approximately 200% higher than the starting price and 15% lower than the starting price.
If we add the same ranges in time and measure them in trading days, we again start to see the relationships forming between numbers in terms of repeating and natural numbers like 52.

Of course, we can undertake more detailed analysis of ranges and go back even further, one better option would be to measure the ranges from top to top and bottom to bottom, this exercise could open up more possibilities or ranges repeating etc.
The market I have selected here is noted in Chart 2 below, the precious metal silver. This market is one, along with gold, that I have avoided to a degree given the hype around them.

Chart 2 – Daily Bar Chart Silver
The recent ranges have seen good trading opportunities as prices have moved from $11 an ounce up to approximately $24. The time frames in the tables above come from this period (late 2015 to today). I have applied a 2-month swing chart filter over the period to smooth out the ranges and limit the turning points to 12. This provides more than enough data for our purposes.
I also look to test on fresh markets the relevance of price pressure points and the lows and highs resistance cards. Chart 3 shows the HRC from All-Time High in 2011 @ $49.82. You can note there are a number of key areas circled where support and resistance are seen. I am particularly interested to see if price can reach $24.91 and what it will do if It gets there?

Chart 3 – Daily Bar Chart Silver
We can also tackle the lows resistance card using the $3.51 per ounce low from 1991. In Chart 4 we can see how multiples of that low have assisted us with trade setups in recent times.

Chart 4 – Daily Bar Chart Silver
Silver’s price action has been strong in recent times and is approaching 7 multiples of the 91 low, potentially we could see if the 50% of All-Time High and the lows resistance card cluster closely together?
Finally, it would be worthwhile considering the month of August in the history of this market, again to look for patterns around the same time each year. A quick study of the month of August may inspire you to dig deeper for patterns that could be tradeable. I do not want to spoil the result for you but if we look to master time cycles as a guide, then August and Silver could produce some tradeable moves. This can help us ride out the sideways blues on markets like Crude Oil. There is some work to be undertaken to tie this article’s themes together into something practical, I commend you to the task at hand and feel free to share any question or comments you may have with Di, she will ensure they make it through to me.
Good Trading
Aaron Lynch