Simple Techniques for Weary Markets
10 years on from the GFC, the markets seem a bit tired…
When I look around the trading landscape, the participants, the media and all those who are associated with markets seem a bit tired. The things that make us tired are not too hard to understand, the perma-bulls and perma-bears continue to read from the same script, the same old stories about markets are recycled on a regular basis in the media. My personal favourite is how many billions of dollars were wiped from a market when there is a flashing red day. We never seem to hear how many billions are added on the good days. Quite simply we are 10 years on from the GFC, an extended bull market has been in play and no one can really tell what’s next. What we can agree on is that it is feeling a bit harder.
The level of volatility is one that needs to be respected, the market seemingly does not want to crash and burn like the doomsday preppers would have us believe… yet. We see that gains and a sense of calm are followed by falls very shortly after (in the case of stock indexes). To my mind the “investors” out there are readjusting to the reappearance of standard returns in stock markets, the double digits growth year on year is kind to our super, but nothing lasts forever. The state of markets is changing, one could say maturing and we need to adjust if that’s the case.
In Chart 1 I have used the US S&P500 as a guide to the sideways feel and the increasing volatility that we are experiencing. My take on this is that there is an incredible amount of “noise,” hearsay and information in markets to process and this is very tiresome. When we consider the current environmental, political and conflict driven uncertainty it’s not surprising we need a rest… We know markets hate uncertainty and we have that in spades. I am not suggesting we need a massive crash or epic bull market to reinvigorate our attention, but again as traders we have the added benefit of being able to take a break from markets when required. Adjusting your mindset to meet conditions is something I learnt through experience, as opposed to study or looking at a chart. You just need to see enough markets over time to get a sense when the under current is moving.
Chart 1 aims to identify two broad trading ranges that we can see since January 2018. The 2600 to 2900 range covers the bulk of the data with a few outliers on either side. The more recent 2790 to 3030 range is narrower as a price band, but the underlying volatility indicator is suggesting a nearly 50% increase in volatility since 2018.
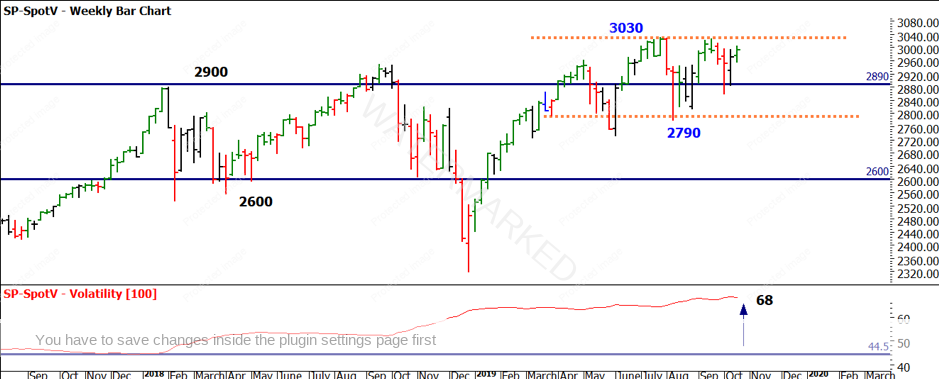
Chart 1 – S&P 500 Weekly Bar Chart
Markets don’t have to do what they don’t want to do, and many have wished the market lower and each time it’s been forced down it has picked the price back up again. I did title the article around simple techniques so the crux of this article is for us to step back and listen to the story of what the chart is telling us, if a market wants to go higher or lower we really need to see it expand in the preferred direction and contract the other way. This can occur in both time and price.
Chart 2 details the big down ranges on the S&P500 futures contracts since 2018. There is some interesting symmetry in these numbers in their simplest form. If we look at the largest of the ranges down (629) from the 2018 high to low, it was followed by a 711-point run up.
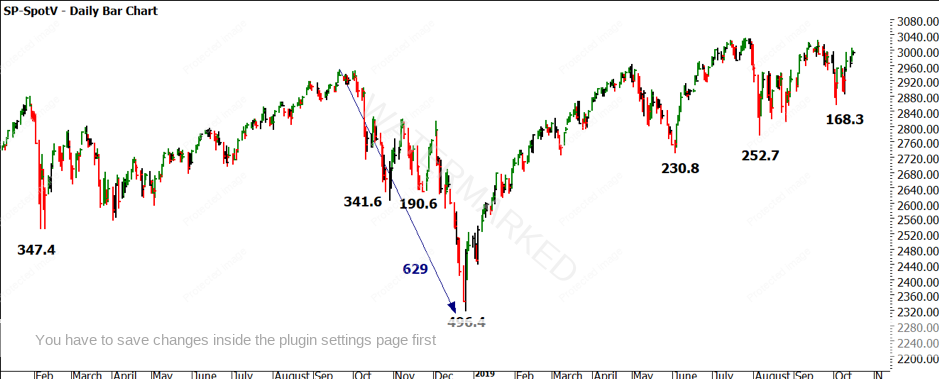
Chart 2 – S&P 500 Daily Bar Chart
In more recent months we have seen the price move more sideways but ranges to the downside are similar and contracting when we look at the most recent 168.3-point range. We could draw some conclusions with a caveat to watch for new information. The market is moving sideways and until we can see a downside range that exceeds the previous ranges (and preferably shows expansion) we may continue to see the market gyrate up and down. This aligns with a more volatile period of trading and could support a trader’s mindset more than an investors viewpoint.
This simply put would see us holding positions for shorter periods potentially and being comfortable to trade both sides of the market. I will leave you to perform the same analysis on the upside ranges as we could see a breakout opportunity as we near the record highs on the S&P500.
Switching to the Australian markets and of course the SPI200. This time of year always gets me thinking of the SPI for so many reasons: famous forecasts, major crashes and of course the Bathurst 1000. I can’t help but think of David when Bathurst is running having had the pleasure of seeing his car collection in person.
Chart 3 paints a less sideways bias as we see the SPI in recent times (2019) has driven higher, this should be seen in the context of the years where it has underperformed world markets and did travel mainly sideways.
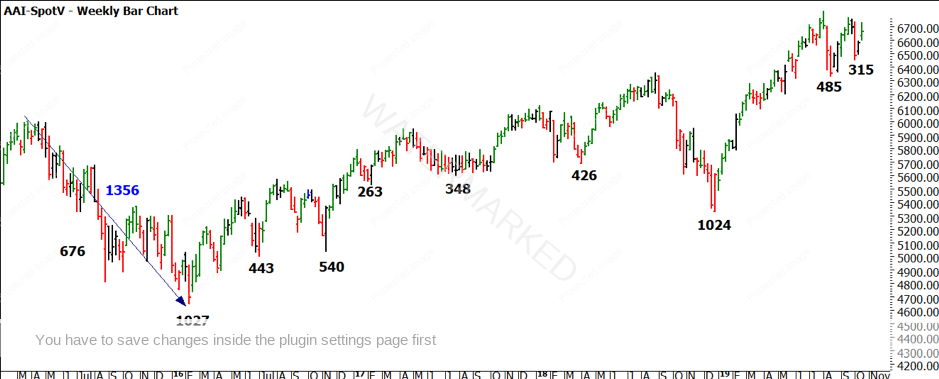
Chart 3 – SPI 200 Weekly Bar Chart
There is immense value in measuring big ranges and watching them repeat or otherwise. This chart heads back as far as 2015 and we can see lots of symmetry again in the numbers. The largest downside range was 1356 which is approximately 6 multiples of 224 and nearly 3 multiples of 458.
Again, to allow the market to tell the story we need to read the movements up and down and watch for expansion or contraction. If markets are to crash, then we would expect contracting upside ranges and expanding downside ranges. I am breaking down this analysis into bite size pieces as its approachable. Alone this work is not sharp enough to really get you trading in the sweet spot, however if you can combine another layer of upside ranges and then do the same in time you have a more complicated picture but also a much sharper scalpel to take cuts out of the market. It becomes a case of being able to interpret the picture correctly and then apply your swing trading plan.
Gann had so many techniques to apply to markets and that makes him a blessing and a curse. We don’t need to use all of them all the time, we can keep it simple. I challenge you to complete the other analysis I have suggested, but more importantly step back and layer the information. What is it telling you and how can you combine that with your trading plan? If you can accomplish that successfully there will good trading opportunities ahead.
Good trading,
Aaron Lynch