Taking the Time
One of the most powerful analytical tools that both W.D. Gann and David Bowden talk about is the power of time. Time is more important than price and in particular during times of uncertainty it is a great way to build a road map to have some sort of guidance.
This month we will focus on the ‘Natural Seasonal Time Periods’. W.D. Gann wrote about this in his Stock Market Course. He said:
“These seasonal time periods can be started at the beginning of any given season, but my experience has proved that they work out best by starting with the Spring Season, March 21, in a year. These periods run as follows:”
The following chart was replicated from W.D. Gann’s Stock Market Course. You will note that Gann somehow left relevant information out of his texts. Whether that was to make the student more engaged or to bring mystery to his education, we will never know.
Natural Seasonal Time Periods
[table id=37 /]
Gann explains that:
“By checking the dates when extreme highs and extreme lows have occurred, as well as the minor tops and bottoms, you can see how often these prices come out around the dates for seasonal changes.”
Gann said:
“To get the correct time period from any high or low, you first add 1/8 of a year or 6 1⁄2 weeks to the high or low date. Next, add 13 weeks or 1/4 of a year until the anniversary date is reached as you will see on the Table of Time Periods.”
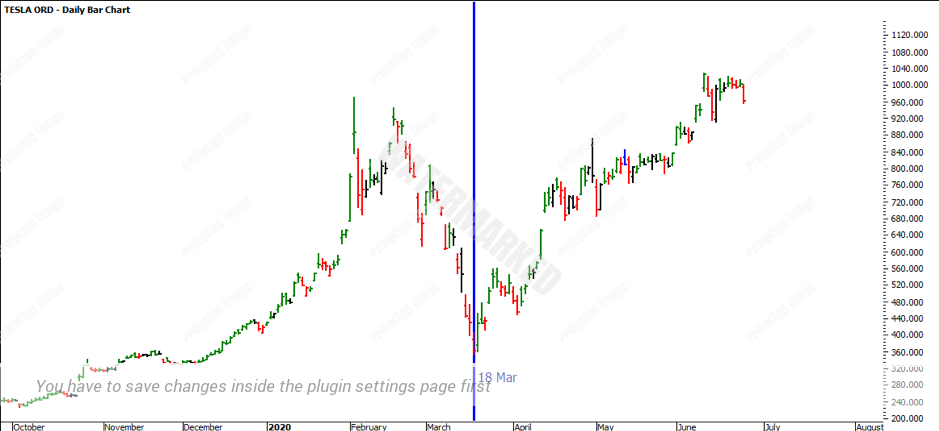
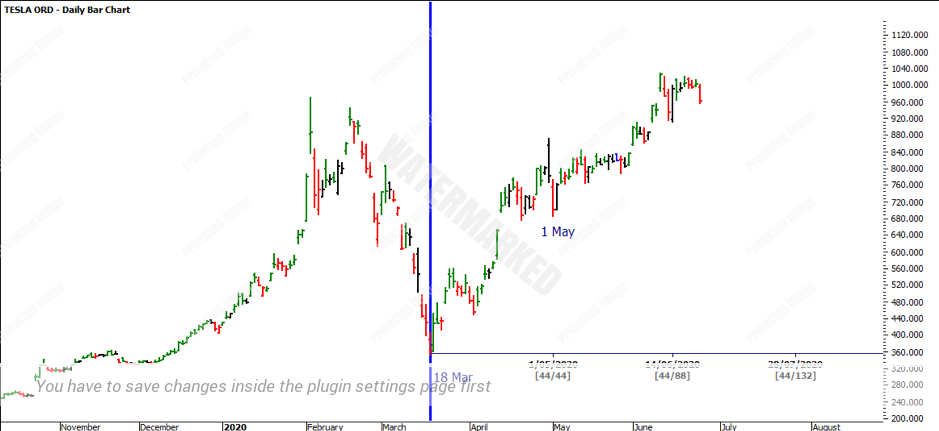
Dividing 365.24 days by 8th’s and 3rd’s you will start to watch for areas of natural seasonal dates. In this case, 365 days divided by 8, you will get approximately 45 days from the seasonal date. TSLA had its low on 18 March 2020. If we project 45 days forward, that was a Saturday, however, the Friday at 44 days was 1 May 2020 which was the swing low.
As per the table above that was in reference to Gann’s comments in the Stock Market Course, he states:
“This timetable shows all of the important highs and lows and the date when the prices have been recorded. By looking down the column marked “6 ½ weeks” or 1/8 of a year, you get all of the periods which are 1/8 of a year from any high or low date.”
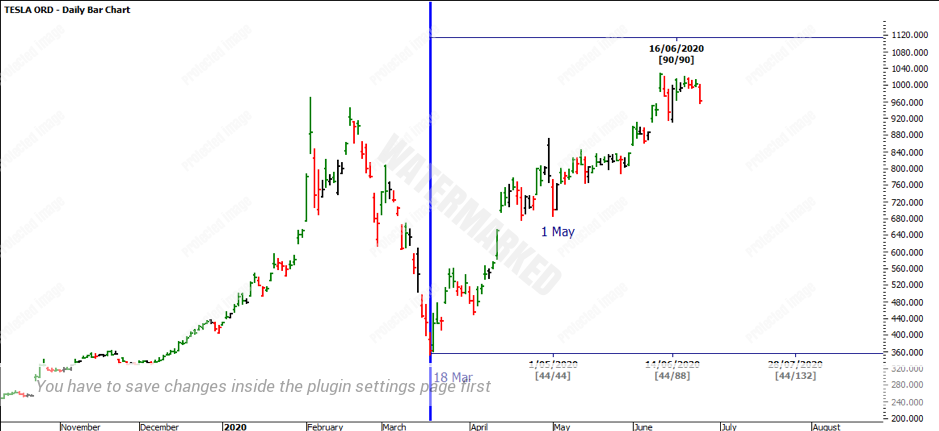
Again, by projecting another 45 days forward from 1 May 2020 or 90 days from the 18 March COVID Low, the market was able to break into new All-Time Highs. 90 days from 18 March is 16 June which is more likely the lower swing top from the ATH. While this break is around the Natural Seasonal Time Frame, there is no clear evidence as of yet, if the market has produced a top or bottom. This is where you want to refer to your swing charts to keep you safe.
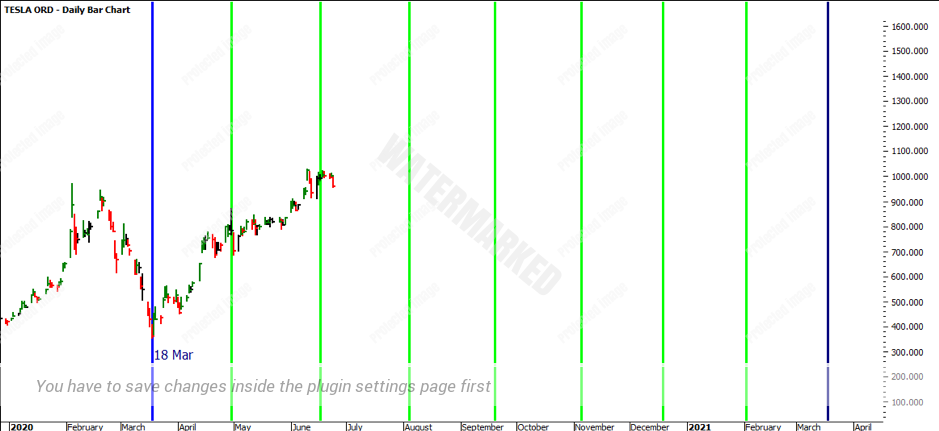
We have now seen TSLA produce some sort of high around 90 days/degrees from the COVID Low. The following table breaks down the rest of the Natural Seasonal Dates for the year. These will be worth watching for as TSLA continues its journey.
1/8 Natural Seasonal Time Periods
[table id=38 /]
In closing, you have now seen the power of Natural Seasonal Timing. Take a word from Gann and:
“By going over the record of prices in the past, you will find that the largest percentages of high or low prices have occurred 45 to 50 days before the date of a previous high or low, or 45 to 50 days after the date of a high or low. Therefore, the periods under 1/8 or 6 ½ weeks, and the periods under 7/8 or 45 ½ weeks, are very important to watch for a change in trend. Often these prices come out around the dates for seasonal changes.”
Happy trading and looking forward to hearing how your road map performs.
It’s Your Perception
Robert Steer


