
The Value of a Single Chart 2.0
In last month’s article I attempted to take my broad view and scale back to a single chart, these were end of day and using moderate amounts of data. This month I’d like to examine the same concept, but stepping down into the smaller time frames, in this example a 4-hour chart.
Our mantra of history repeating, of cycles and Wheels within Wheels to my mind are ever present. We just need to attune our viewpoints and combine the perspectives. I am the first to say its easier said than done, it’s this interpretation lens that can find us overwhelmed with data when we see so many indicators and, in some cases, rather than seeing agreement we see disagreement.
Chart 1 starts on a daily chart for Crude Oil, the low on the 6th was a good place to get long and we can use the previous range in price and a speed angle to guide us in time.
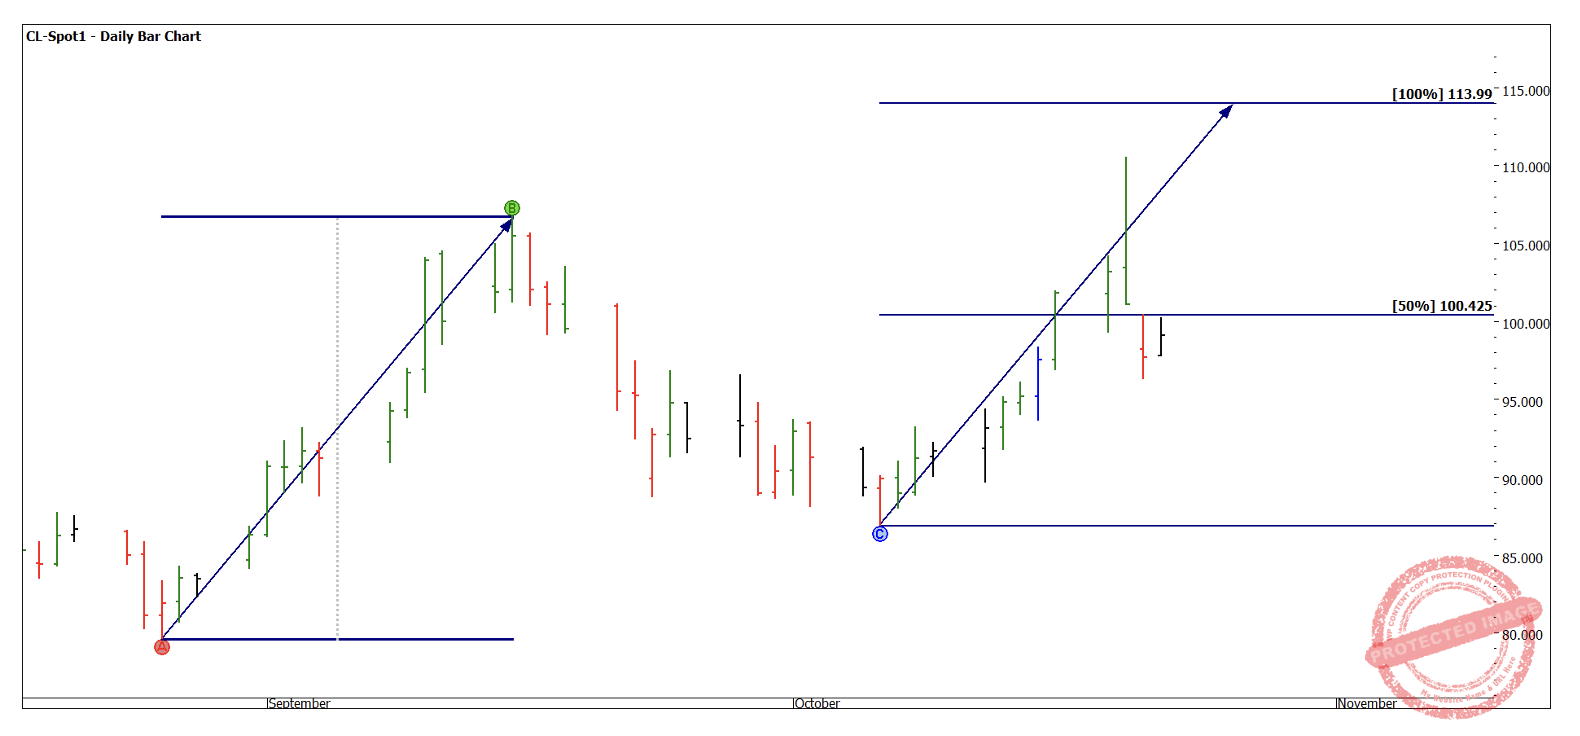
Chart 1 – Daily Bar Chart CL- Spot1
Chart 2 takes us into the intraday world, and its fair to say I have not seen an intraday chart this harmonious for a while. I will use both 4-hour and 1-hour bars for analysis and entry.
If we see the low moving out from the bottom of the chart, we can measure the top-to-top relationships in time. In many cases the numbers are repeating around 6 bars (24 hours), and we also see 200% of these numbers at 13 bars.
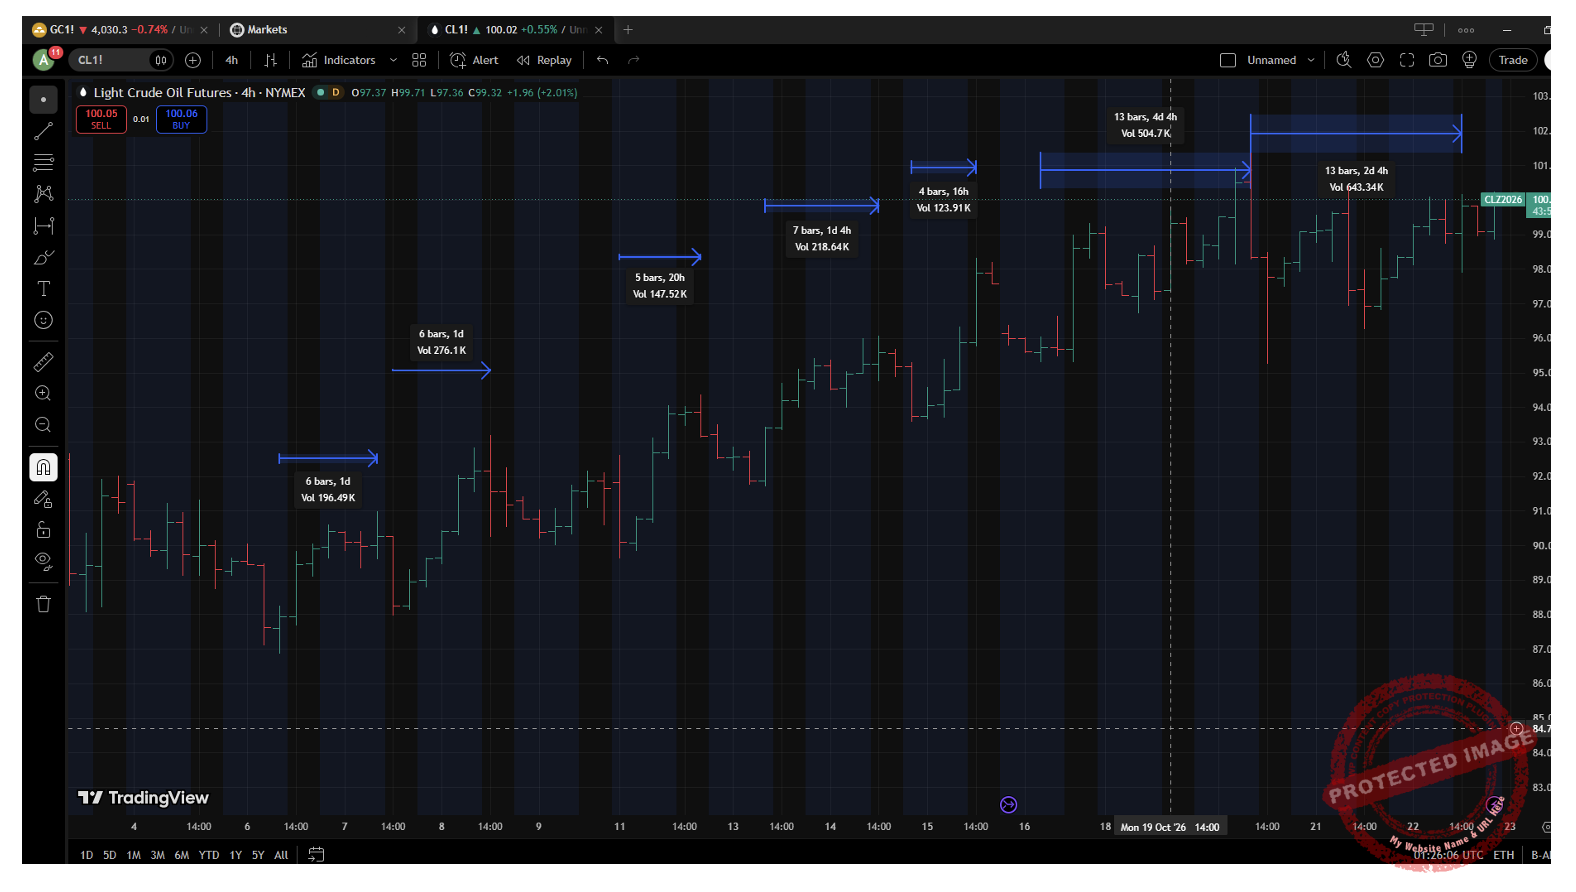
Chart 2 – 4 Hour Bar Chart CL-2026.Z
A good study for you would be to measure the price action on the way down, in many cases its 50% in price (and also time.)
Chart 3 shows the same technique, however, measures the bottom-to-bottom patterns. We again see many of the same numbers appearing. One of the great benefits of analysing a market like this in real time is it gives you the opportunity to learn and interpret faster. However, it’s important to be cautious as the seductive nature of intraday can be like a moth to a flame.
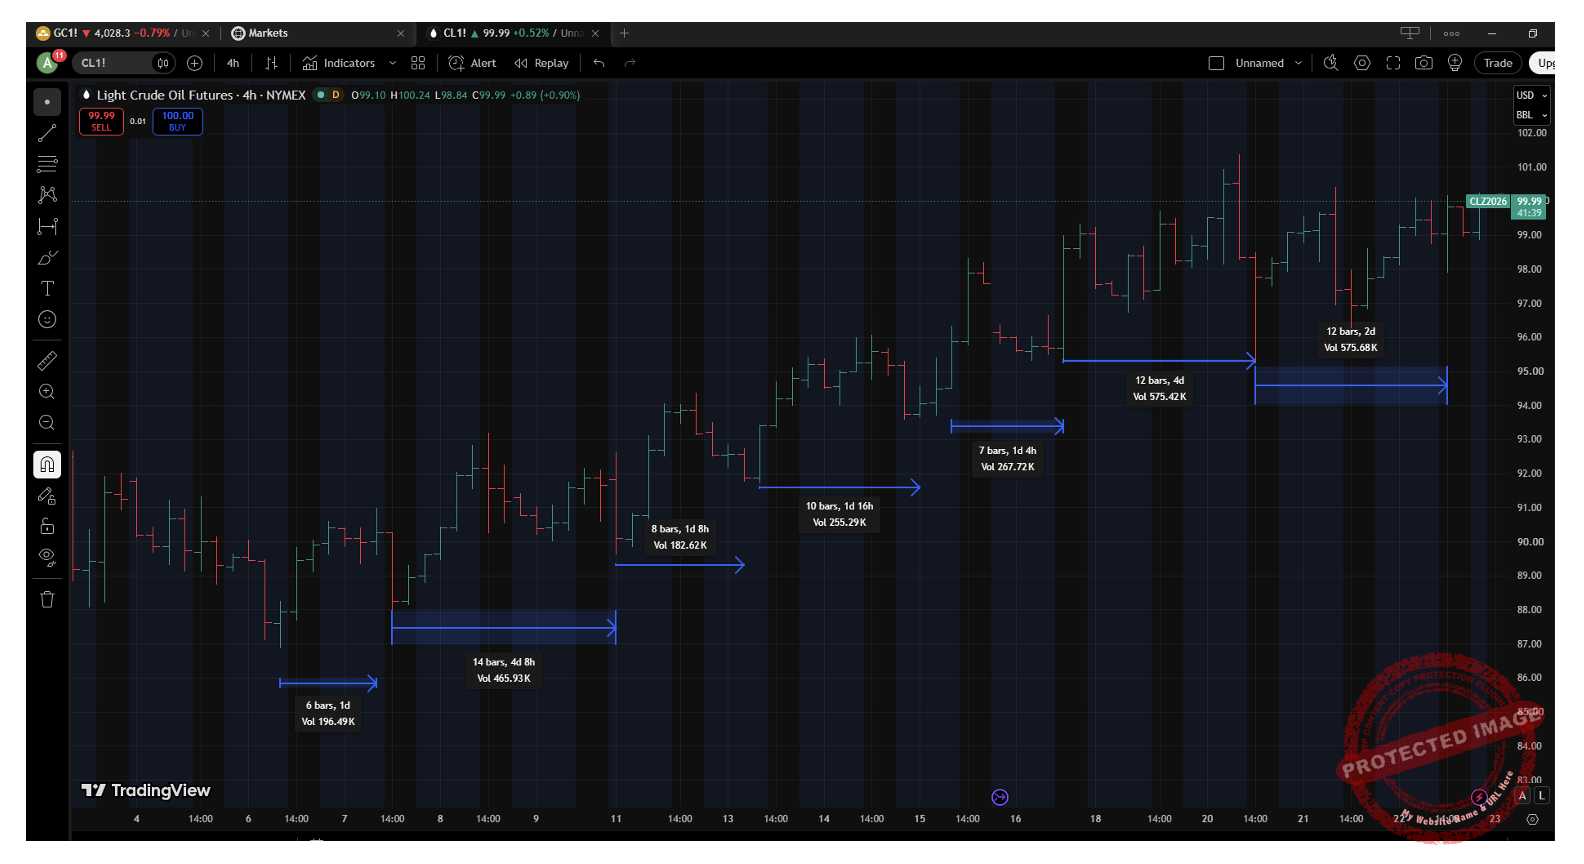
Chart 3 – 4 Hour Bar Chart CL-2026.Z
The next logical step is to look at bottom to top and top to bottom, I have only included in Chart 4 the bottom to top calculations.
I am using the current high on the 20th of November as the termination point of the trend and to date the market has moved sideways from here.
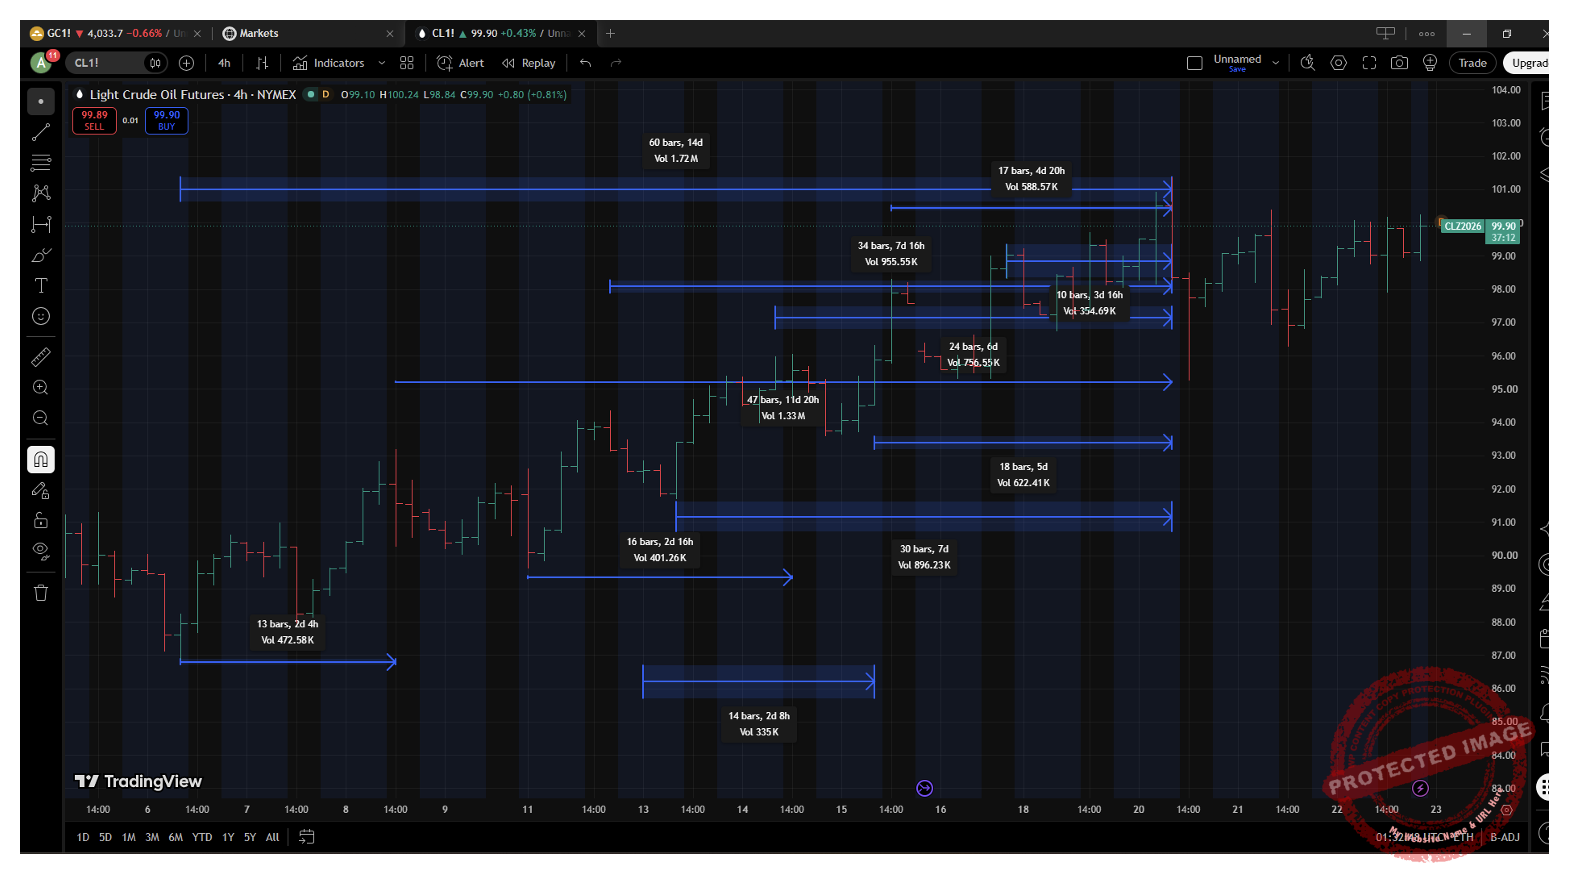
Chart 4 – 4 Hour Bar Chart CL-2026.Z
The final Chart is where I still pinch myself with market geometry. The bottom to top run was 60 bars or 240 hours. The mid-point in time was 30 bars or 120 hours.
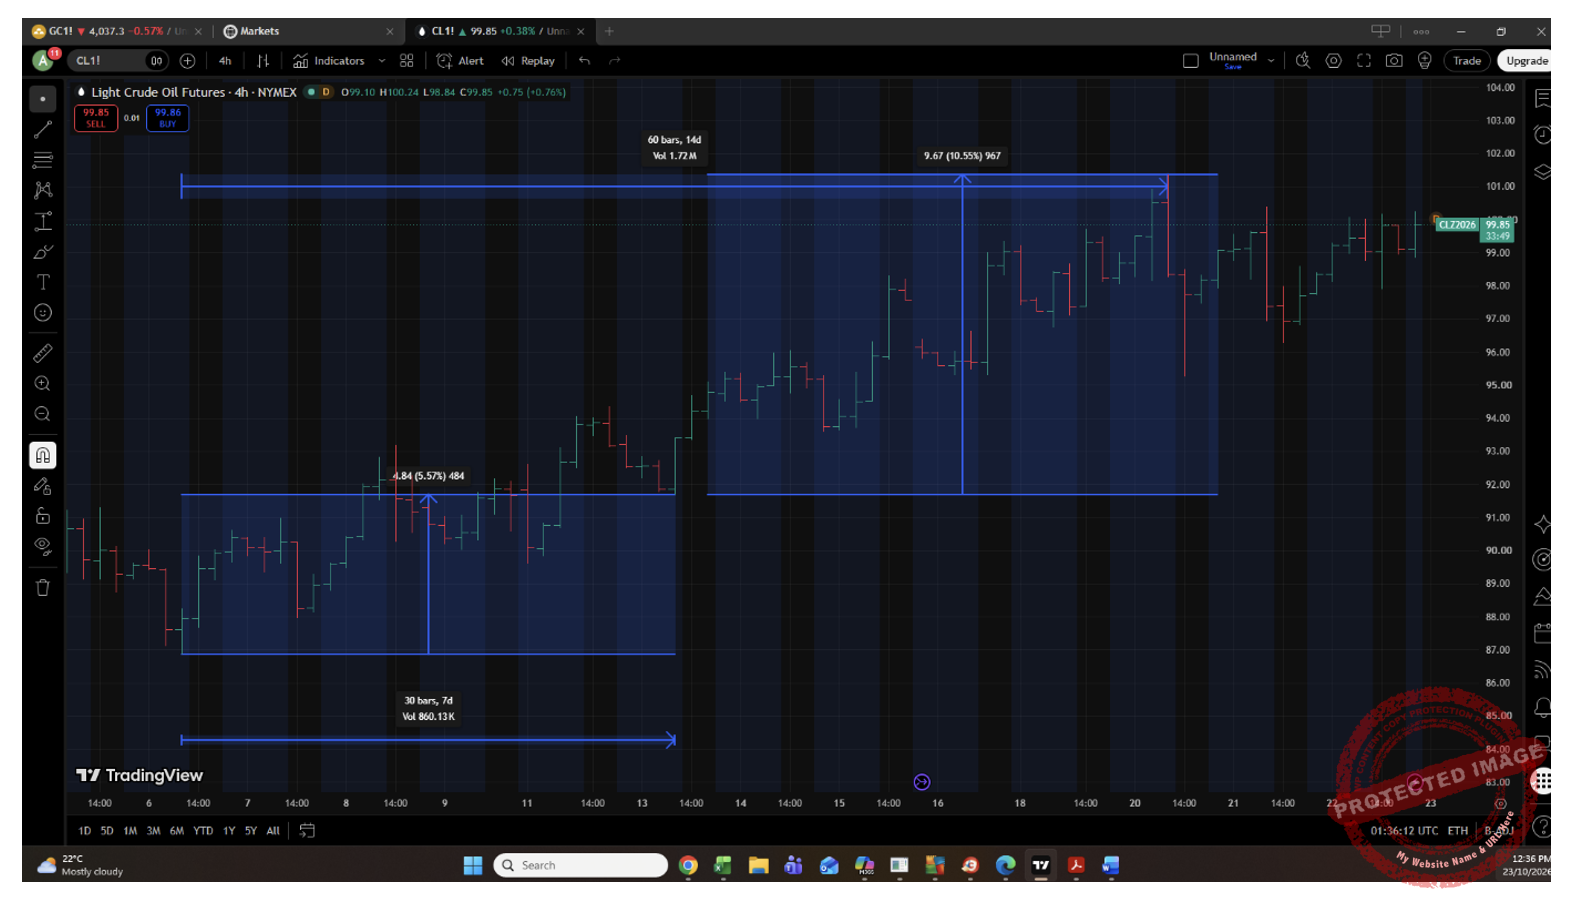
Chart 5 – 4 Hour Bar Chart CL-2026.Z
Using the price range of that move, which was $4.84 in 30 bars, the next 30 bars moved $9.67 (only 1 cent off $9.68) which was 200% in price.
This could have been used as a price and time exit point on the intraday chart; there were also lots of opportunities to add along the way.
We see patterns operating on all time frames, our job is to locate, group together and then act when our plans allow us. When I see examples like this, I am forced to wonder if we will see it this good again? That bias is a normal one, what I do know with my logical brain is that this will occur again and again on markets, I just need to be good enough to find them.
Good Trading,
Aaron Lynch