TSLA Series
This month, we continue our discussion on Tesla.
This month’s article will be a continuation on from last month’s article on Tesla (TSLA). If you haven’t already done so it will be worth reviewing the last few articles to gain a better understanding of the set up. It will also be a great time to review the current position of the market using the fundamentals such as swing charts. As any professional would, it is important to review the fundamentals first in order to have a productive training session.
The chart below is the monthly swing chart on TSLA. As you can see, the monthly chart has created a higher swing bottom. The previous monthly swing range down showing a range of $202.49 is overextended based on previous ranges. In saying that, the range of $55.07 is contracting and has made a higher swing bottom. Currently there is confirmation of a push from the bulls with a range of $89.07 so we shall wait to see if it will be a weak, balanced or strong upside range.
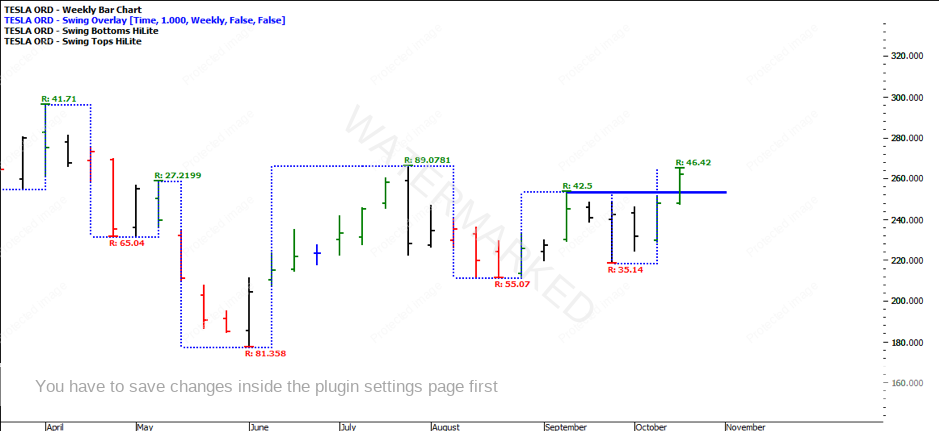
Zooming into the weekly bar chart with a swing overlay, you’ll see the weekly trend is up. The average of the last 10 weekly up swings is $54.79. When the market first pushed out of the June low it produced a range of $89.07, followed by a weaker range of $42.50. We currently have an upswing in motion with a range of $46.42. It will be important to see this range exceed the average swing in order to show strength in the move and also clear out previous tops at $266. The downside weekly swings are contracting, moving from ranges of $81 to $55 to $35.
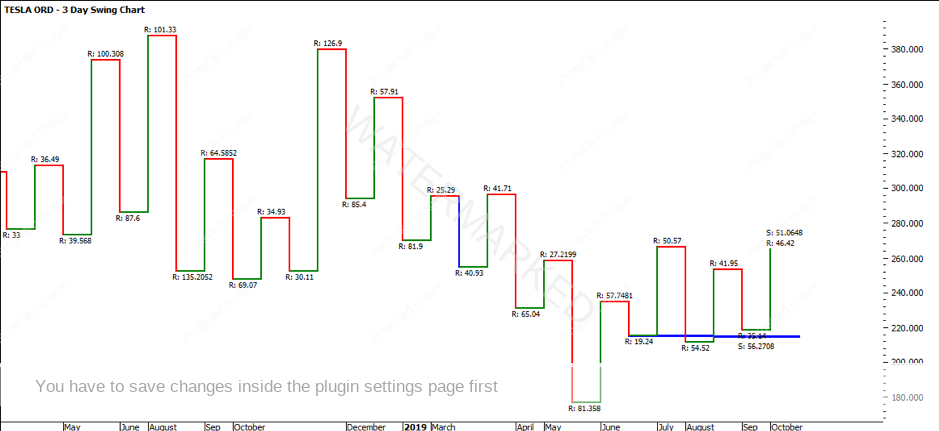
The 3-day swing chart is currently up, having found support at approximately $216. Upside ranges are expanding, and downside ranges are contracting. The 2-day swing chart is currently uncertain, with obvious upside bias.
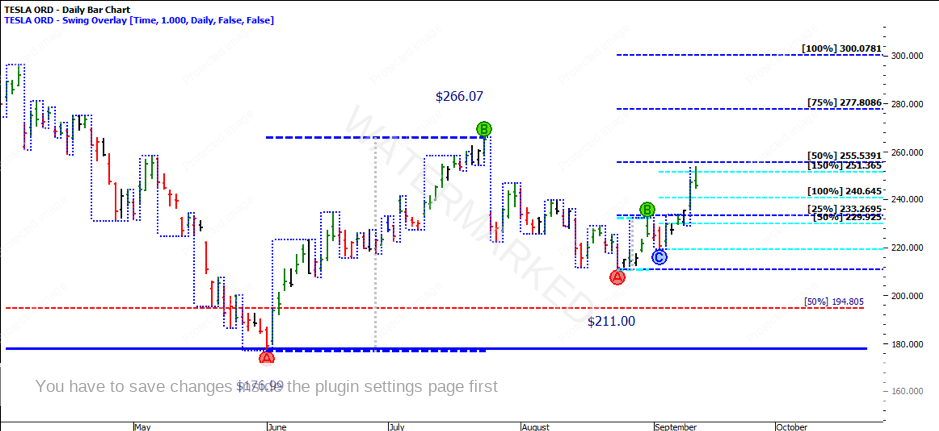
If we turn to the daily bar chart with a swing overlay, you can see that the current market action has broken the previous top at $253.50. The daily swing chart trend is uncertain with a current upside swing of $40.50. The previous upside swing was $9.83 which wasn’t necessarily of any importance (probably more so a re-test), so looking at the previous range before that was $30.35 – so we currently have expanding upswings if you look at it that way. Notice the similar pattern of the previous two where $7.79 range followed on from the $24.56 range. Do you think it will be mindful to consider something similar?
Moving on to what was spoken about last month, what we were waiting for was a potential pullback to confirm the strength of the market which would determine what the next move might be. (Note the below chart is from the September 2019 article).
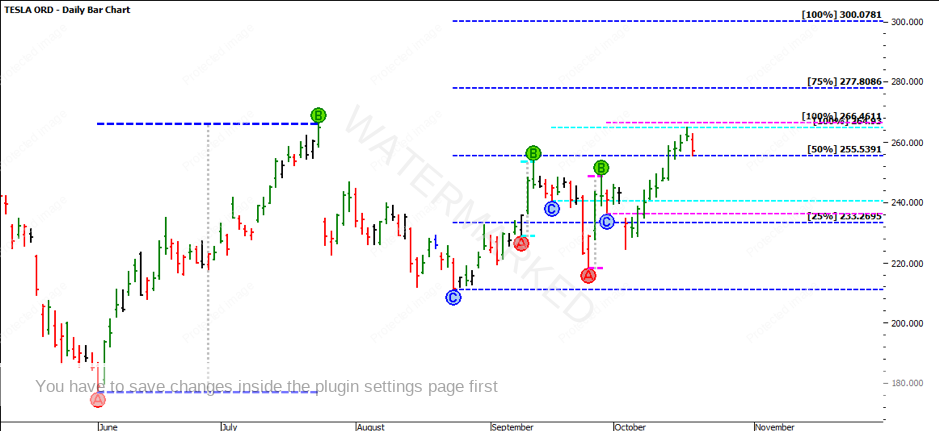
As it turns out the market produced another two daily ABC long (light blue and pink) which would have got you into the trade, followed by a deeper pull back prior to forming a solid weekly swing bottom.
Once the market had consolidated and found its bottom, it was able to push out of there relatively solidly, breaking the previous top on the 12th of September at $253.50. The current weekly ABC long would have you moving stops to entry plus commission as it has broken through the 50% level and come back and sat on this level which was previous highs.
In the next few weeks it will be about watching a similar pattern forming on the pullback. Be sure to stay in tune with the weekly ABC milestones.
It’s Your Perception,
Robert Steer


