
Up and Away?
In the W.D. Gann Commodities Course, Gann explains how monthly angles can help determine whether a market is weak or strong. He says you can draw angles at 10 points per day, per week or per month.
After some testing, I’ve found the SPI200 responds well to monthly angles using a setting of 100 points per month. I only apply these medium-term angles to the most recent monthly tops and bottoms, where they have been reliable support and resistance levels recently. See Chart 1 below.
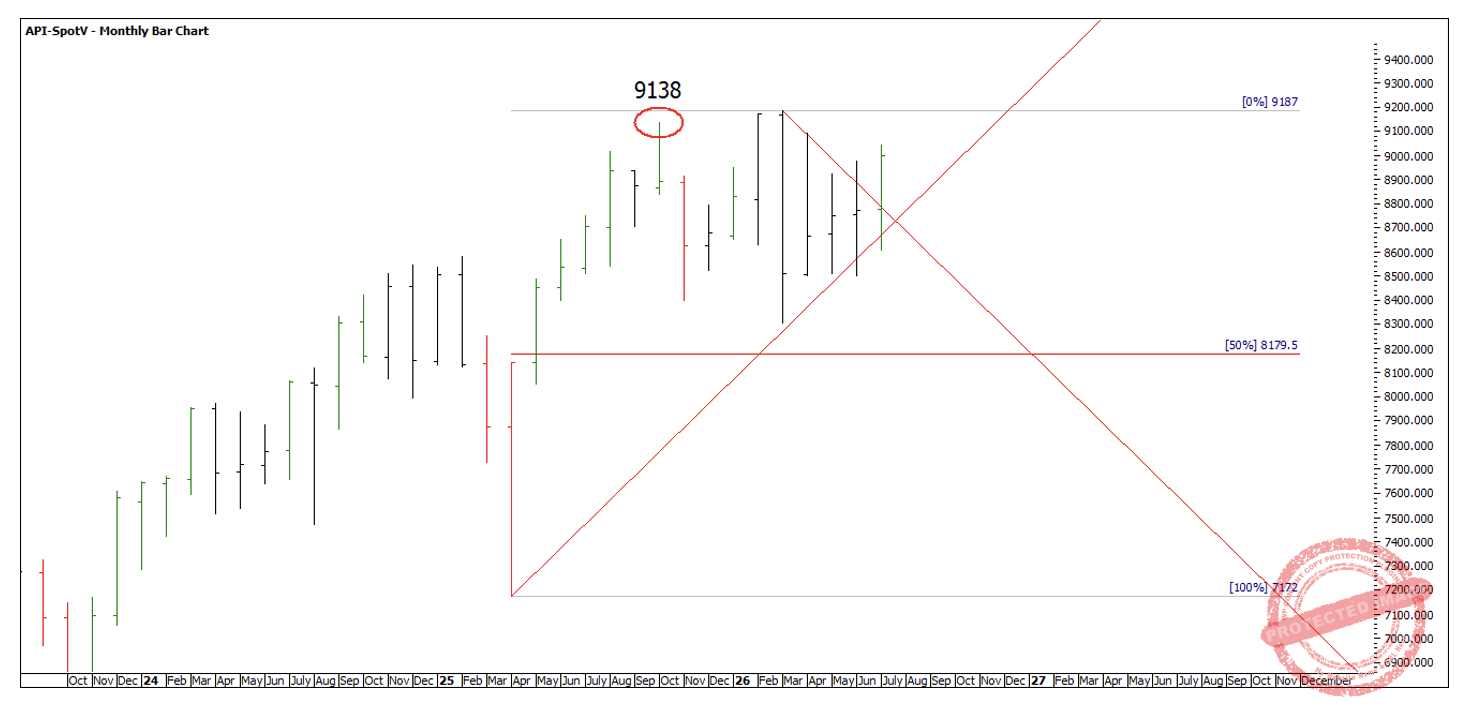
Chart 1
With only one trading day remaining in July, the SPI200 is trading comfortably above the 1×1 angle running down from the all-time high. If the market closes the month above this angle, it will mark the first monthly close above this important resistance, suggesting the market may finally be breaking out of its extended sideways pattern.
The daily action has also been encouraging. We’ve seen three consecutive strong up days, breaking through several previous bar chart tops, accompanied by a noticeable increase in volume on Wednesday, with 57.7k contracts traded. After a month of relatively light volume around multiple 50% retracement levels, this increase in participation could signal that buyers are regaining control.
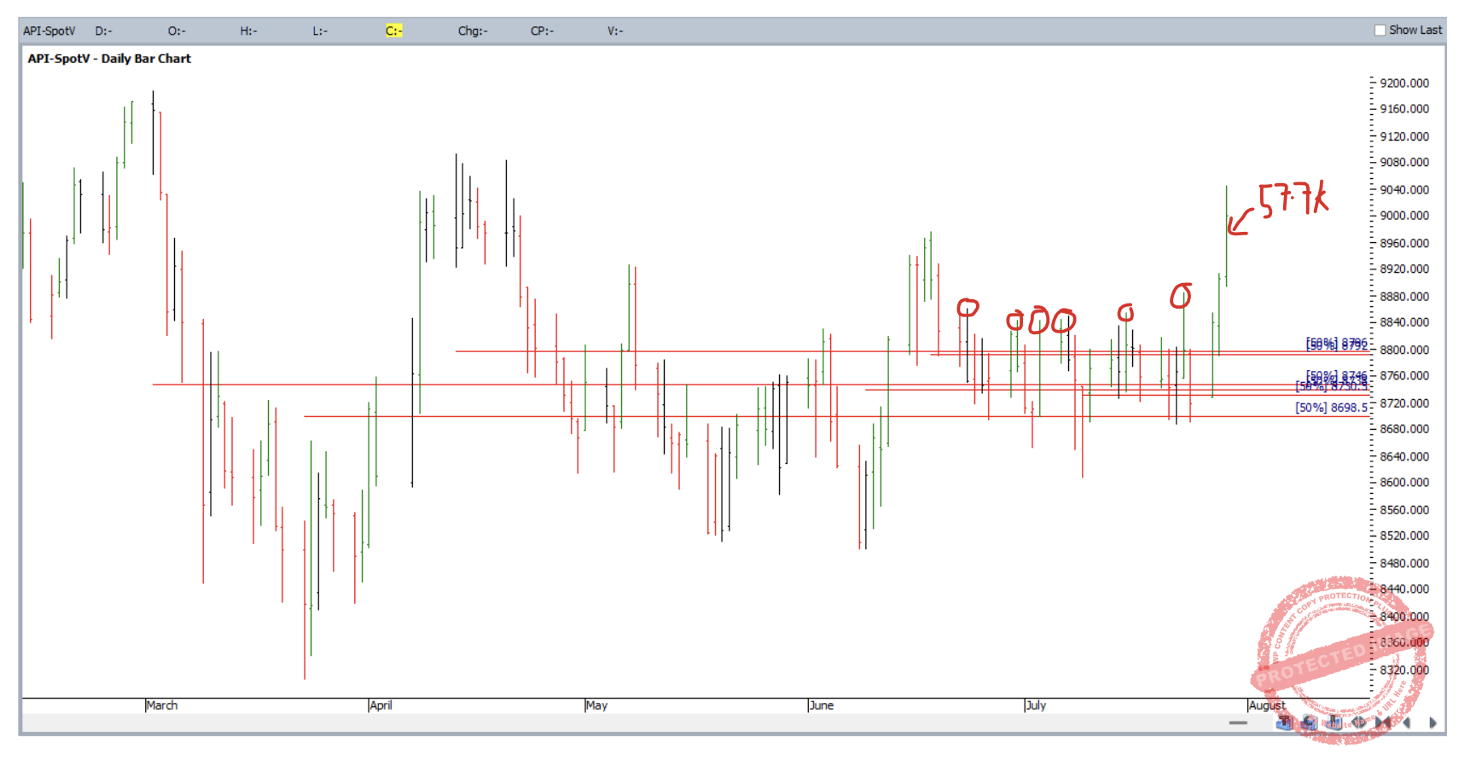
Chart 2
The current weekly swing low is 8687 which sits in the strong part of the all-time low square of 458.
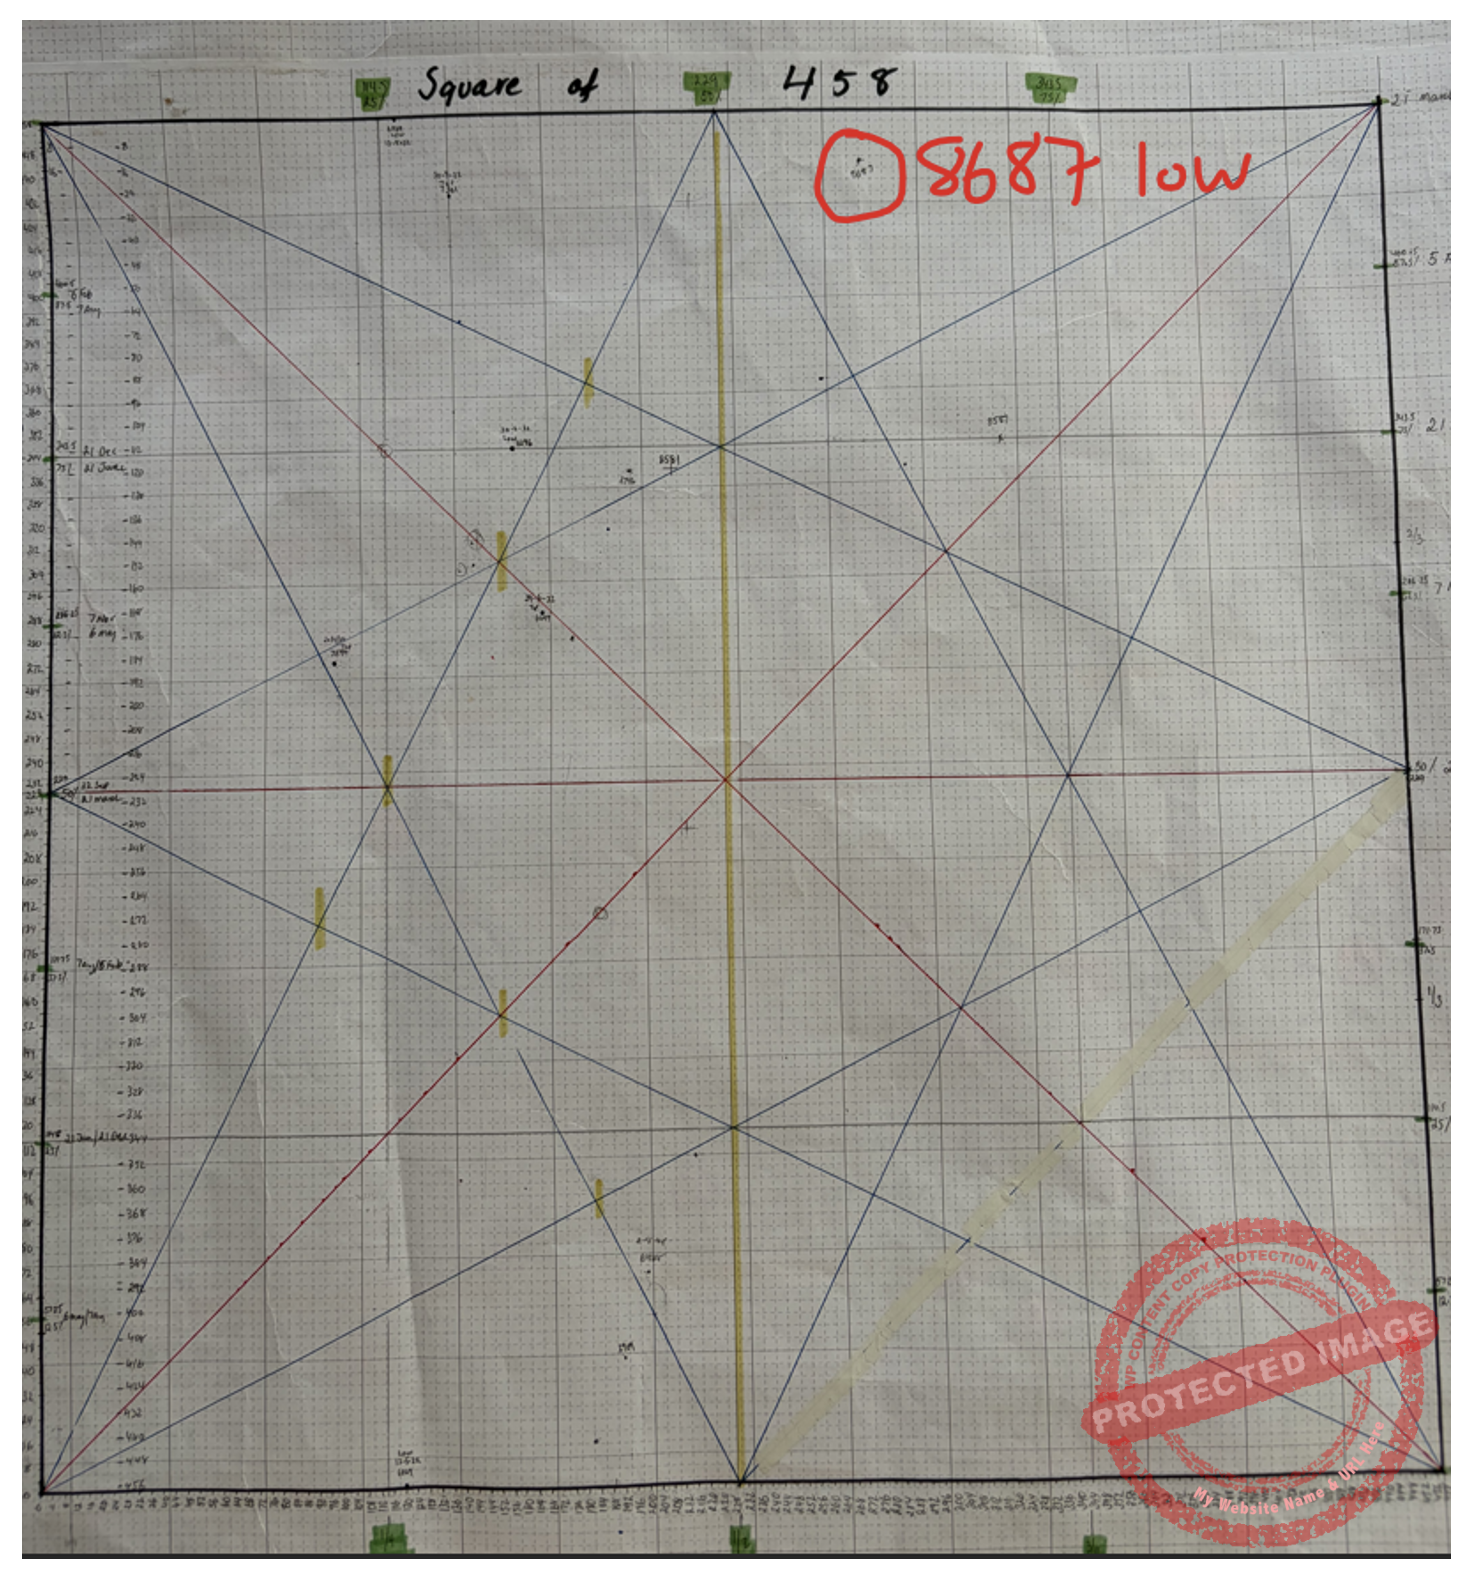
Chart 3
If you’ve ever drawn up a master calculator, you would also realise that the 8687 low is a full multiple of 458 down from the 9138 monthly high on 16 October 2025.
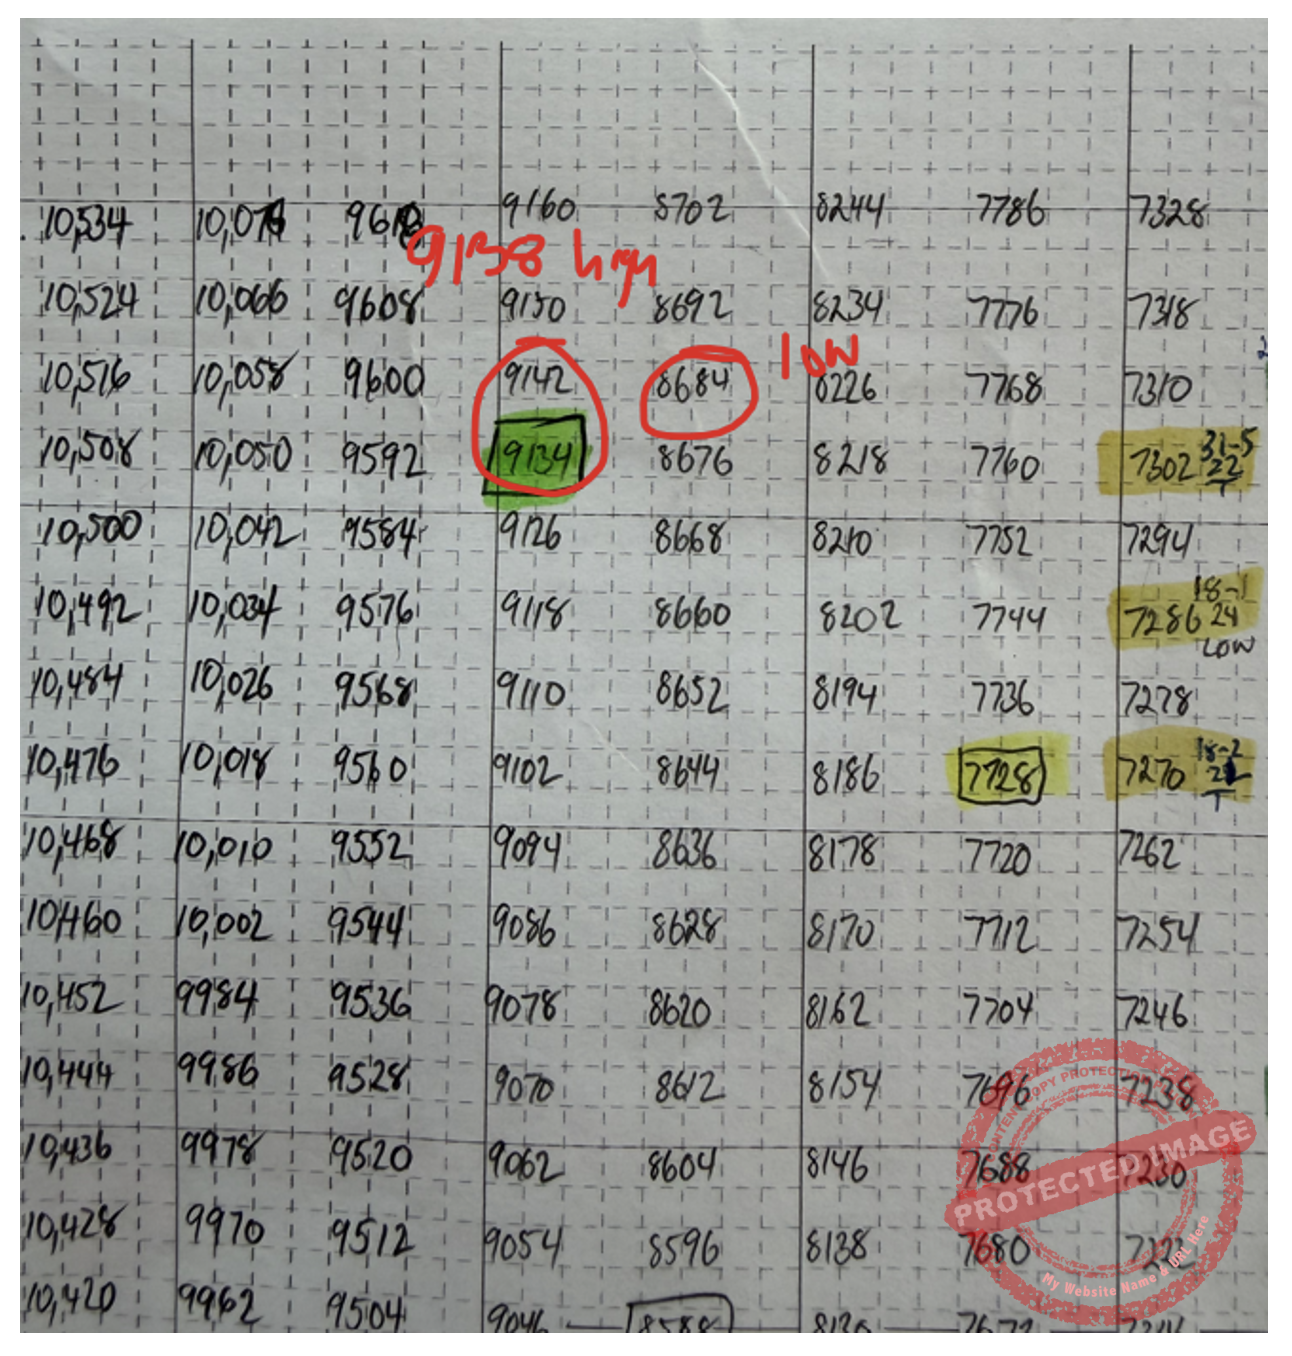
Chart 4
One thing I’ve been slowly getting a feel for is the night session volume. For this chart you will need to use the code SAPI-Spotv in ProfitSource. Keep in mind that Friday night data shows up as Monday’s bar, and Monday night data shows up as a Tuesday bar etc.
Not a lot of trading happens on the night session but there can be subtle clues as we did see increased volume on the night session.
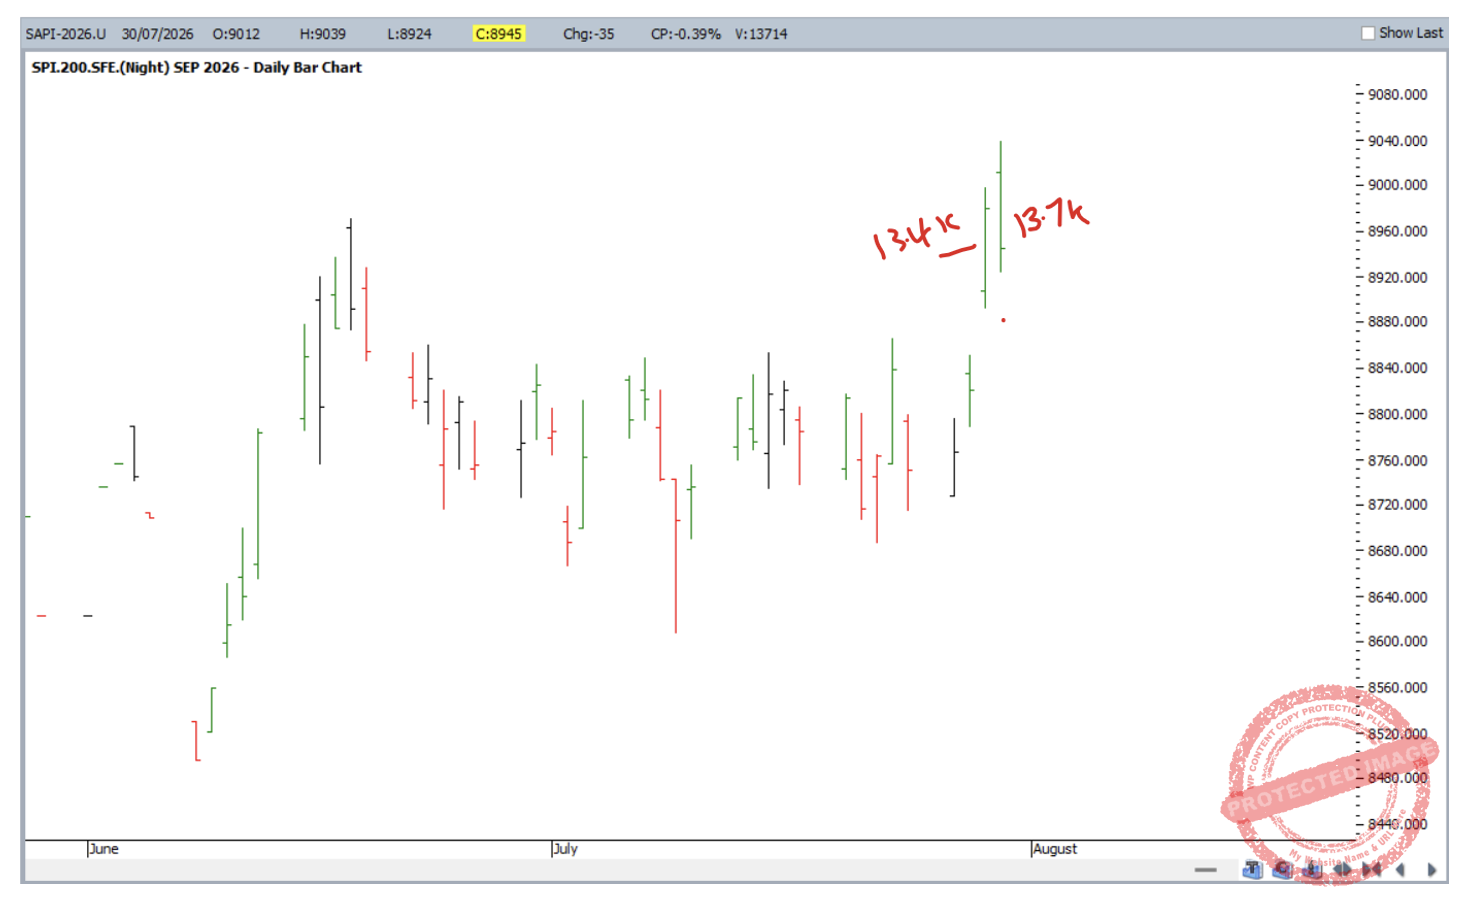
Chart 5
My overall analysis is that the SPI200 looks to be now trading in a strong position with July being a month of accumulation rather than distribution. For me, this signals long trades only until there is a significant change in market action.
Looking for my next trade opportunity, I’ve identified what I think is an obvious area for support. That is:
- 50% daily retracement = 8867
- 2×1 support from current weekly swing low
- 7 day balancing of time gives 31 July a date for a low
- Old bar chart tops acting as new support levels
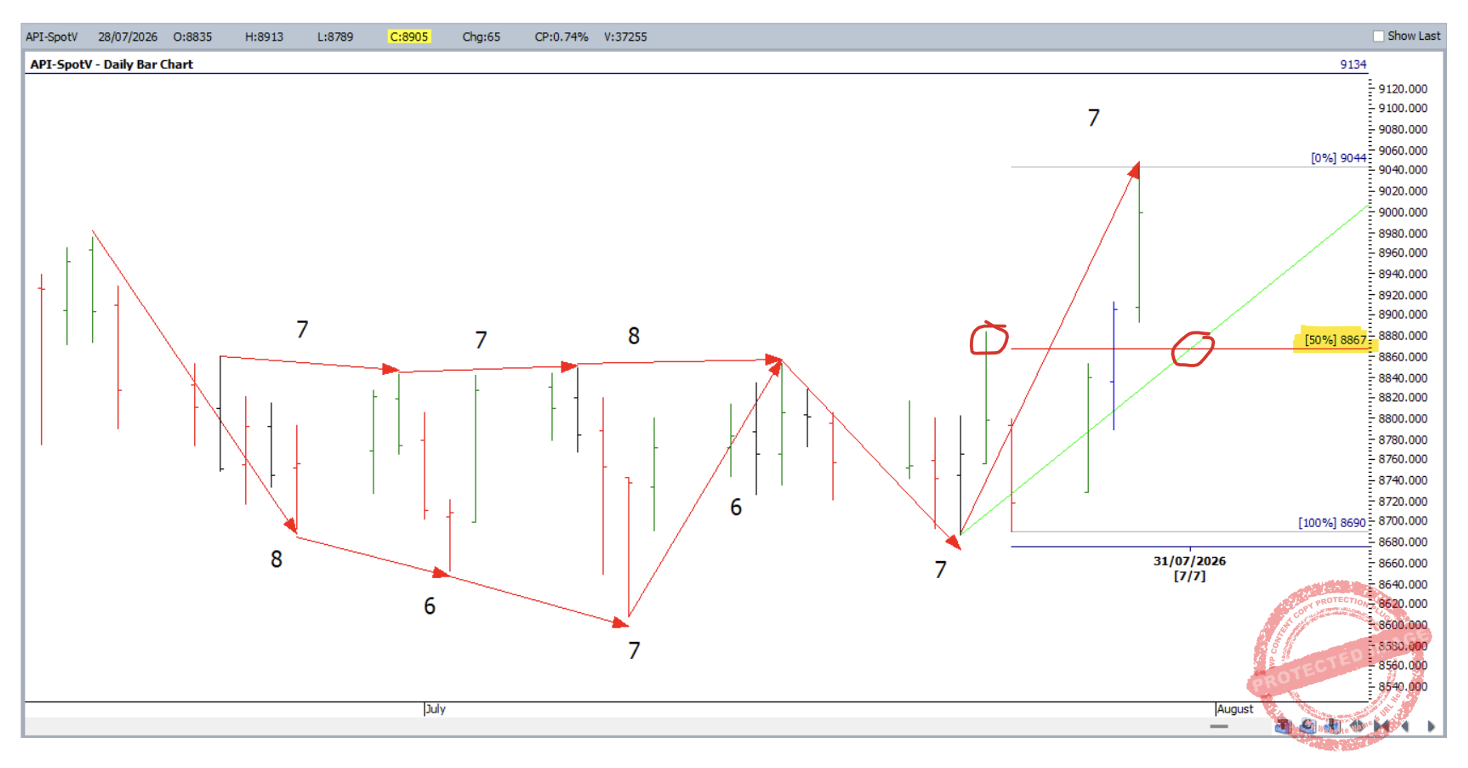
Chart 6
Looking at the 1-hour chart, the daily run up was 64 hours, so a 50% time retracement of 32 hours down into a 50% price retracement would be a nice balance.
For extra price support:
- 200% of the current hourly double tops = 8867
- 100% of the current 1-hour swing = 8866
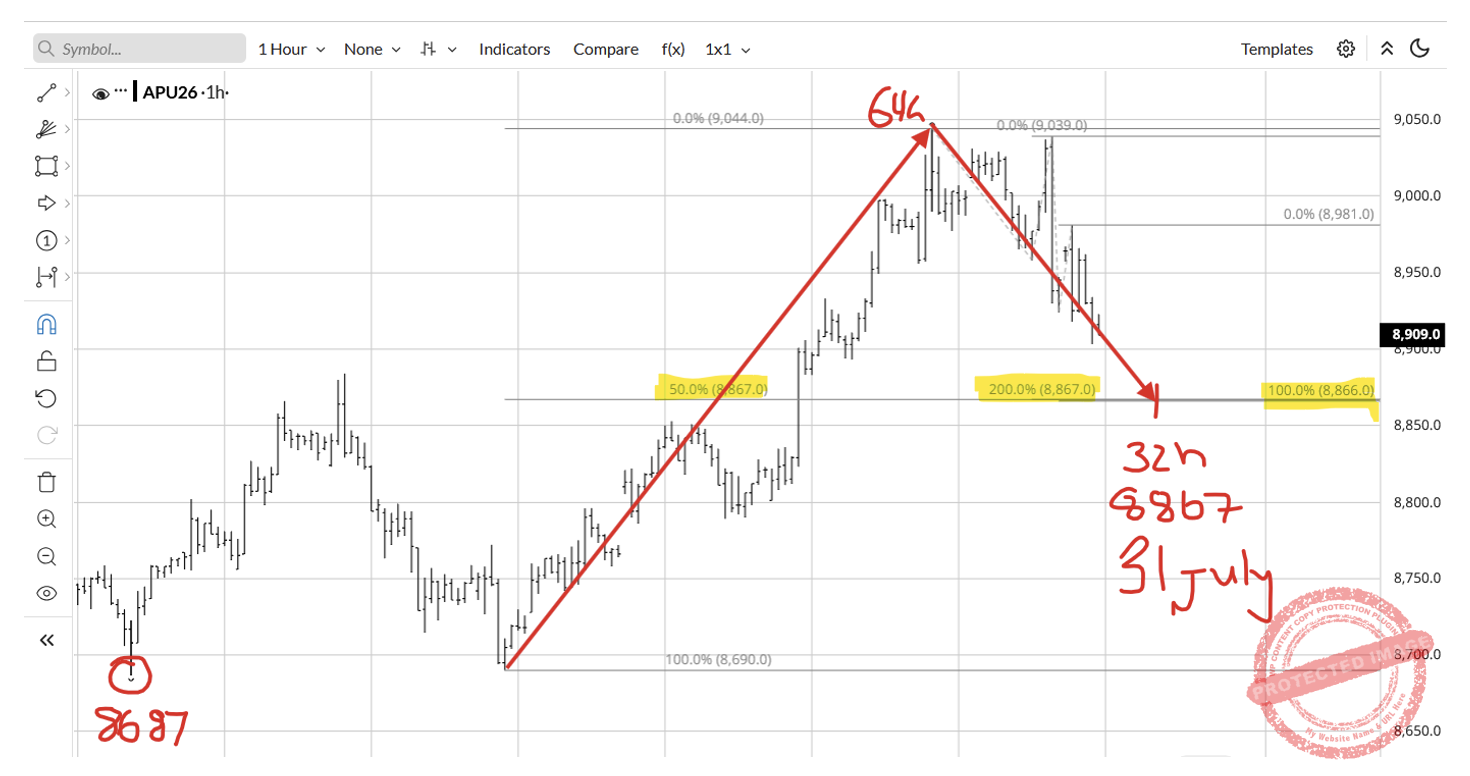
Chart 7
Also note a low at 8867 is the same numbers as the weekly swing low of 8687, just in a different order!
To back up time, a 90-degree vibration wall chart highlights Friday 31st July to Monday 3rd August as a time to watch as that is 90 and 180 degrees from the January and April turns.
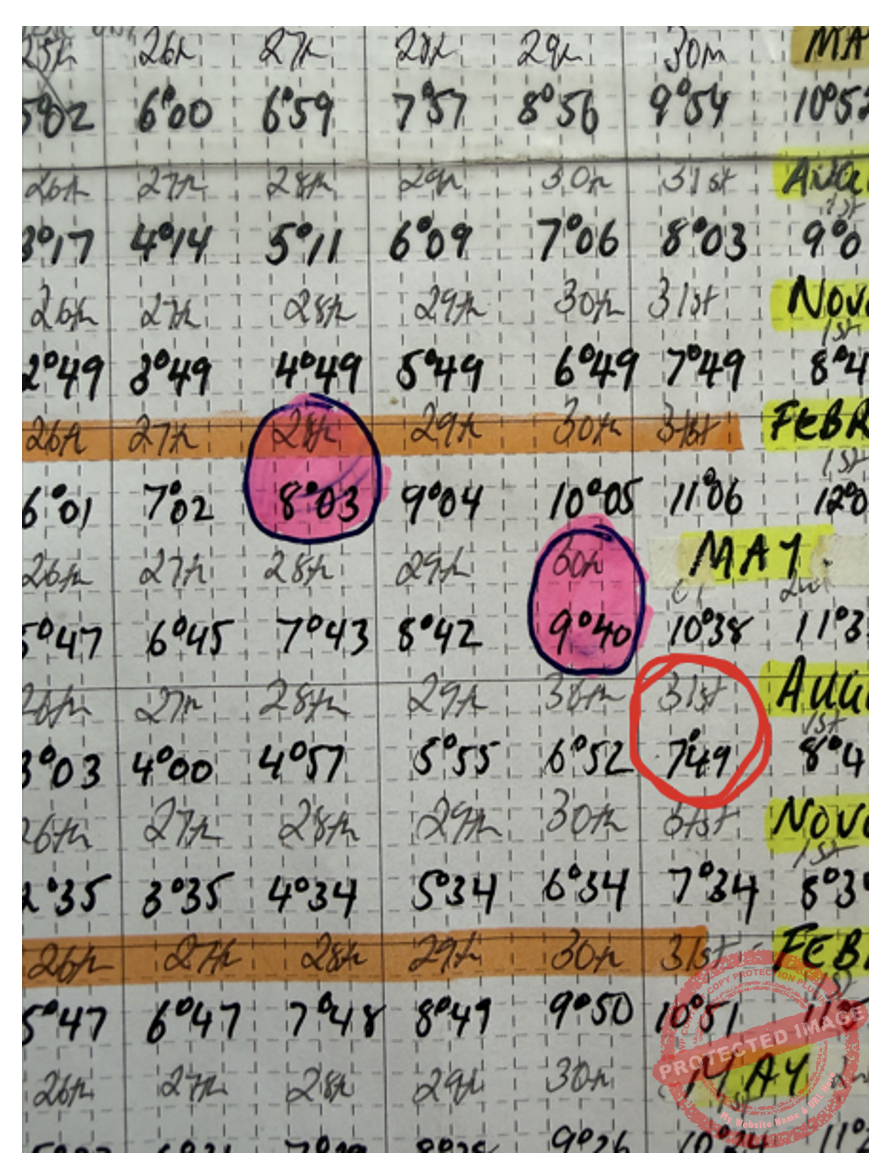
Chart 8
Of course, anything could happen from here and the market might make a higher bottom above or below the area that I’ve identified! So, all I can do now is watch as the market approaches that time and price cluster.
To finish off, there are a couple of things I can see coming up that the SPI200 has to overcome. The first thing is squaring out the GFC high of 6897 days. This gives us the 30 August as a date to watch.
With a bit of testing, you’ll see squaring out these big highs and lows doesn’t always give you exact hits; often, these times can be a couple of weeks out. However, it will be interesting to see if we get a top or a bottom around this area.
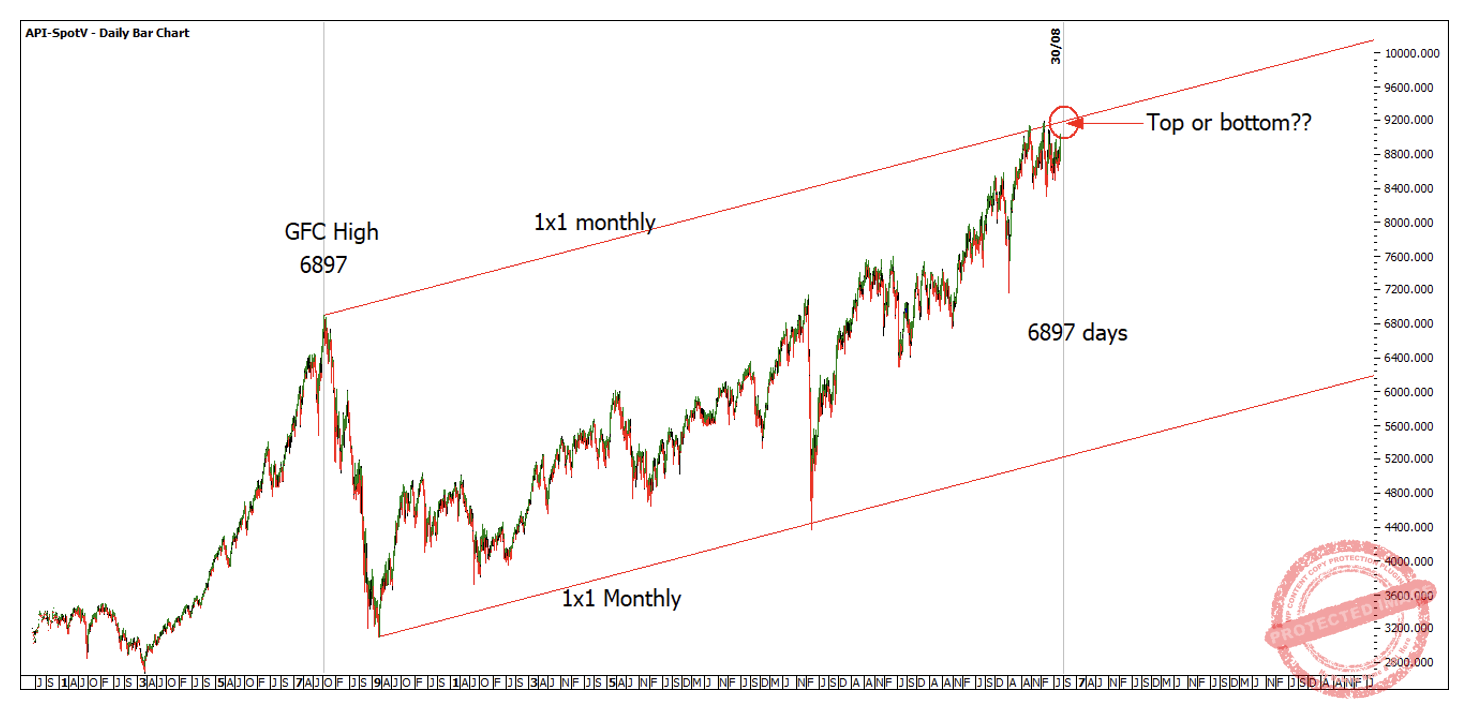
Chart 9
The next seasonal date is fast approaching, being Friday 7 August, but could easily stretch out to Monday 10 August. A 30-degree vibration wall chart will show you which date is possibly the strongest! Also, for those who like to look at cycles, the 100-year cycle on the Dow Jones (INDU in ProfitSource) might be worth a revisit to look for pressure dates.
Happy trading,
Gus