Hot Commodities
Did you find a high-quality cluster this month? Great trading opportunities are out there if you,
- Know what you’re looking for, and
- Have a solid daily routine to find them and then stay on top of them.
There was a number of high-quality trading opportunities across a few Commodities markets over the past month, but for this article I’ll focus on a recent setup on Cotton, as this setup had four, end of day, 200% milestones that made up this cluster!
Firstly, we can examine the last monthly swing down and run the weekly First Range Out milestones. This gives us the first part of the cluster at $71.30, see Chart 1 below.
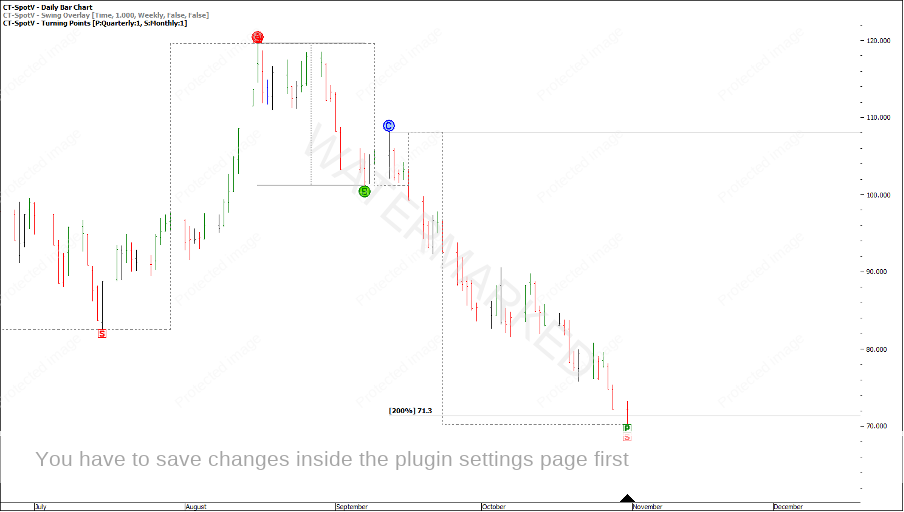
Chart 1 – Weekly First Range Out
Still, one milestone is not enough to call a cluster. Another potential range we could run our milestones could be from the 5 October 2-day swing top to the 7 October low. This gives a 200% target of $71.84.
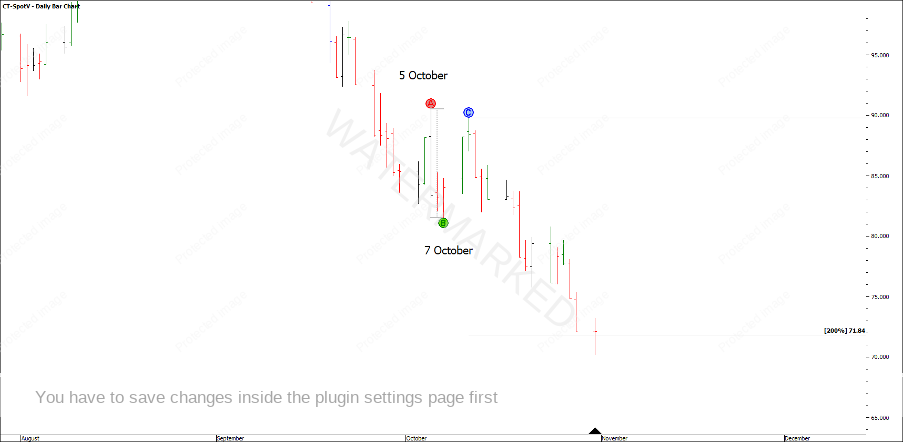
Chart 2 – Potential First Range Out
Looking at the next smaller range out from the 11 October high to the 13 October low, 200% of this range is $70.30.
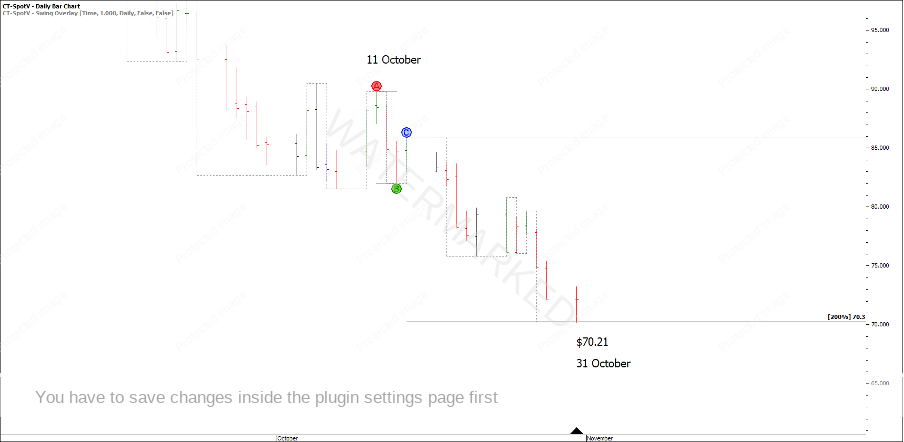
Chart 3 – Potential First Range Out
This might be a little bit subjective at this stage, but one other reason I like to use this above range to run the milestones is, the second swing down you see a very nice 100% repeat at $70.74.
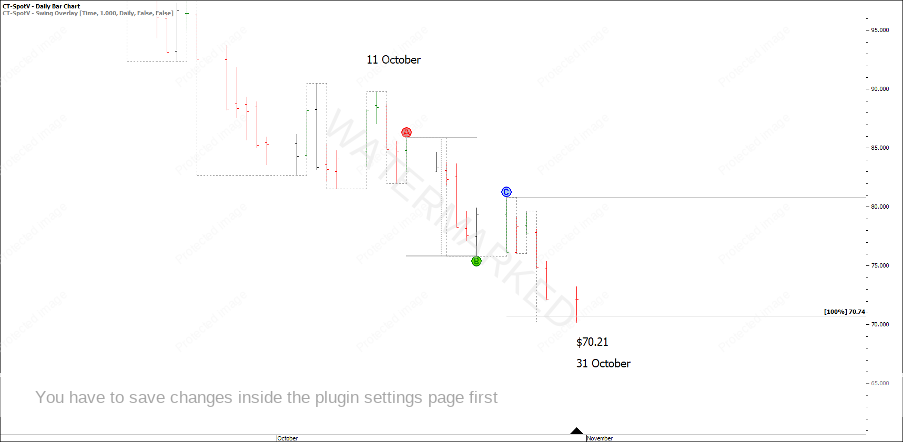
Chart 4 – Daily Swing 100% Repeat
Then to just to top it off, the last daily swing into the low had a 200% target of $70.14.
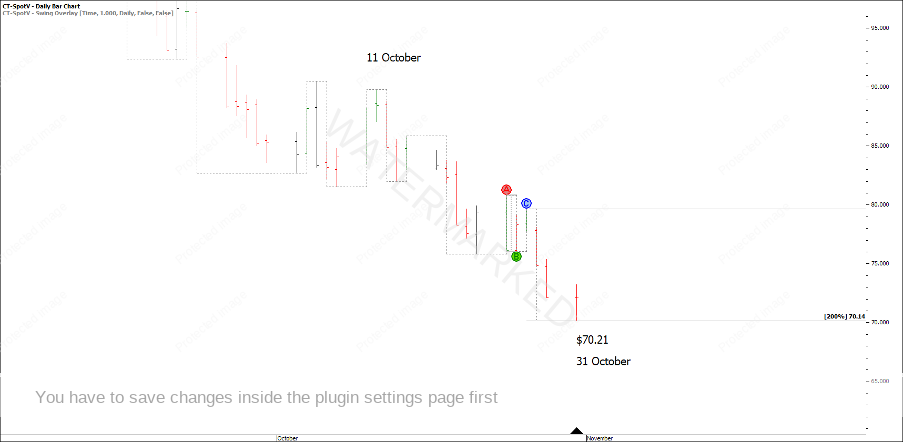
Chart 5 – 200% Last Daily Swing
So, to recap the cluster there was
- 200% weekly First Range Out = $71.30
- 200% of a potential First Range Out = $71.84
- 200% of a daily swing = $70.30
- 100% of a second daily swing range = $70.40
- 200% of the last daily swing range down = $70.14
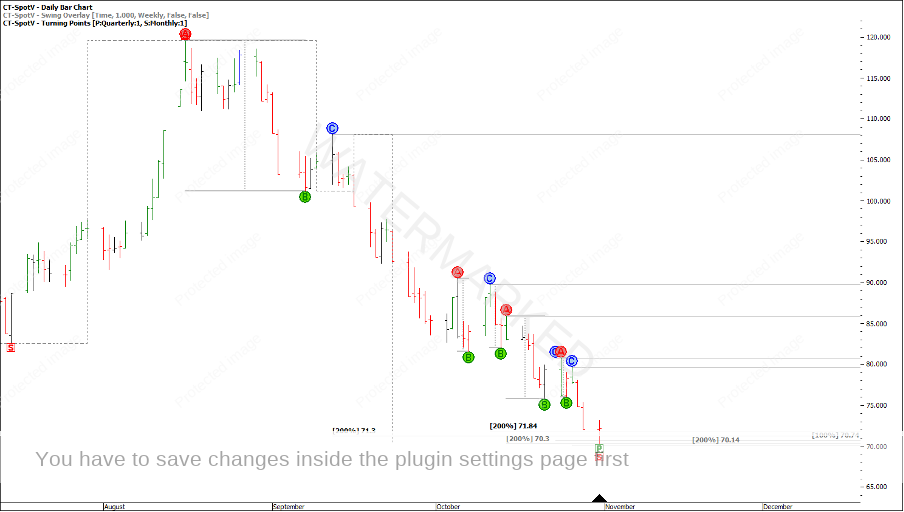
Chart 6 – Cluster Overview
From the highest part of the cluster to the lowest part of the cluster gives a price window of $1.70 which is a little over 2% apart. This is too far apart for my liking when trying to enter on smaller intraday swing charts.
One way to tighten up on this price cluster would be to look at the last daily swing down for its own smaller ranges. I will leave it up to you to have a look, but I can give you a solid clue! Looking at the December contract on barchart.com, the last daily swing down had its own, 1 hour First Range Out of $2.31. A certain multiple (that David talks about in the Number One Trading Plan, 256-point lesson) of this First Range Out equals $70.40.
And just to top it off, 200% of the last 1-hour small double tops, also added to the cluster at $70.49!
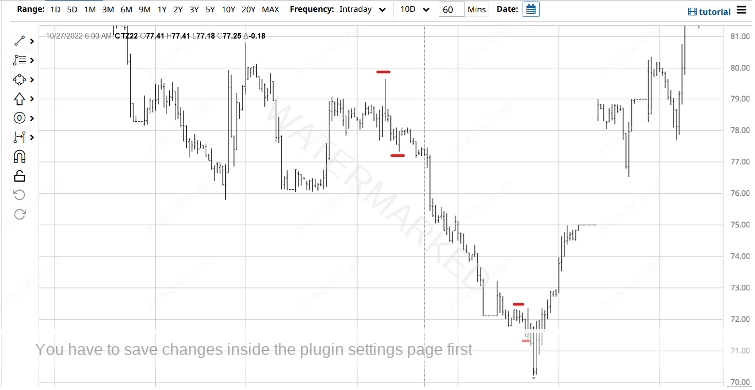
Chart 7 – Intraday Bar Chart
Finding a setup that shows multiple signs of completion is only half the battle. The other half is identifying a point of entry and where and how to run stops and an exit target.
Looking at the 1-hour bar chart, the market ran down into the cluster, turned around and ran up in one nice clean swing. If you had taken a trade on the turn of the 1-hour swing chart with an entry at $71.78 and a stop at $70.20, the risk for the trade would have been $1.58.
Now to move into the next stage, Trade Management. How would you manage this trade, especially when you get a scenario where the market finds resistance at two, 50% levels?
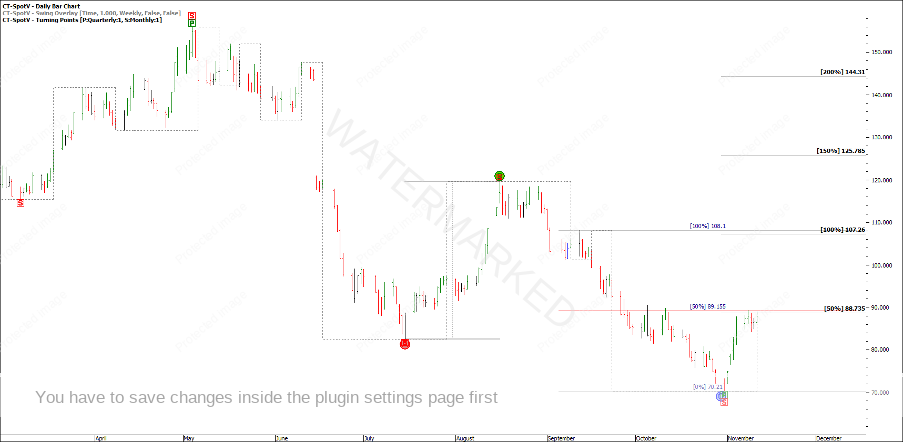
Chart 8 – 50% Resistance
Keep in mind that this trade exceeded at 10:1 Reward to Risk Ratio before finding resistance. Do you take profit, lock in profit, or move your stops to entry plus commission?
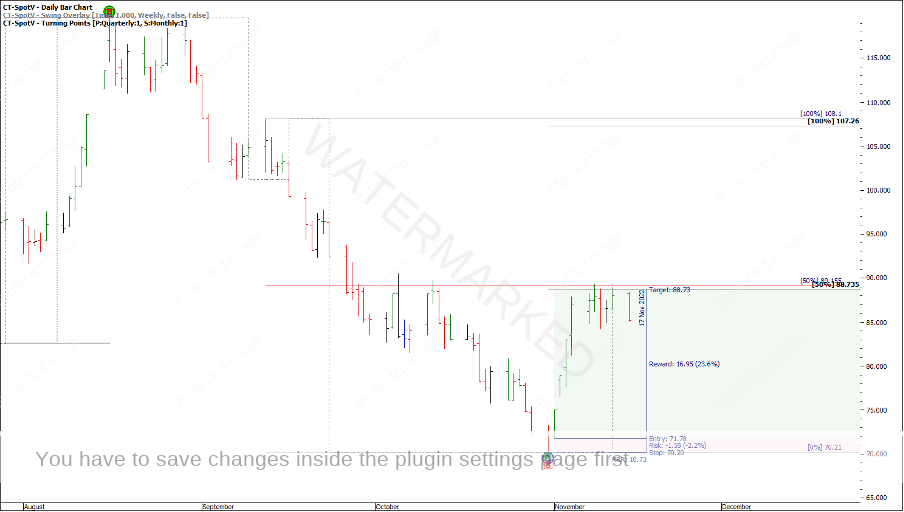
Chart 9 – Reward to Risk Ratio
Lastly, I’ll leave you with a four-way split screen of the current position of the swing charts from quarterly down to daily. This is a great way to keep an eye on the ‘whole picture’ to help you decide the longer-term trend.
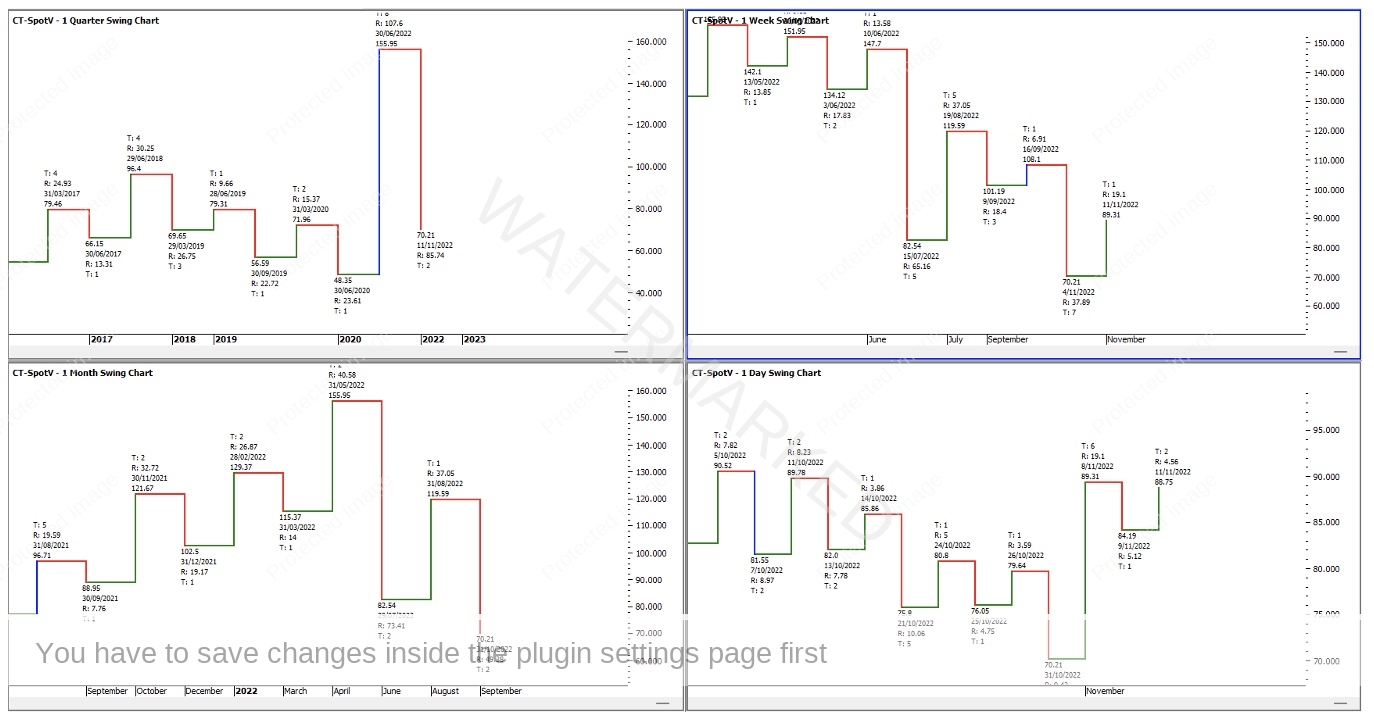
Chart 10 – Swing Charts
This will be a good case study to follow over the coming weeks and months to watch in real time how this move plays out. Stay prepared!
Happy Trading!
Gus Hingeley