A Swing Trade
This month continues with the British Pound analysis, FXBPUS in ProfitSource, to rate a daily swing trade back in March 2023. Note it’s not just daily swing chart analysis but also takes into account the bigger picture position of the weekly and monthly swing chart.
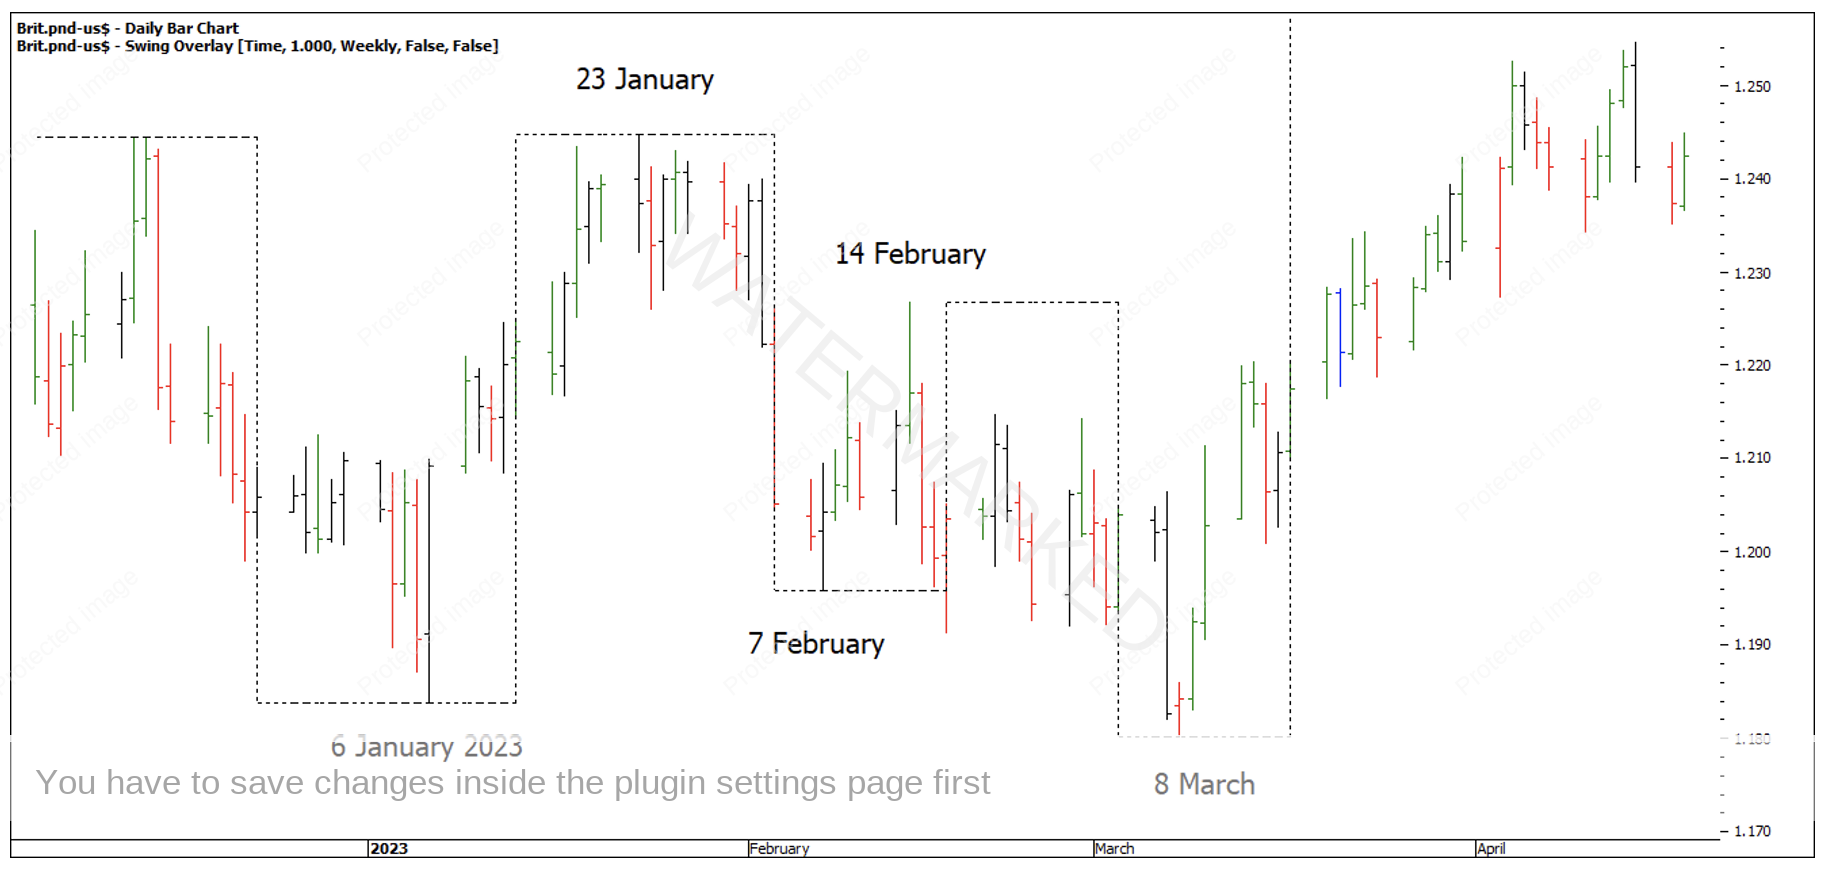
Chart 1 – British Pound Weekly Swing Overlay
A measurement of ranges is a concept taught early, with expanding ranges a sign of strength and contracting ranges a sign of weakness. As with last month’s article, I will use the ‘Advanced ABC Checklist’ (found in the Number One Trading Plan) to rate the strength of a daily ABC long trade out of the 8 March daily swing low.
In this section of the market above I see the setup as:
- A false break double bottom on a weekly swing chart
- A contracting weekly price swing range into the 8 March low
- Daily Overbalance in Price and Time out of the 8 March low.
It’s important to see where this setup sits within the bigger monthly position of the market. As it happens, the monthly swing had already overbalanced in time and price to the upside and was in a B-C move that was holding well above the 50% retracement and in a position of strength.
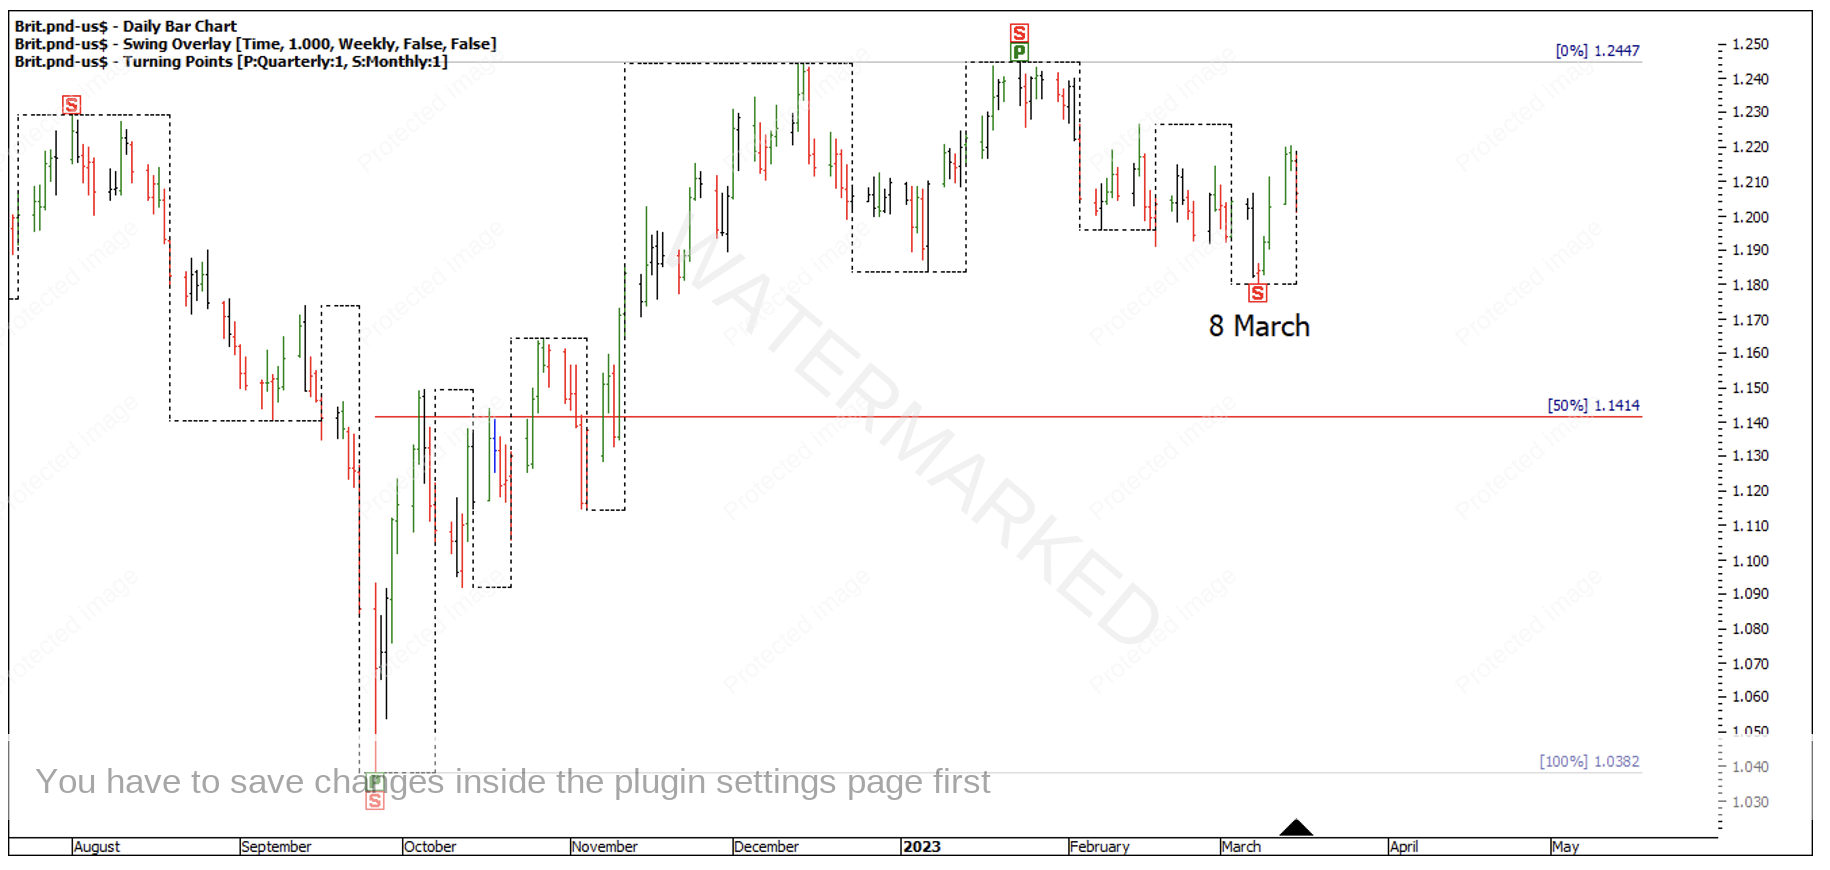
Chart 2 – Monthly Swing Overlay
Often, it’s the Overbalance in Price that gets your attention to do some further analysis! As you can see below, 401 points is an expanding price range, which gives a + 1 on the score card. This range is the biggest of the last 4 ranges.
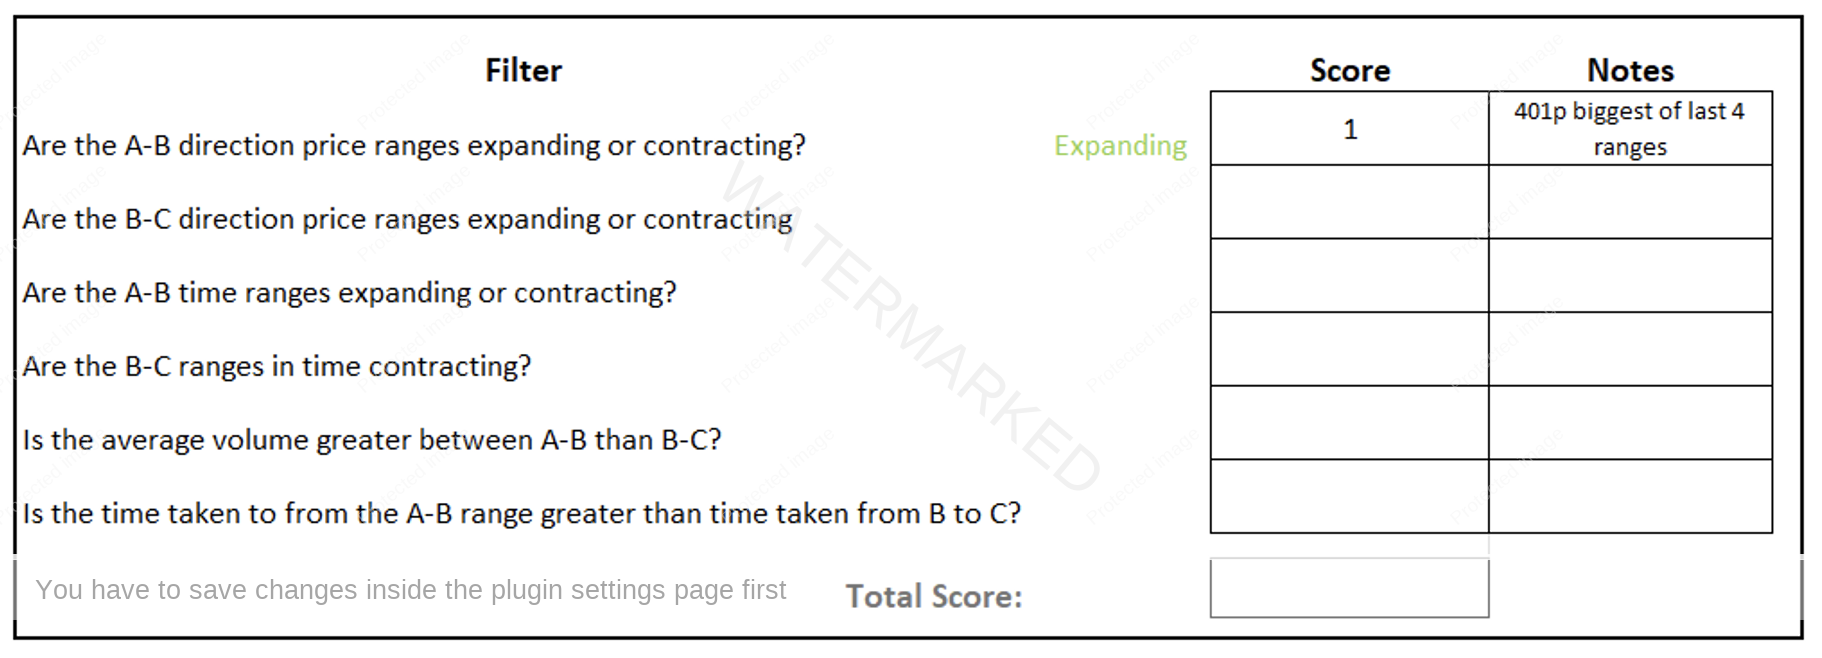
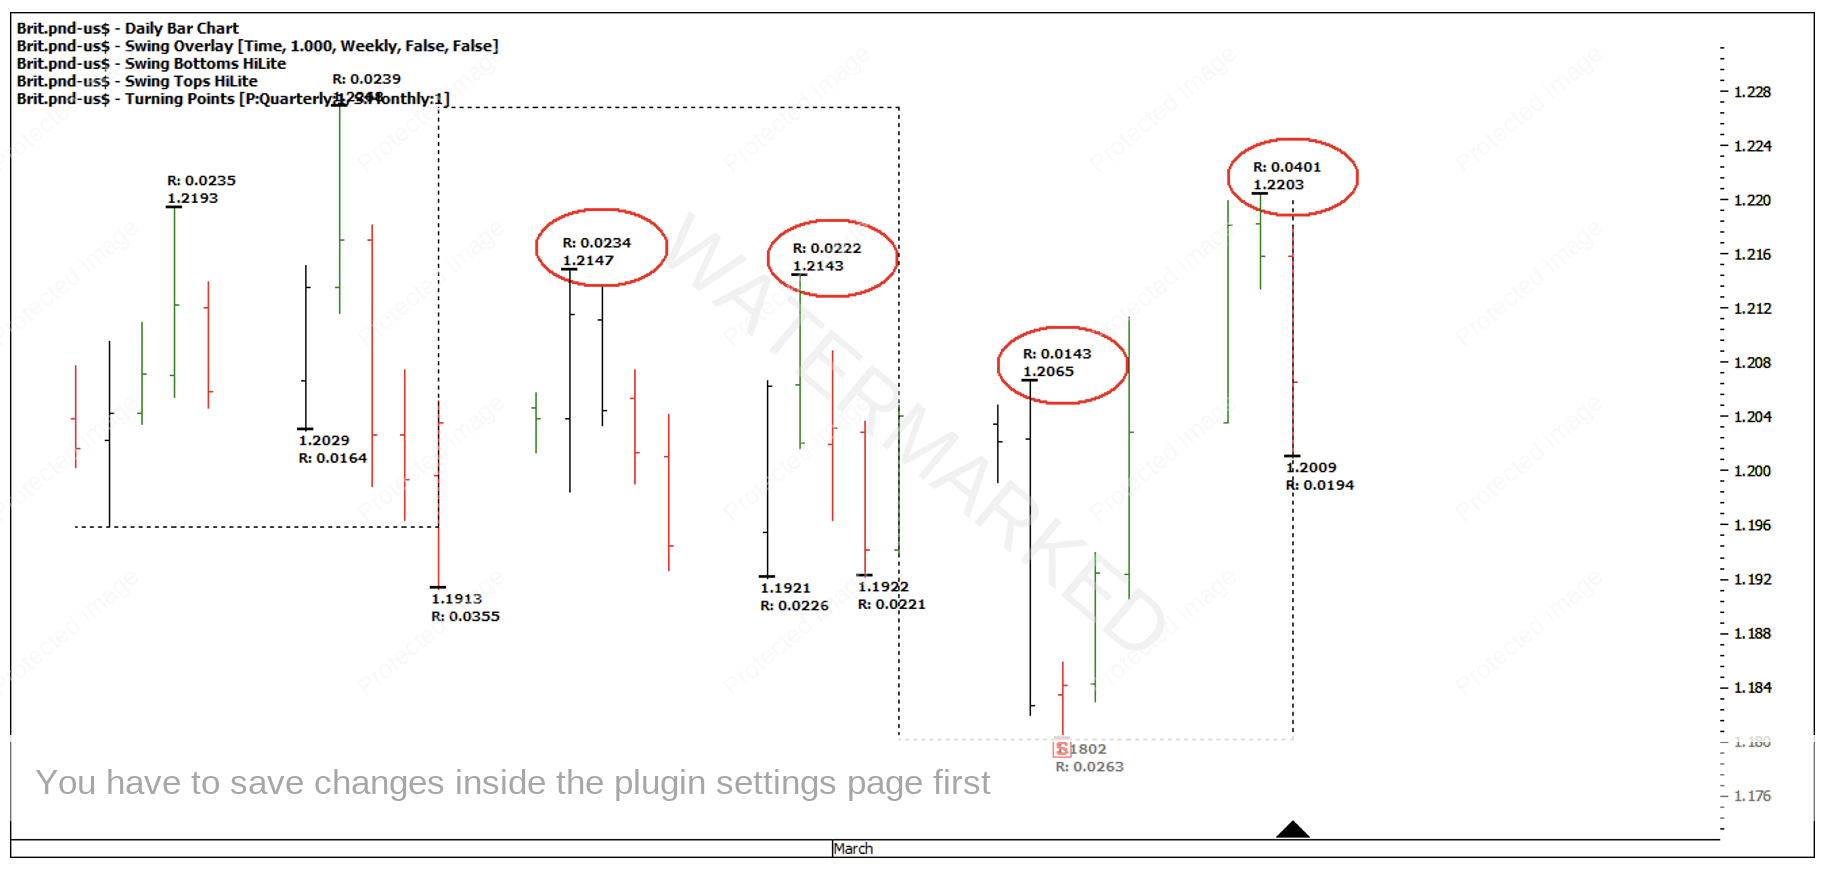
Chart 3 – Expanding Swing Range
In checklist item number 2, the B-C range is contracting which is a +1 and the smallest of the last 4 ranges in that direction.
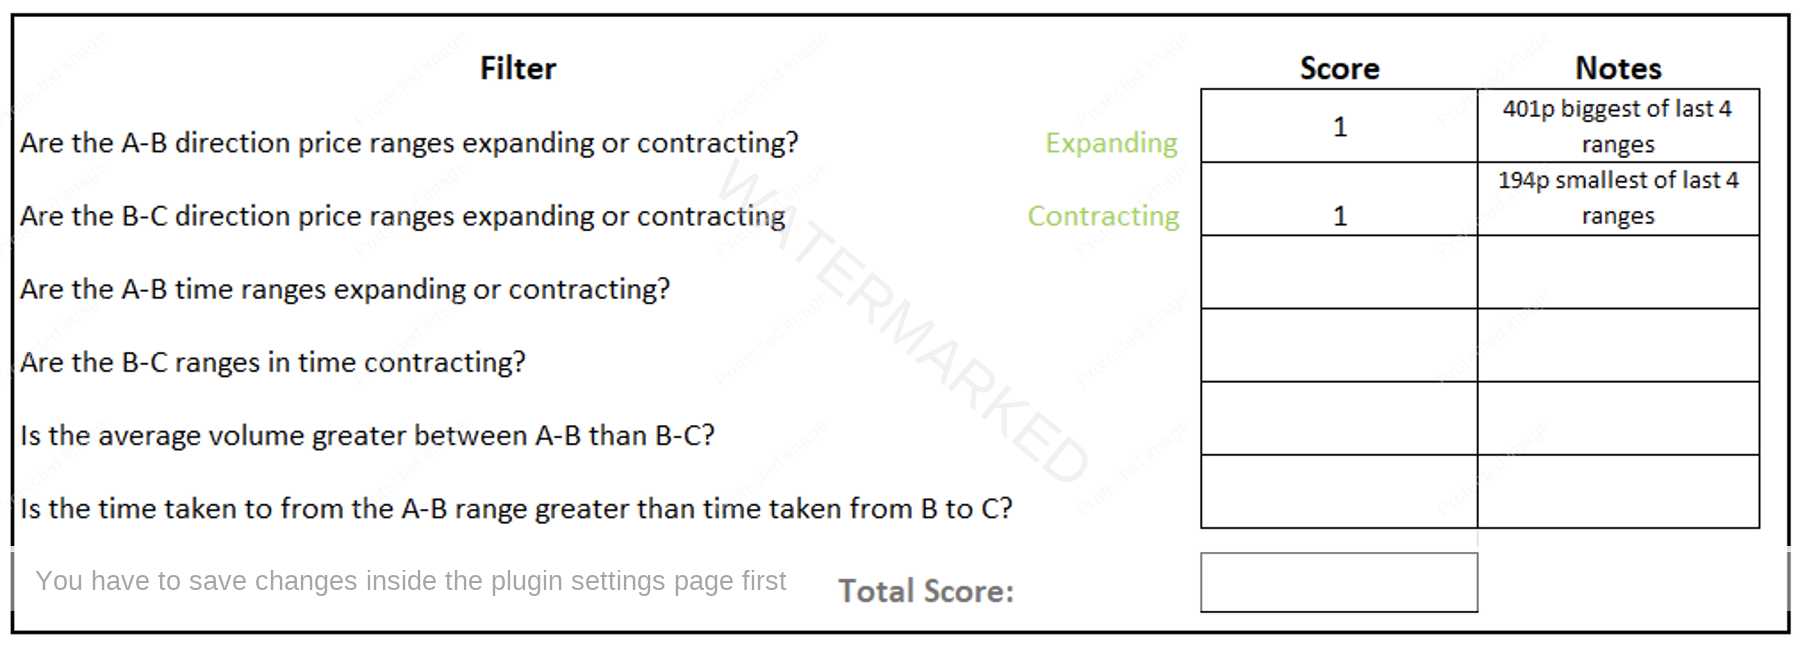
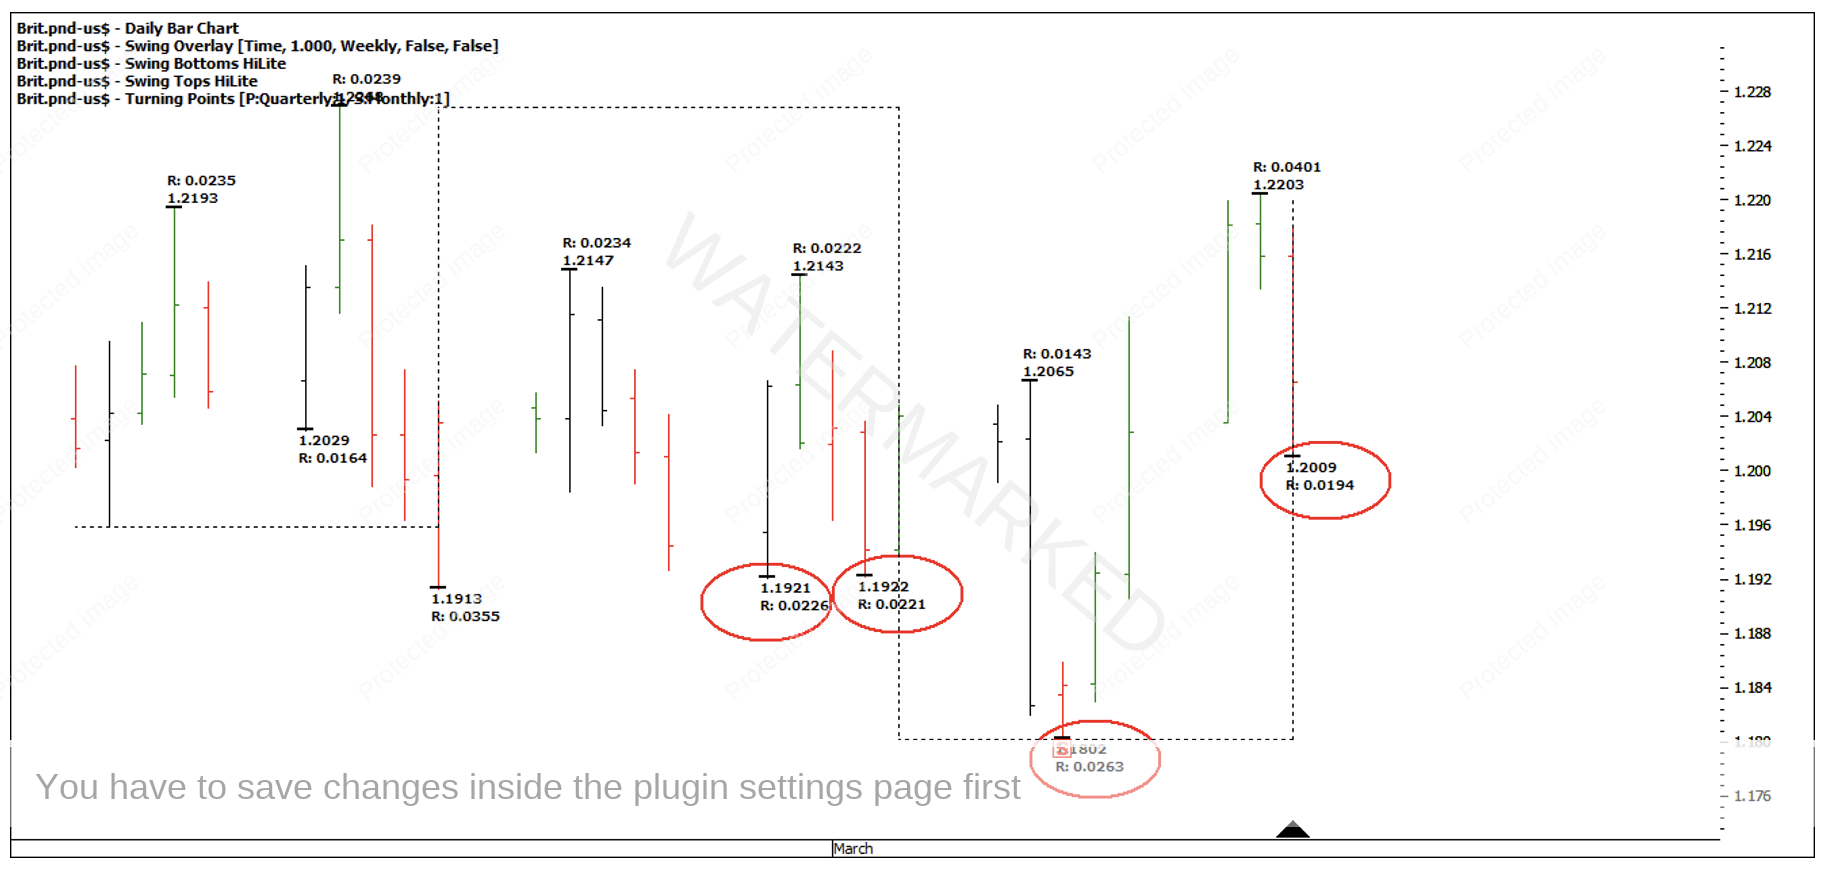
Chart 4 – Contracting Swing Range
David Bowden says what you can do with price, you can do with time. You could measure the A-B range in days but I like to look at the intraday bar chart and measure the time in hours for a more accurate reading.
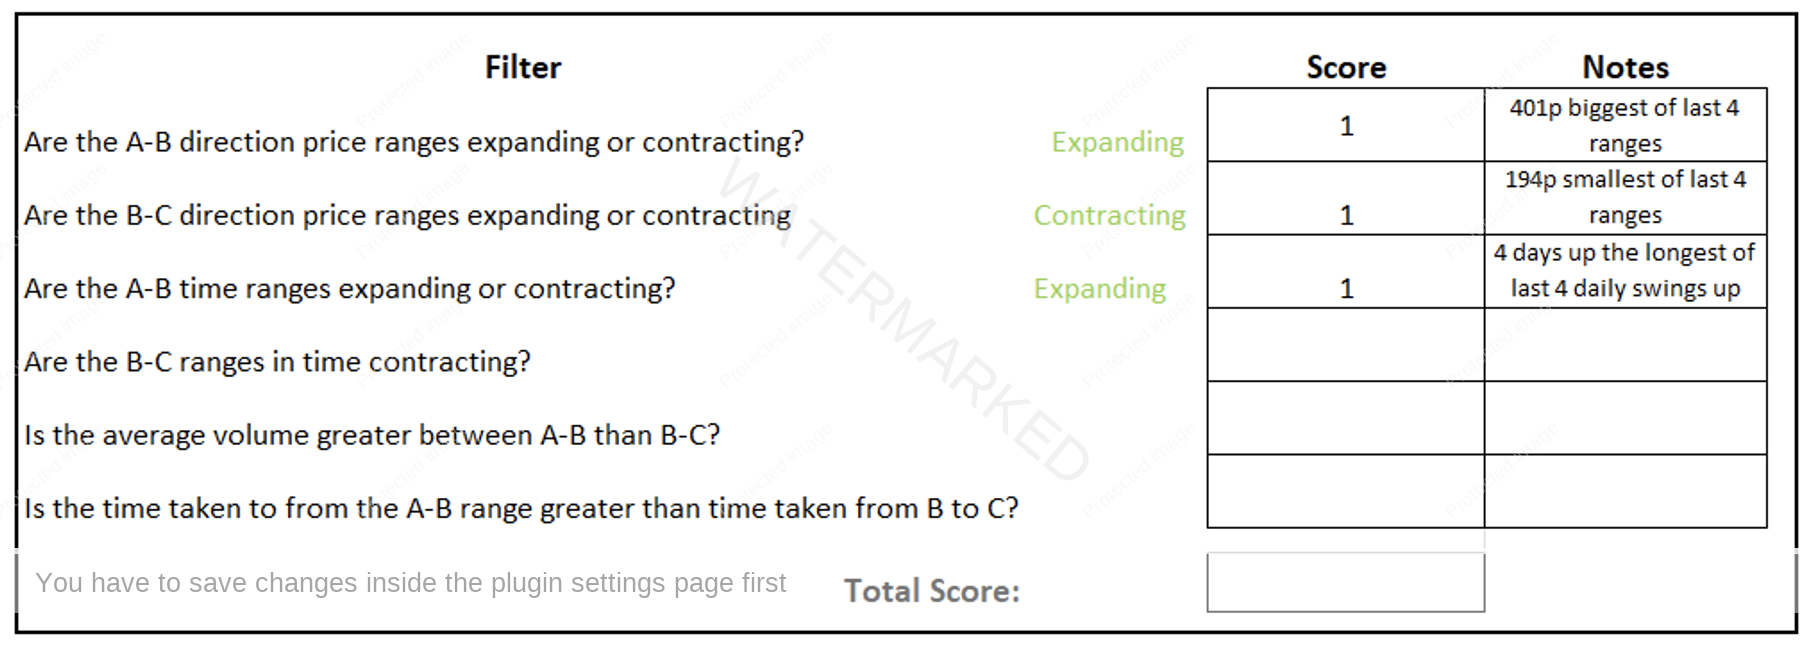
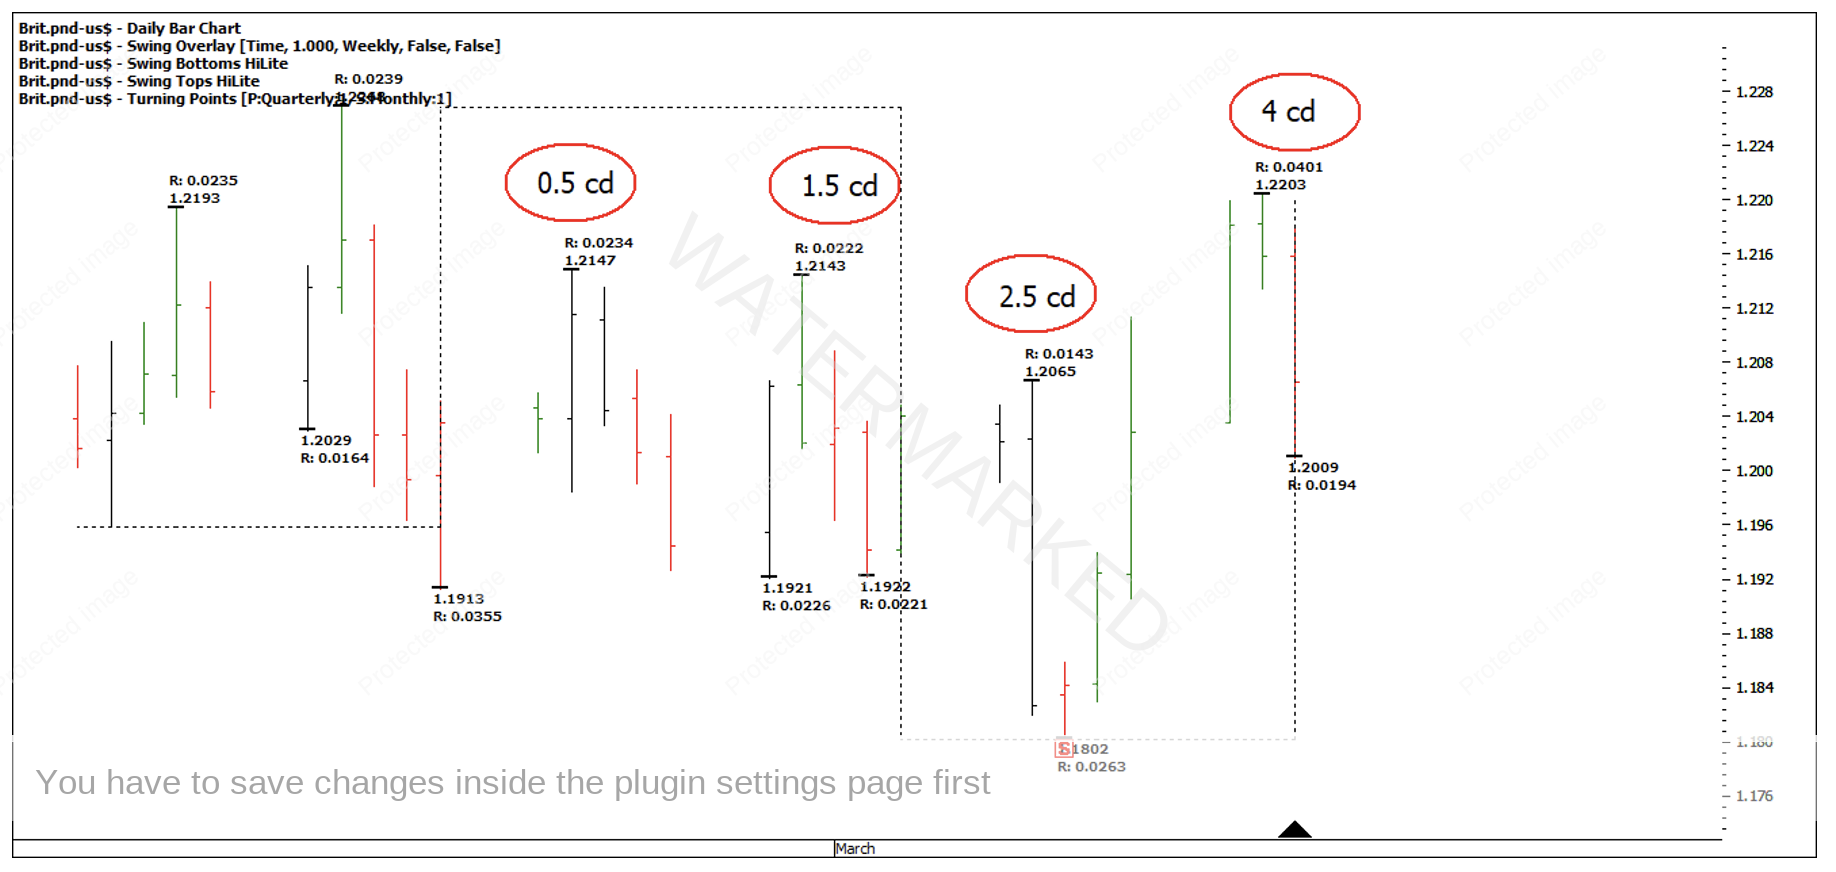
Chart 5 – Measuring Time Ranges Up
Looking at the B-C time range, the 1 day pull back is the shortest in time of the last four and again, gives a + 1 for the checklist.

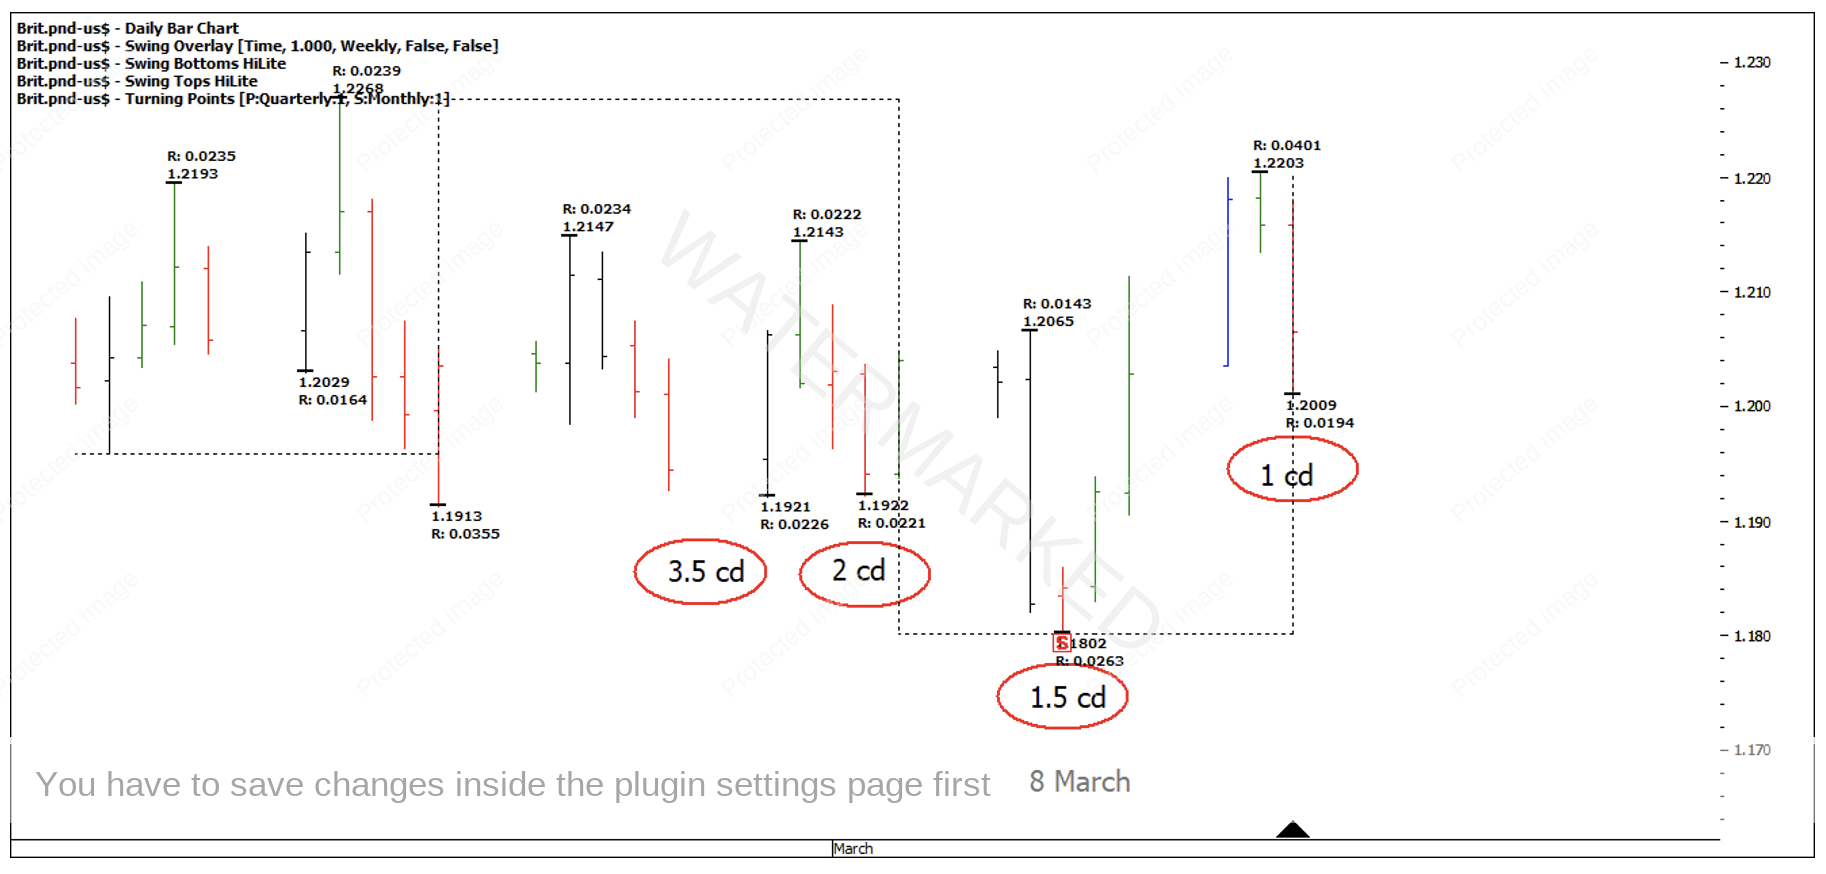
Chart 6 – Measuring Time Ranges Down
As we are looking at the British Pound forex market (FXBPUS in ProfitSource) there is no volume associated and you would need to look at the Pound futures chart for this (BP-Spotv in ProfitSource). However, mid-March is also contract roll over and you would need to be trading and analysing the forward contract. So in this instance I will leave volume as ‘N/A’ as there is always a spike in volume around these times.
The final question I can answer as a ‘Yes’ and score it with a + 1.
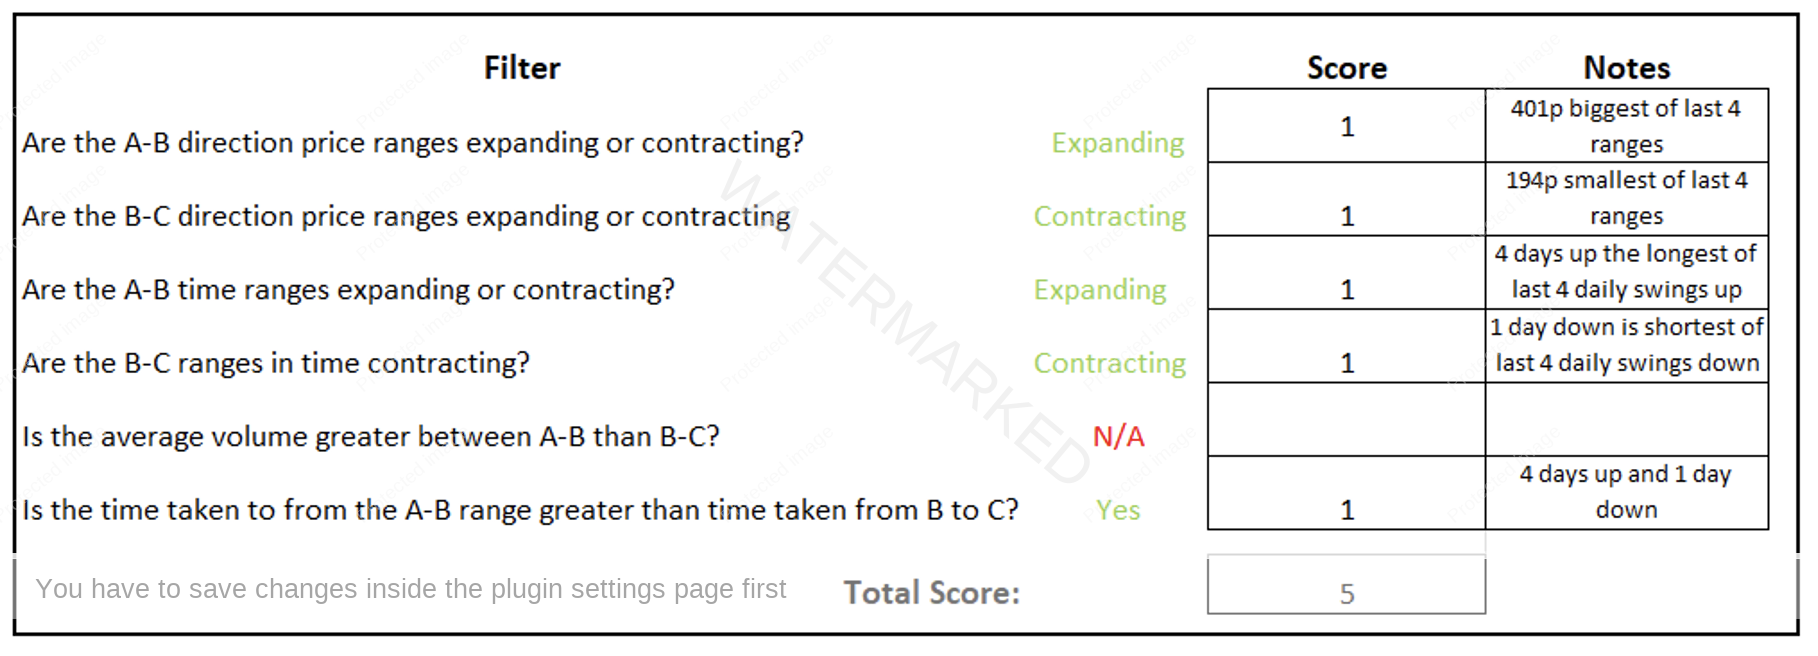
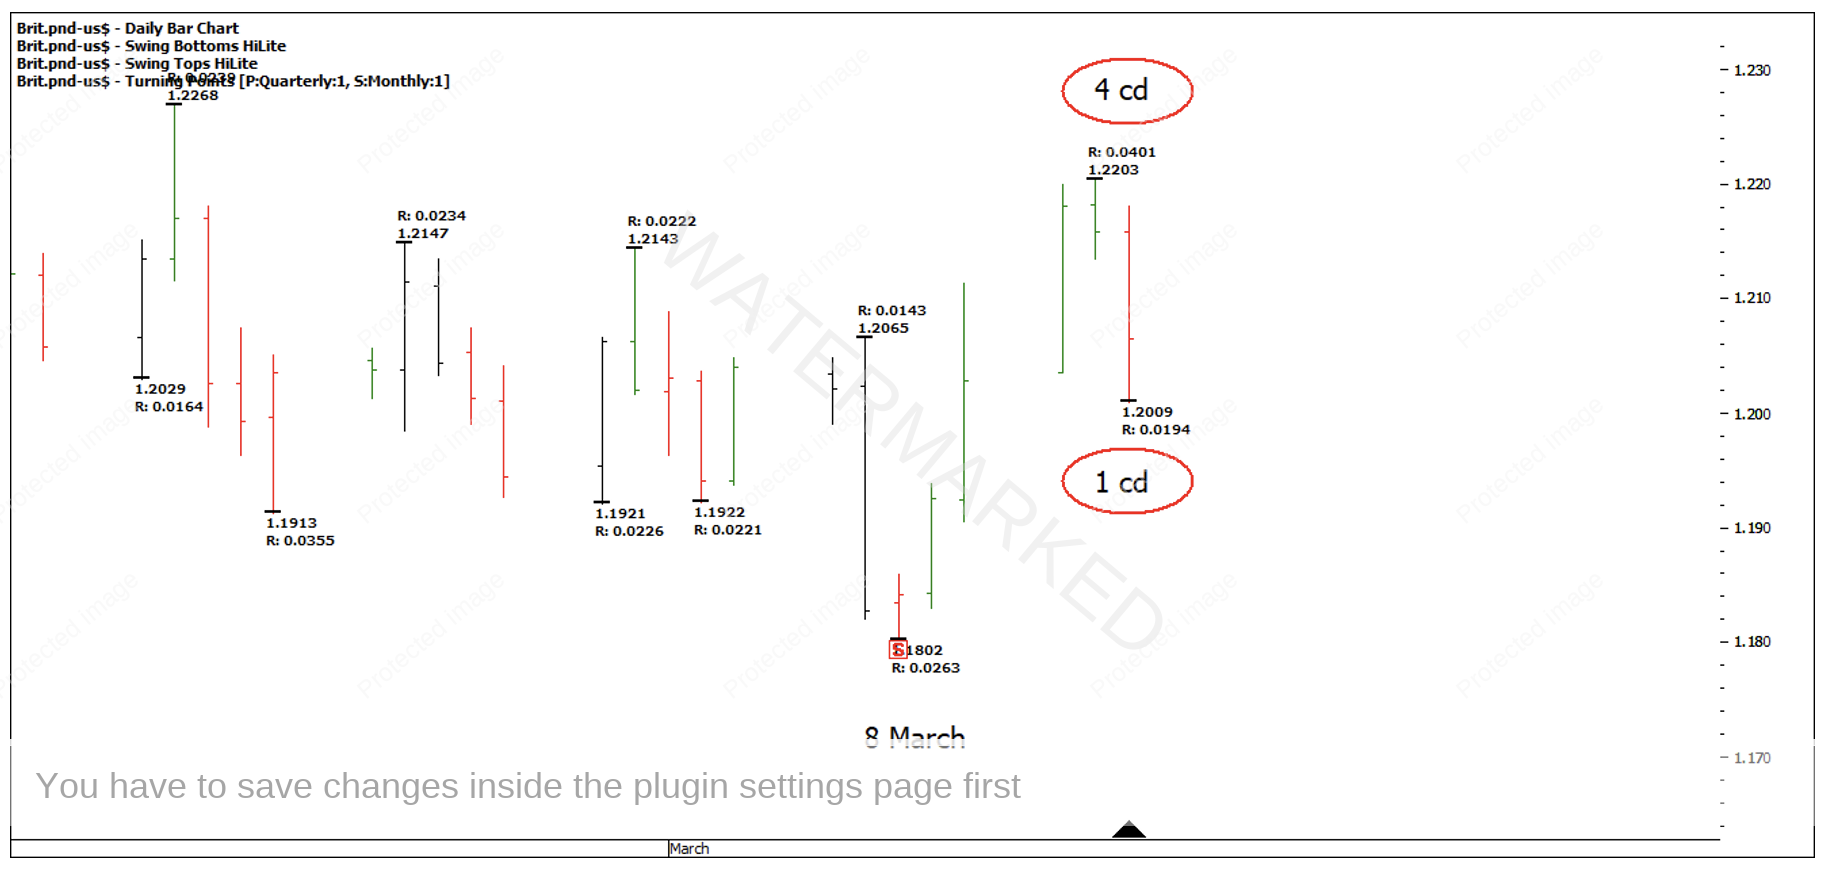
Chart 7 – Time Ranges
This gives us a high score of + 5 out of a maximum + 6 and is looking like an excellent setup. We can also mark-up ‘Estimated Point C’ and while this Point C holds above the 50% retracement, you can rate this as a sign of strength.
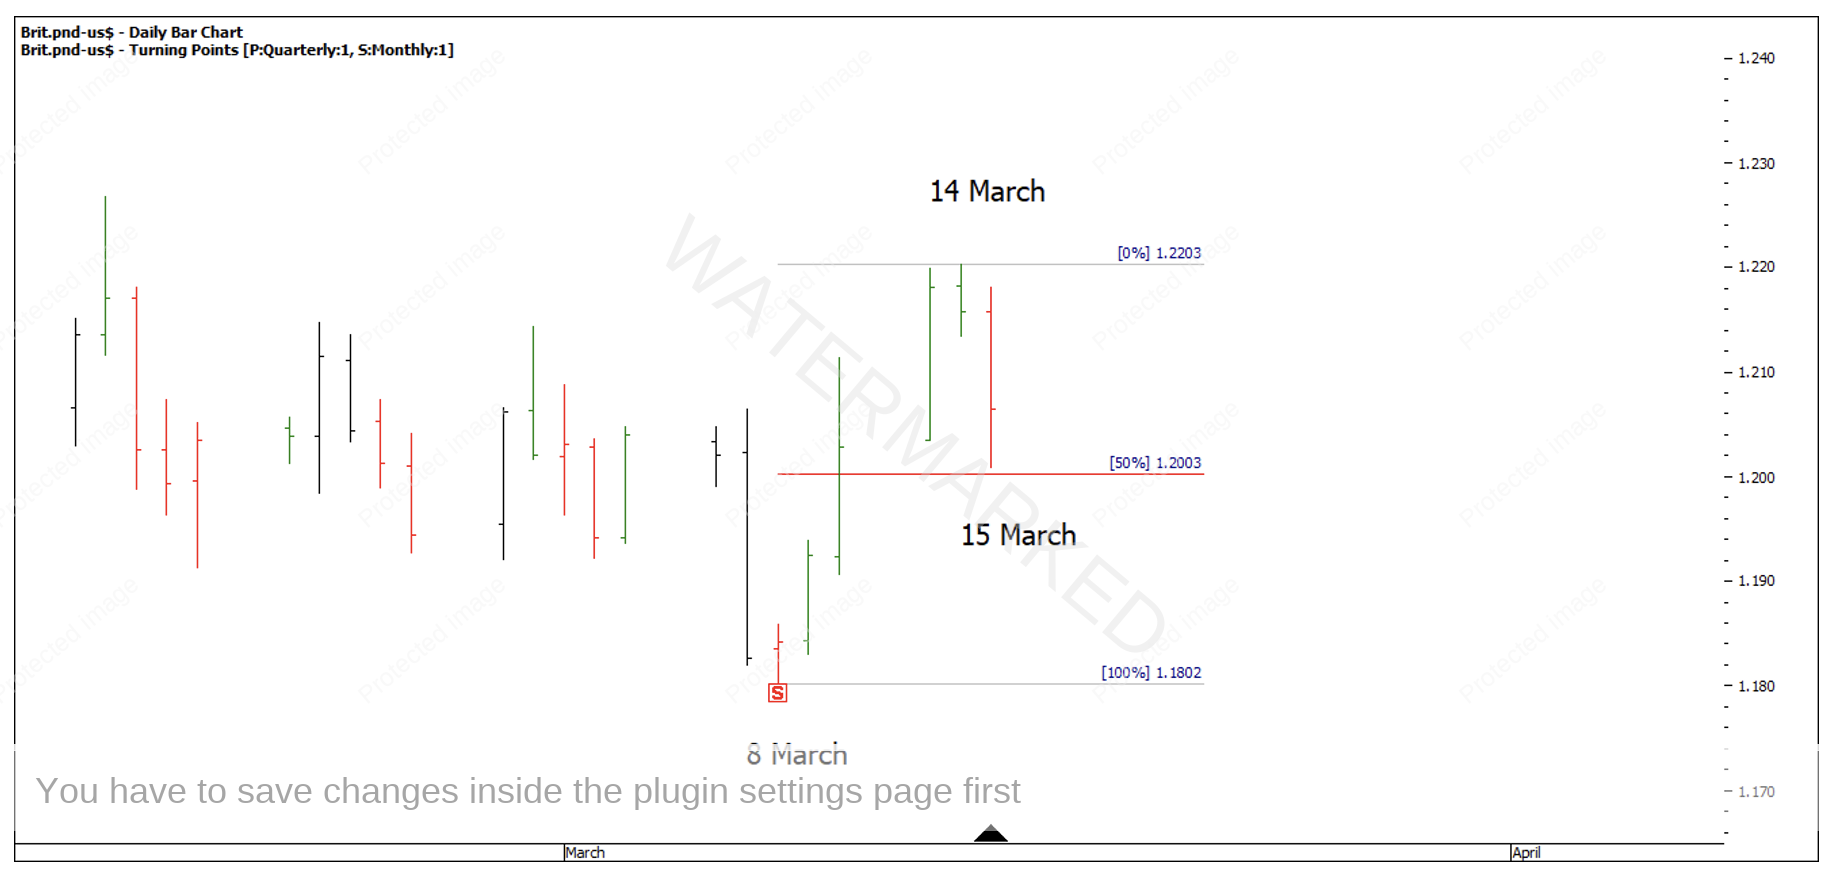
Chart 8 – Rating Strength
Looking for a smaller time frame to enter into this market to increase the Reward to Risk Ratio, we can look at this daily swing down on a four-hour bar chart and measure the swing ranges. When the four-hour higher swing bottom presented you could again apply the above Advanced ABC checklist to rate the strength of the setup.
In Chart 9 below you can see a 103-point Overbalance in Price and Time followed by a contracting B-C range of 86 points. Half of 171 points is 85.5, therefore the 4-hour first higher bottom found support on the 50% milestone of the previous swing down after an Overbalance in Time and Price.
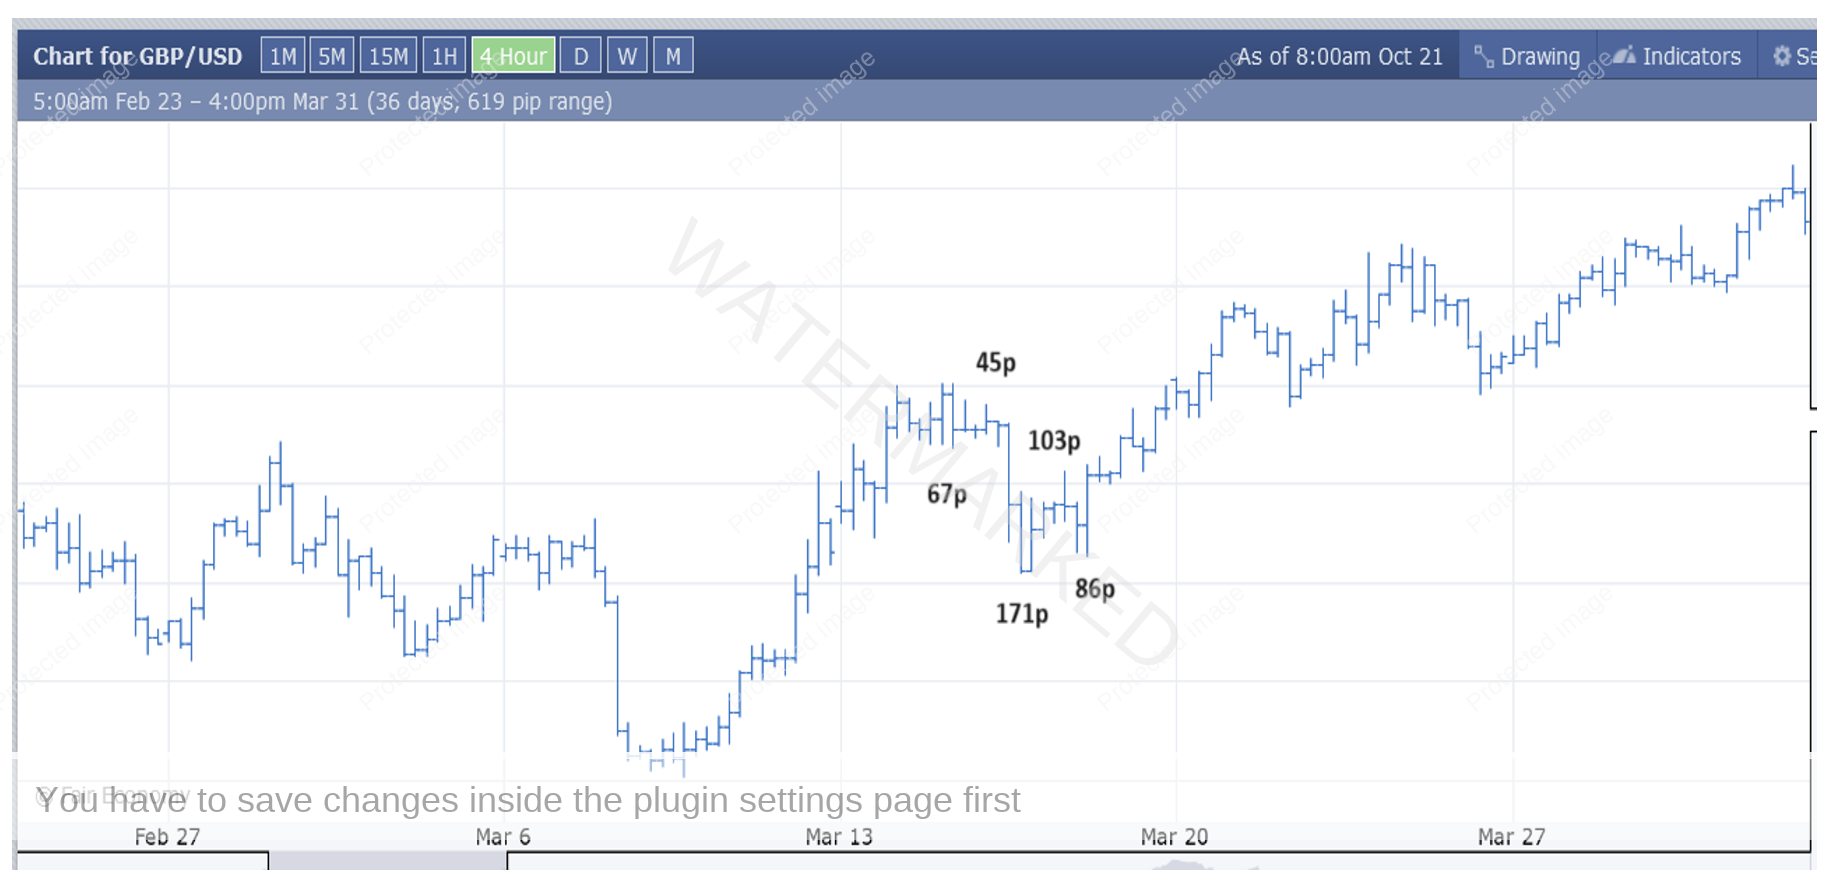
Chart 9 – 4 Hour Swing Ranges
With an entry as the outside bar was confirmed at 1.2084 and a stop loss at 1.2026, this gives a risk of 58 points.
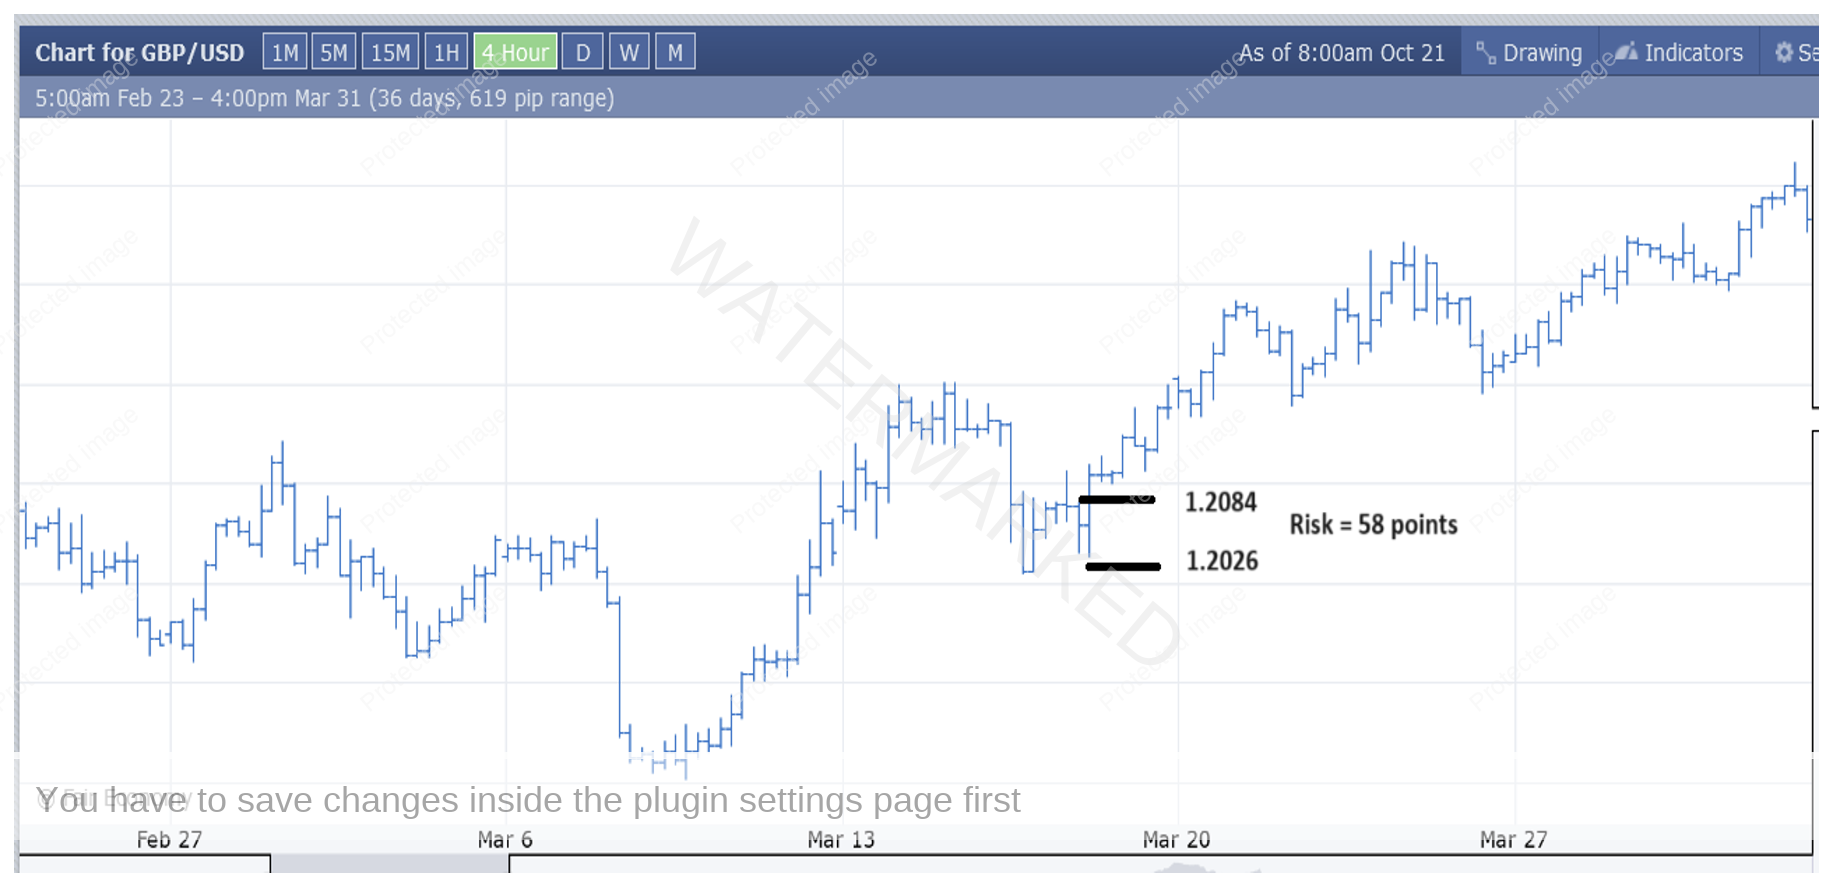
Chart 10 – Reward to Risk Ratio
Being a larger 4- hour range bar, the risk was higher and subsequently, the longer it took before this trade hit a 10 to 1 Reward to Risk Ratio.
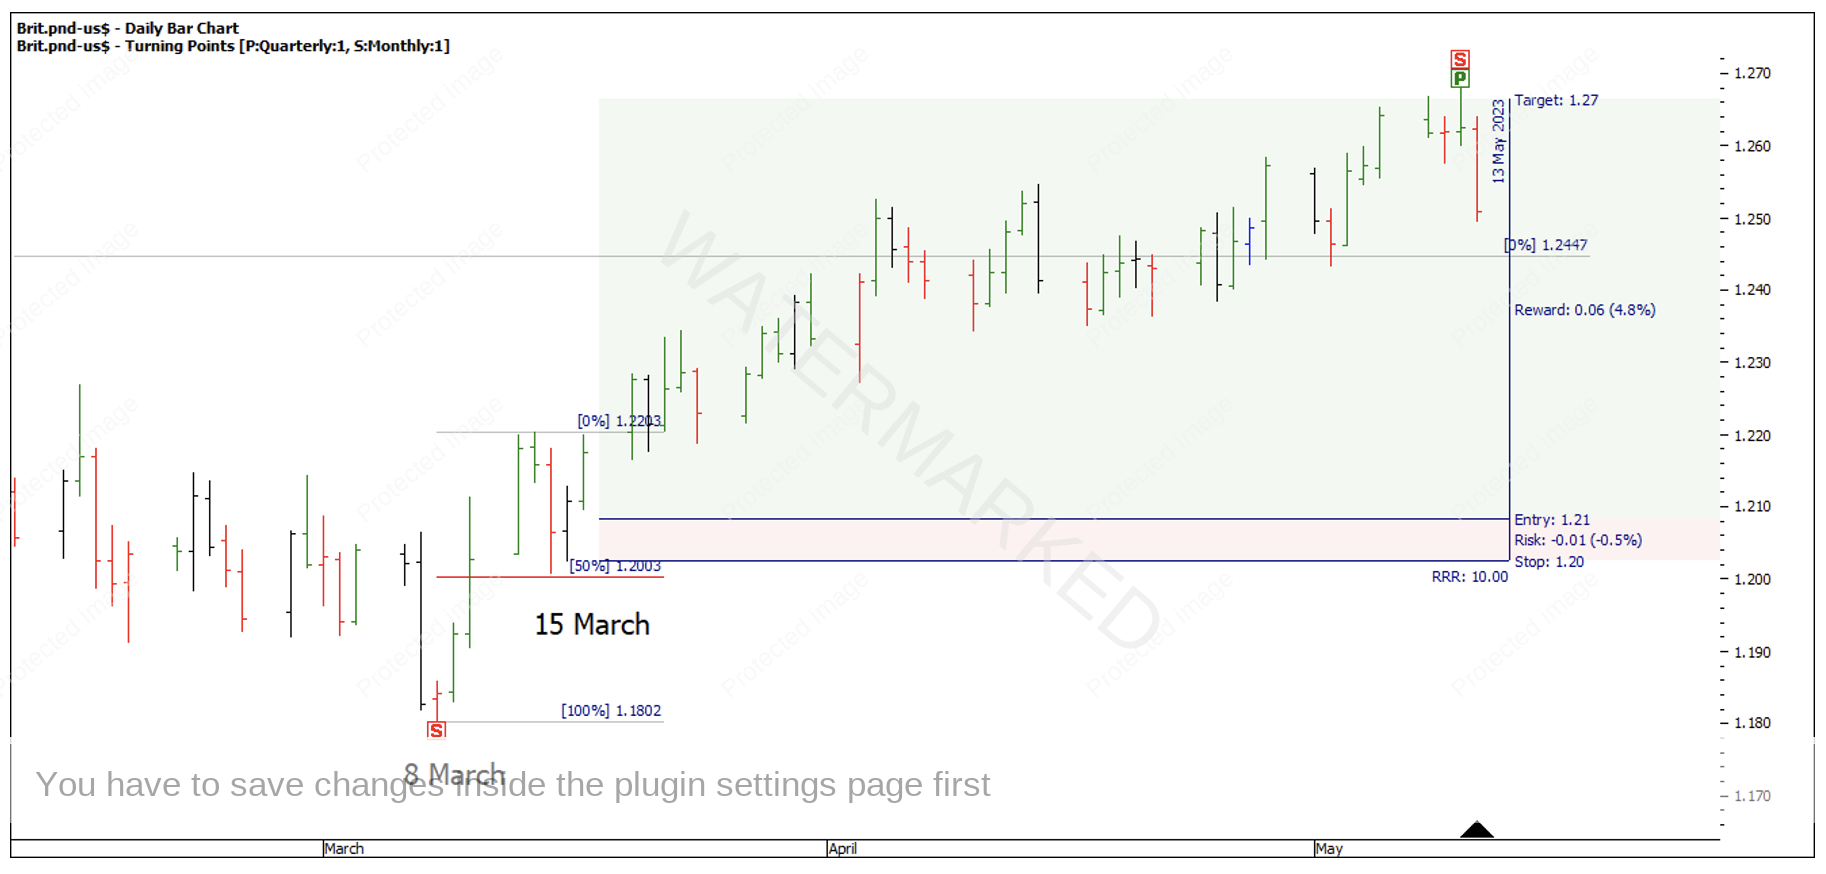
Chart 11 – Risk to Reward Ratio
You can’t take every trade but instead aim to take high quality, high probability trades while trying to minimise your losses.
Happy Trading,
Gus Hingeley