The aim of money management is to generate superior risk-adjusted returns whilst maintaining a proactive and rigorous approach to risk management. Your risk management practices should be integrated into your daily process, and based on mathematical formulas – this goes back to David Bowden’s point of having a two-page document outlining your trading strategy. He suggests that it should be a combination of strategies and formulas.
As an example, let’s say you have back-tested a market and have found that a particular Classic Gann Set Up such as Double Tops work particularly well. Your research has proven to you the most profitable exit strategy. After having committed all the time and energy in testing the Classic Gann Set Up across your market, you have put together a trading plan which outlines your entry, exit, trade management, and money management plans. At this point you should be ready to take every signal that the market has to offer.
As part of your trading plan, let’s assume that you’ve chosen a risk profile of 2.5% risk per trade, so only 2.5% of your capital is exposed to the market (subject to liquidity), leaving 97.5% of your portfolio available for margin. As outlined in the Smarter Starter Pack, the total position size will be dictated by the entry limit and stop loss, allowing the system to automatically exit a position before it exceeds the 2.5% risk threshold.
The table below illustrates the Sensitivity Analysis of 2.5% per trade, which is outlined in your trading plan. The example below is based on a $100,000 account. Sensitivity Analysis is also commonly known as the ‘risk of ruin’, which measures the maximum risk on consecutive losing trades before a substantial drawdown of the account occurs, often ‘ruining’ the account.
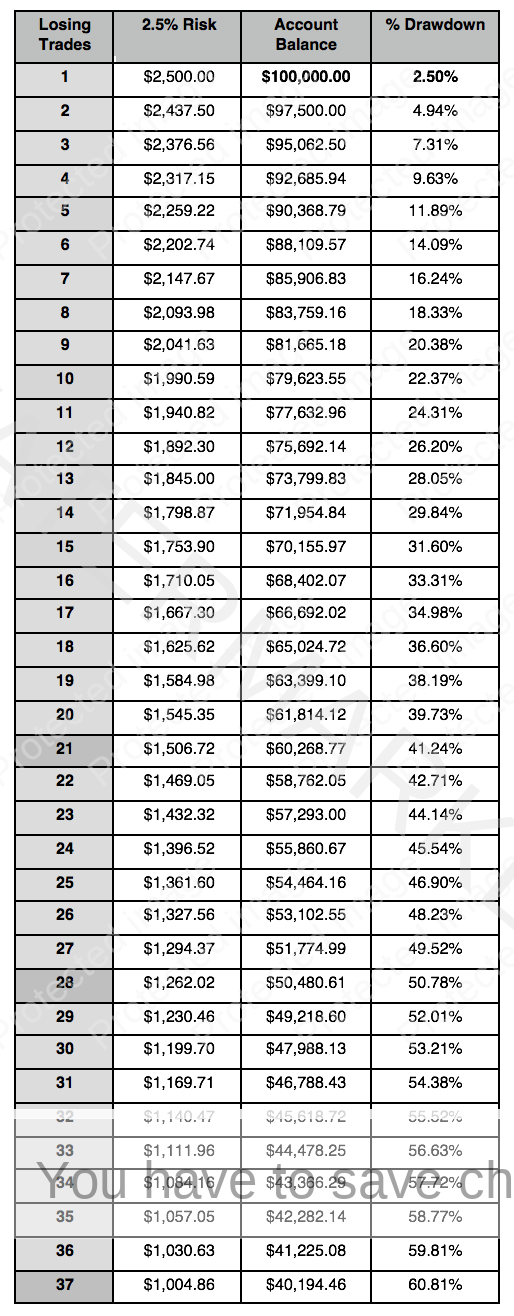
If you have ProfitSource you should be able to test a market with historical data. In the markets I follow, I have never had more than 8 consecutive losses in a row – of which during this time the system only experienced a -13.10% drawdown, compared to the Sensitivity Analysis claiming to have drawdown -18.33%. Of course in the future this can change but history is often a good way to dictate the future. This is what the ‘Gann Methodology ’ is all about – history repeating. The reason for this arises from the fact that losing trades are automatically exited immediately, allowing profits to outweigh losses.
You need to be confident that the formulas and strategies embedded within your Trading Plan will be profitable at the end of the day. Do the back-testing and work the probabilities and statistical data out to emphasis so. You should have the confidence and benefit of having done the research and development and understanding periods of your market.
It’s Your Perception
Robert Steer