
Accumulation or Distribution?
This month’s article is the second in a mini-series on the latest technical updates in the Soybean Oil and Sugar futures markets. As back ground reading you can find a link to last month’s article here. For bean oil, in brief, the sentiment last month was bullish, especially in terms of our perspective from the weekly and daily swing charts. These are always worth keeping an eye on. As a commodity nears the end of a sideways move, when the swing chart takes shape it can give an indication of who has won the battle. The bulls or the bears. If the bulls have won a break out to the upside occurs, and we have a proven case of accumulation. If the bears win, a break out to the downside occurs and it was a case of distribution.
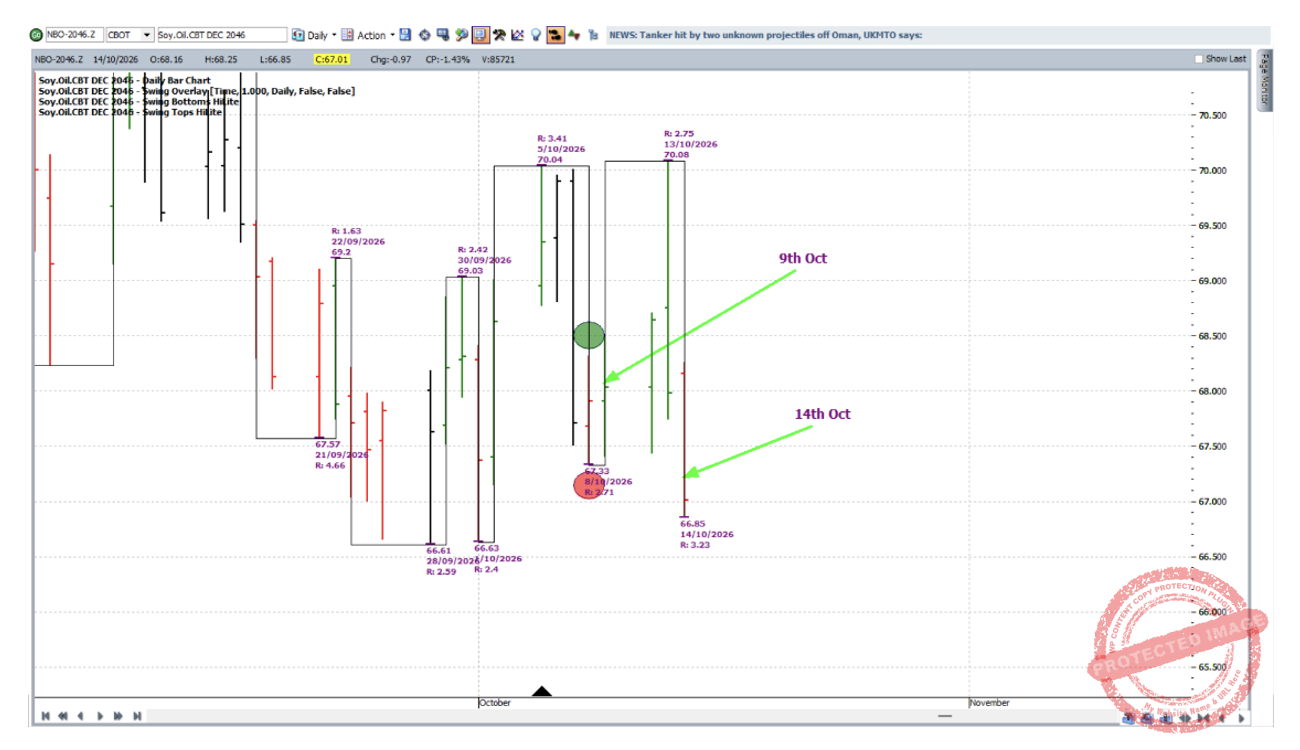
To fill in the story since last month, a higher swing bottom entry on the daily chart (bean oil’s December 2026 contract) was taken with major (weekly) trend sympathy, only to be stopped out a few days later with very little chance to lock in any profit on the long side.
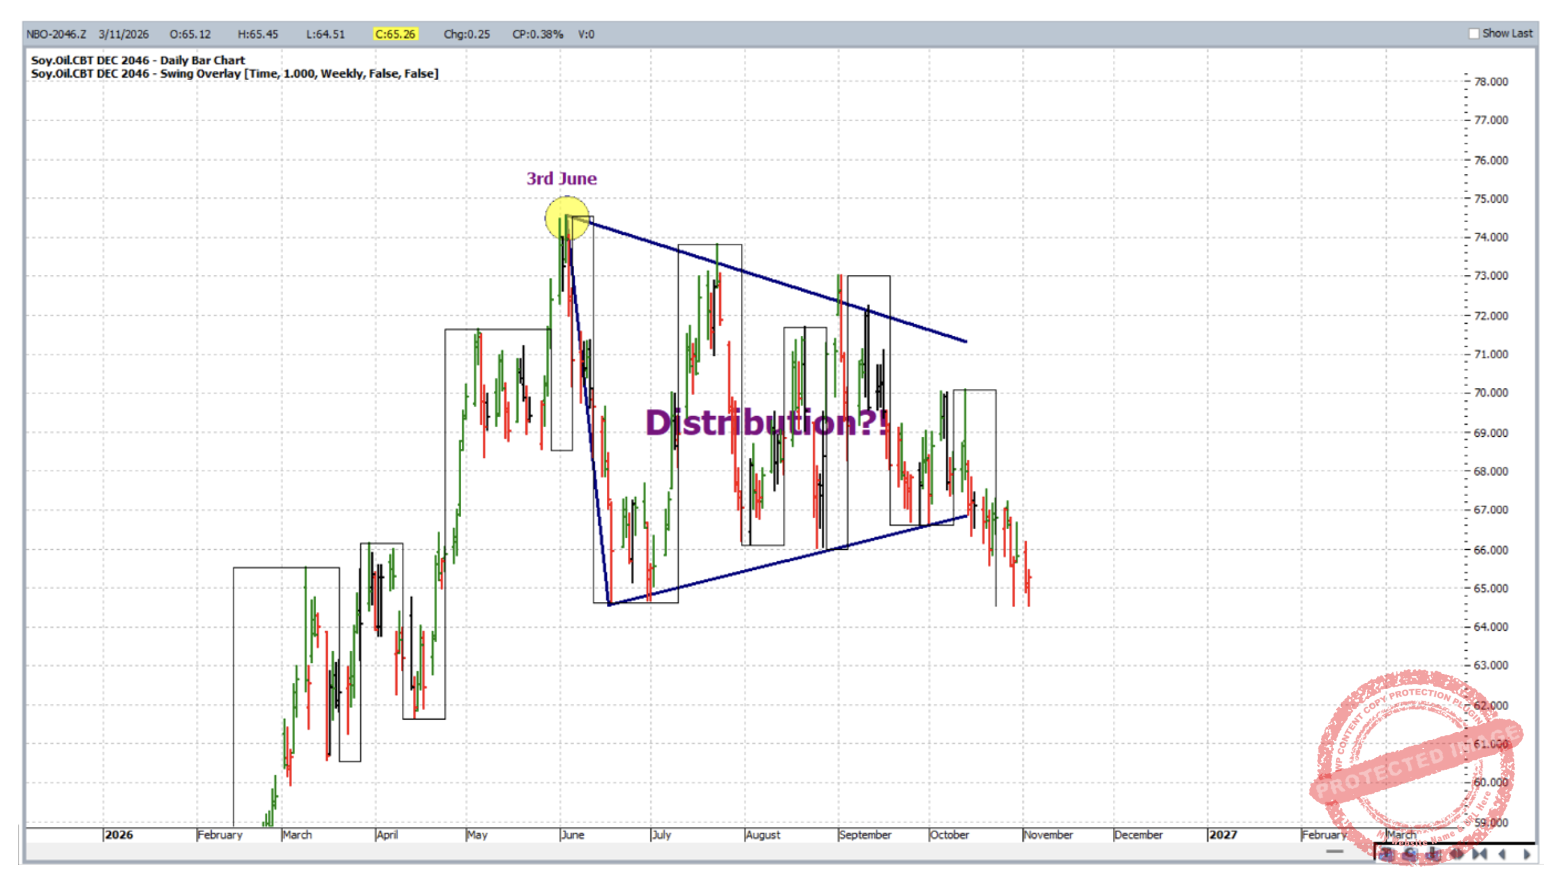
So how can one get it wrong and still make money? The answer is simple: take a deep breath, and go back! Soon after the long position was stopped out, the weekly swing chart turned and clearly indicated that the trend was down. This is shown below in ProfitSource with the aid of the weekly swing chart overlay.
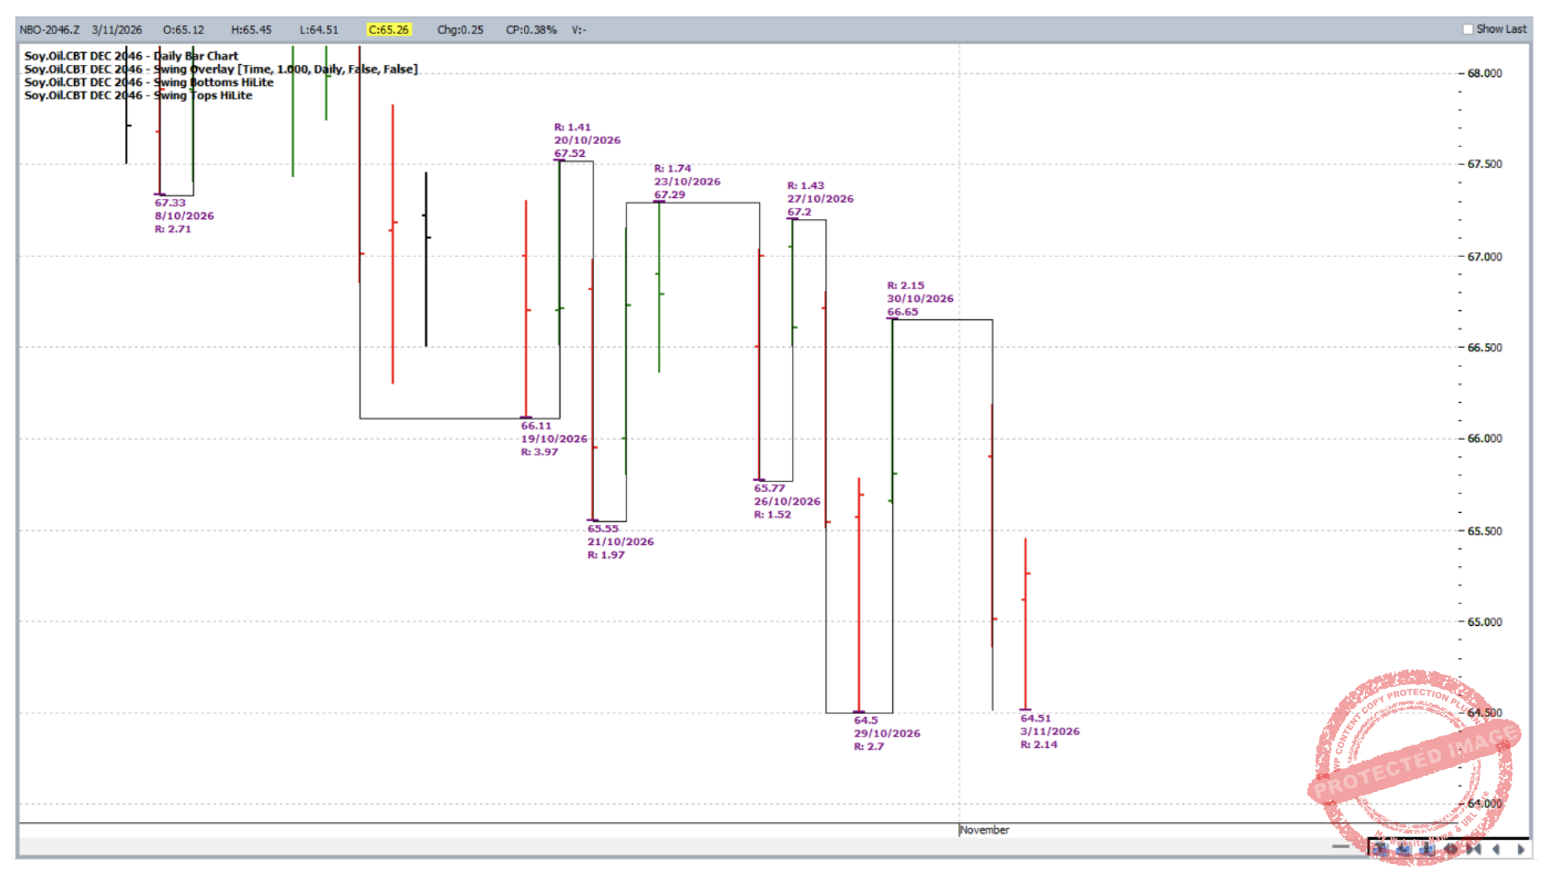
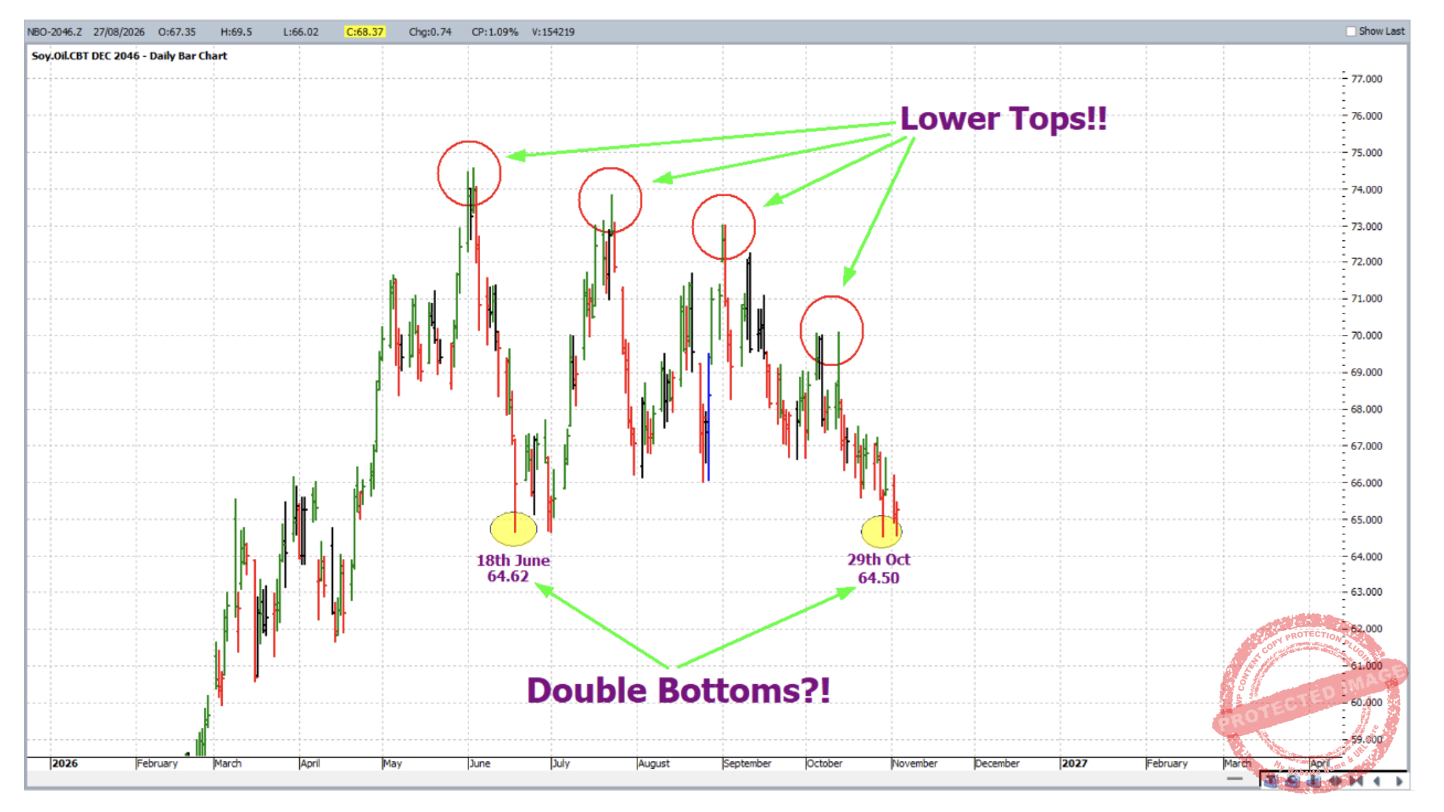
Potentially there is now the case for a strong down trend as this market exits a distribution period. The daily swing chart has given early indications of this with a clear down trend. This is shown below with up to date data and the aid of the daily swing overlay and swing tops/swing bottoms hi-lites.
The only thing in the way of the bears at the moment is a potential double bottom formation, with the June and October lows, and the potential for a higher daily swing bottom at the time of writing.
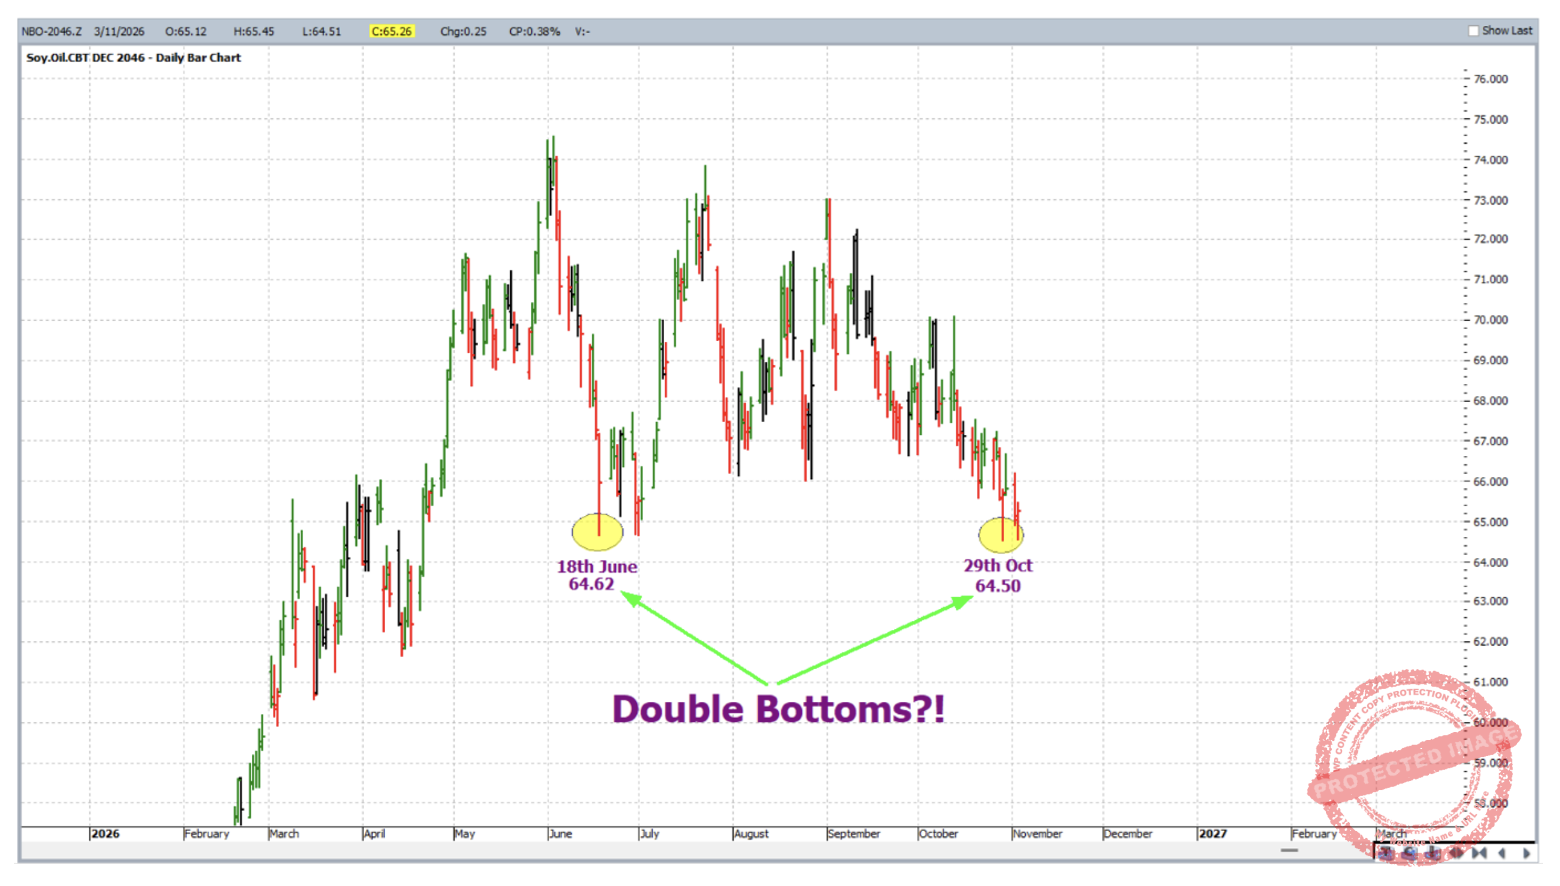
The bulls would need to get some serious energy from somewhere however because the series of recent lower intermediate tops is very clear:
From this point forward the message with bean oil is clear. Keep an eye on it!
As for sugar if we first take the simple approach, technically the bulls are still in control with an up-trend on the weekly swing chart. This is shown below on Sugar’s Gann chart for its March contract, with the aid of the weekly swing overlay.
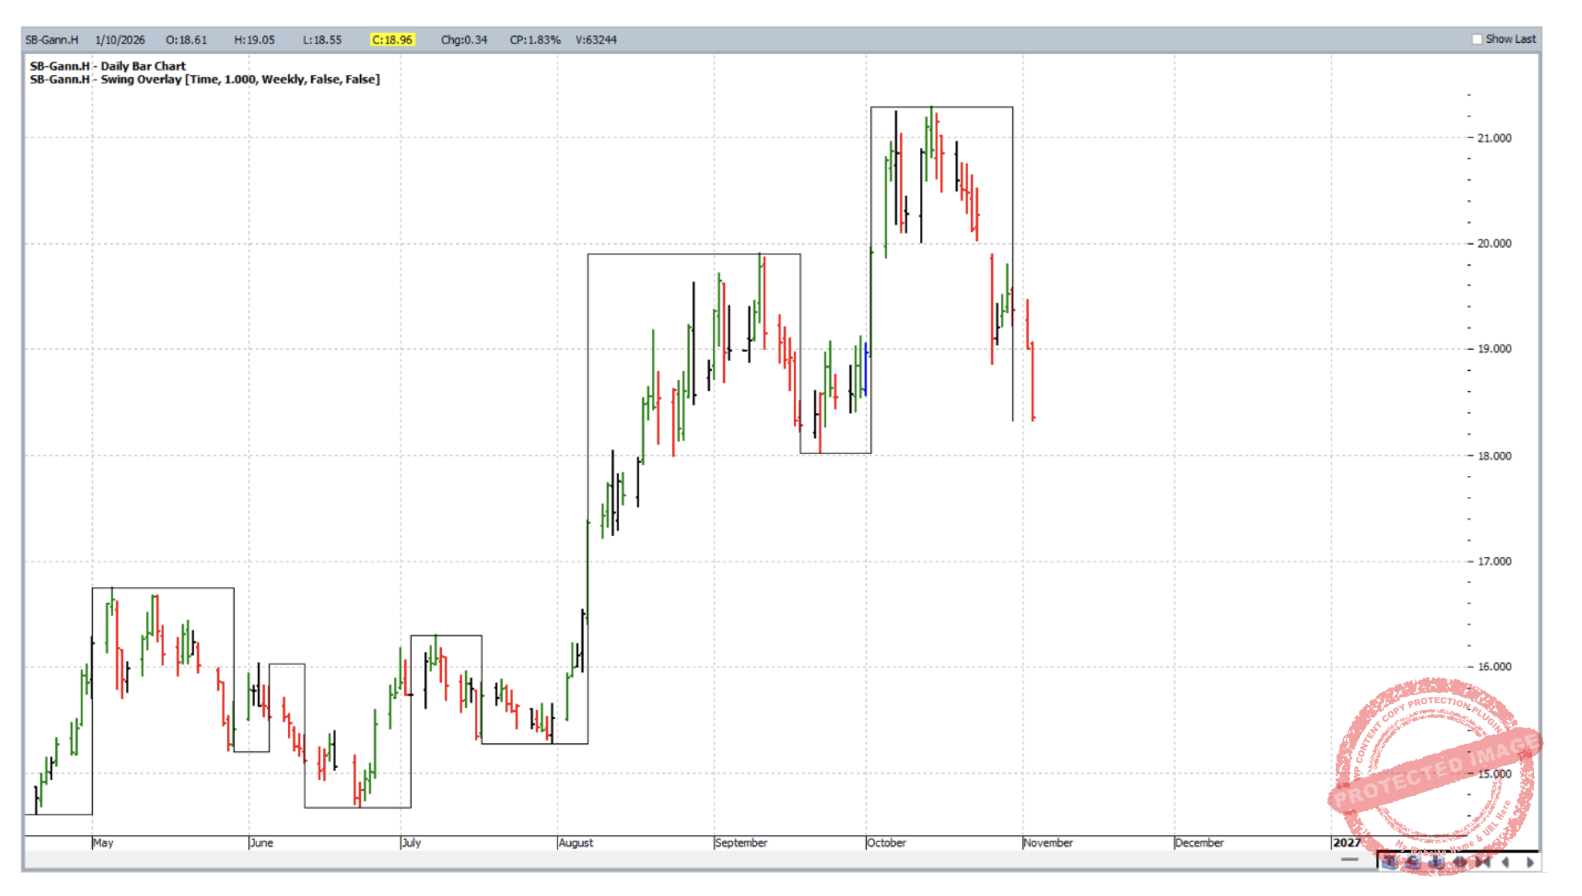
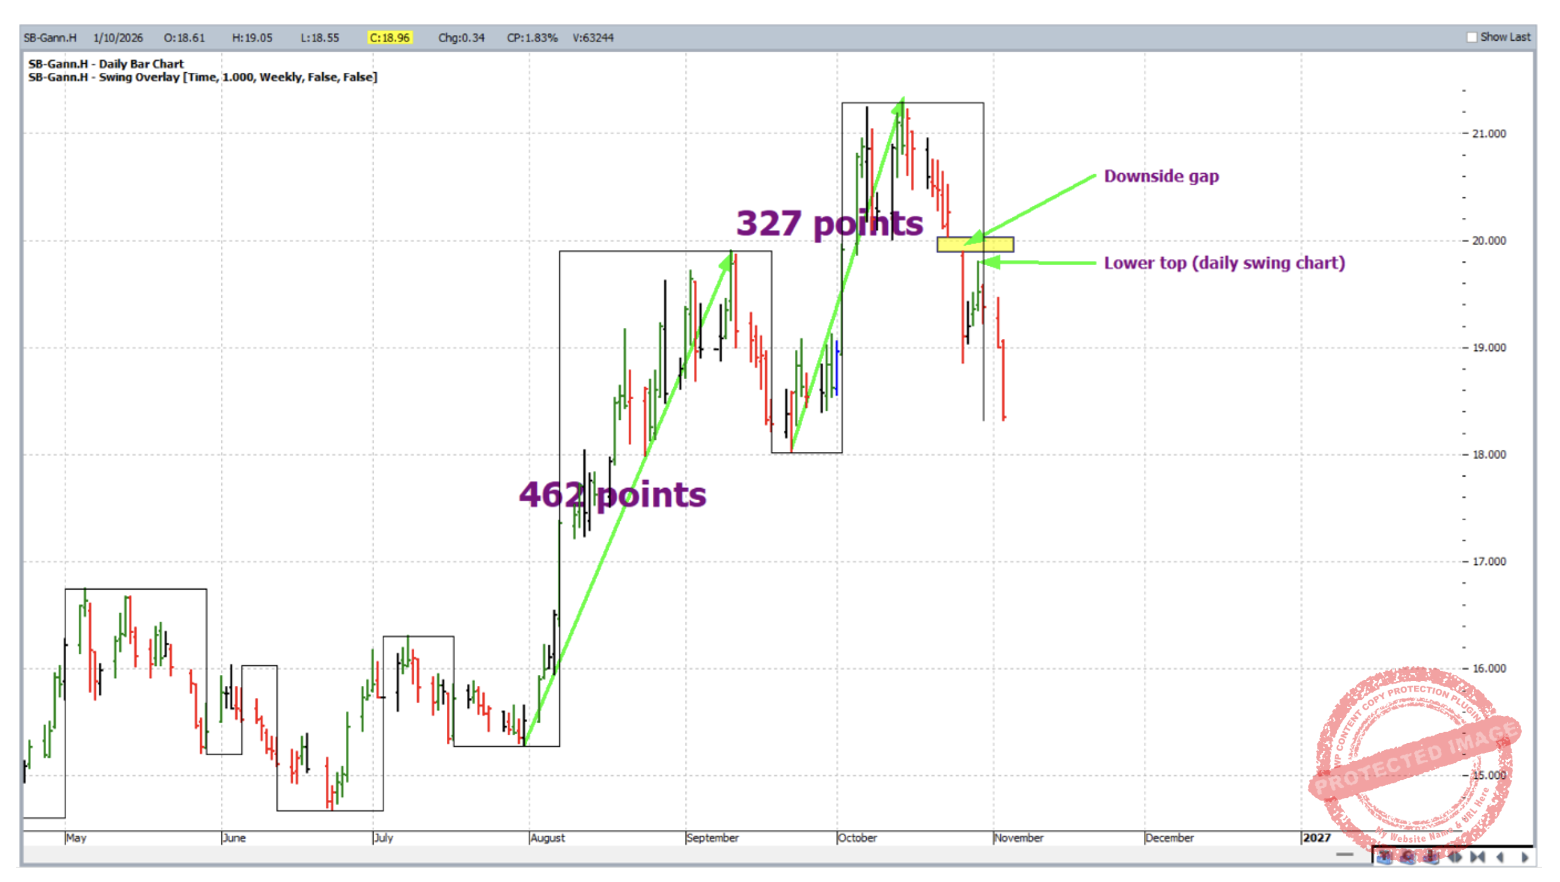
Since last month however a few signs of weakness have emerged: A contracting weekly upswing, an expanding weekly downswing, a downside gap, a lower swing top on the daily chart, and most recently a big down day. Collectively these factors would caution the bulls!
Going into detail with some analysis, at the time of writing there is the potential for a triple bottom formation at the all-important 50% resistance level on a Ranges Resistance Card. Also, for Ultimate Gann Course students there are some strong time elements looming.
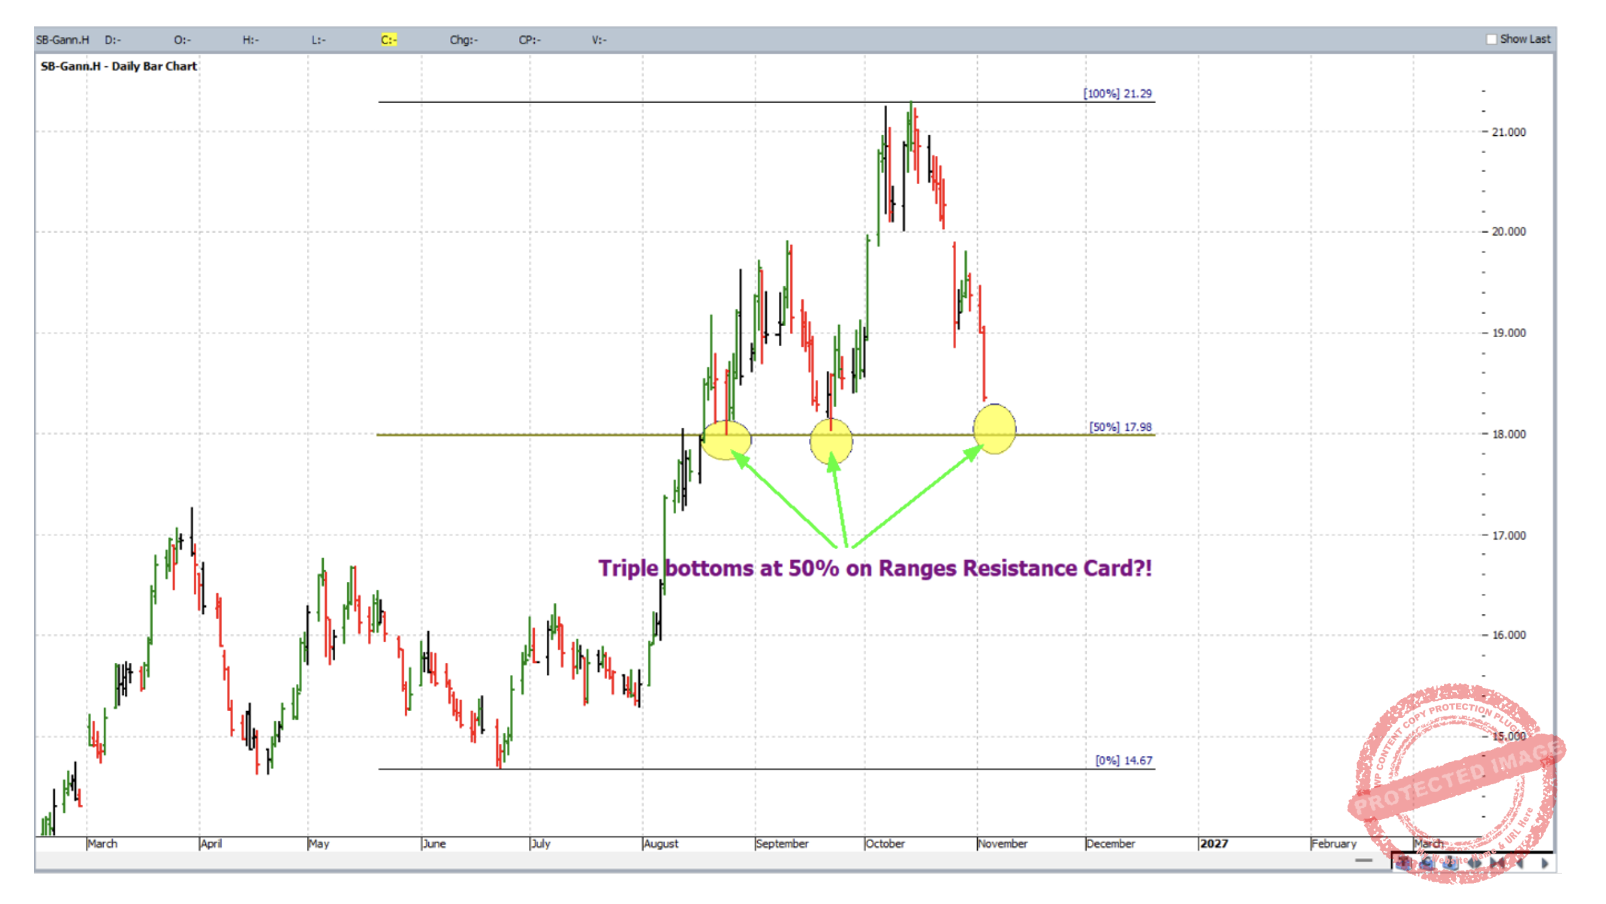
The above set up makes a strong case for reversal back to the upside. Only a lot of bears could cause it to fail. Either way we’d expect a show down that’s worth keeping an eye on.
Work hard, work smart.
Andrew Baraniak