fbpx
Let’s enjoy a coffee break with an exploration of numbers. Numbers are all around us. Having stepped into the Gann Methodology we are never short of studying numbers. Gann quotes Michael Faraday, a late 18th century scientist who commented that the universe is made up of mathematical proportions. Mathematics is the global language of numbers which are the building blocks of calculations.

Numbers have their own psychology surrounding them. We often gravitate towards some and shy away from others. Within the markets, understanding certain numbers gives you greater meaning to the psychological outcomes likely to present. By taking these outcomes it can be effectively applied to trading strategies. It is not really the case that every time a market hits a psychological number it will do ‘X’, but more so understanding the underlying market sentiment is a very wise move in order to understand human traits and tendencies.

To give you an example, the number 100 is officially the end of the double-digit journey. It’s the first number that uses a combination of three numbers for it to form. It offers a sense of completion or full-circle effect. 100 is also ten multiples of ten. We are all familiar with the human hands that typically have 10 fingers and the human feet, having 10 toes. 10 is the first number that uses a combination of two numbers to form the start of the double digits. Both 10 and 100, provide a sense of rationality and order. It seems to be a simple round number that sits well with the human brain.

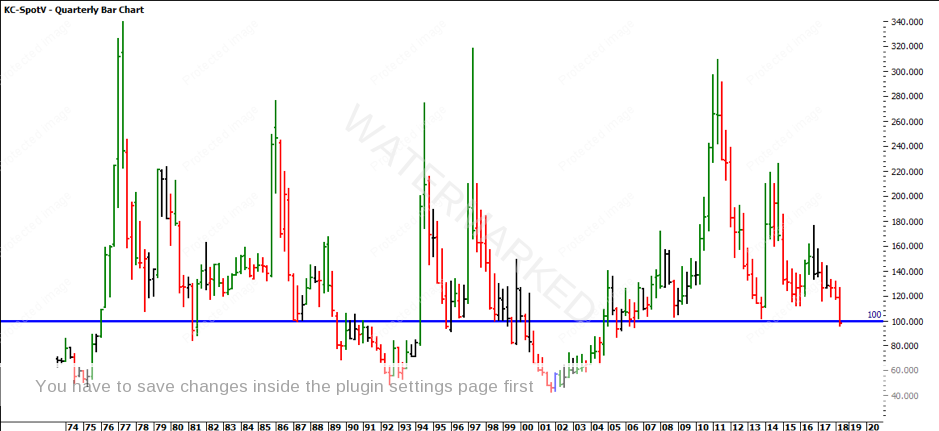
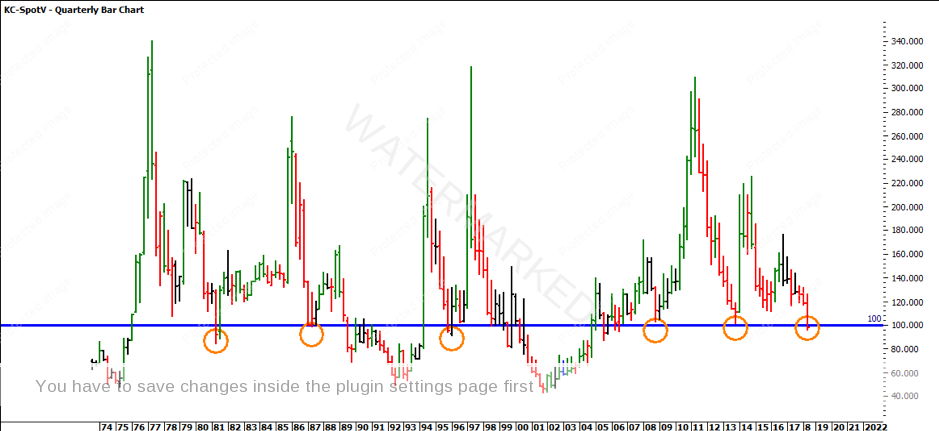
If you refer to the Coffee chart below (ProfitSource: KC-SpotV), you will see that there is a horizontal line through $100 that covers the history of the coffee market. It looks like coffee is a market that likes gravitating around the $100 level (maybe this has to do with a price of coffee in Sydney these days).

Historically, if we take a look at times when coffee gravitated around the $100 level, you’ll see that in 1981 the market broke the $100 level prior to finding support. In 1987, the market bounced off $100 and again in 1995, 2008, 2013 the market found support. In 2018, we have seen a re-test of the $100 level and excuse the pun, but is it time for a coffee break?
If we take a deeper dive into the charts and zoom from a quarterly chart into a weekly chart, you’ll note that this is the first time in 12 years since the market has broken the $100 level. Gann talks about the market breaking through on the fourth time, yet the question should be: Will coffee continue to fall or is this a false break?
If we take a look at this set up from two perspectives and not assume anything just yet, we can have the objective of anticipating a longer-term trade. This can be regardless of whether the market continues down or reverses up. Since May 2011, the market has been continually making lower tops. The past year, the market has also continually made lower tops, leaving you with the assumption that the bears are in full force. That was until the market hit $100.
Was this a tactical move by the bears, pushing the market to the psychological level of $100 before buying again? One thing that automatically stands out in the current set up is that the market has broken the $100 level, yet it has failed to move forcefully. You might assume, given the market has not been at these levels for 12 years, any bears in the market would be eager to explore the undiscovered area of price and continually push lower. Yet, the market has been able to break $100 and close back around the $100 level.

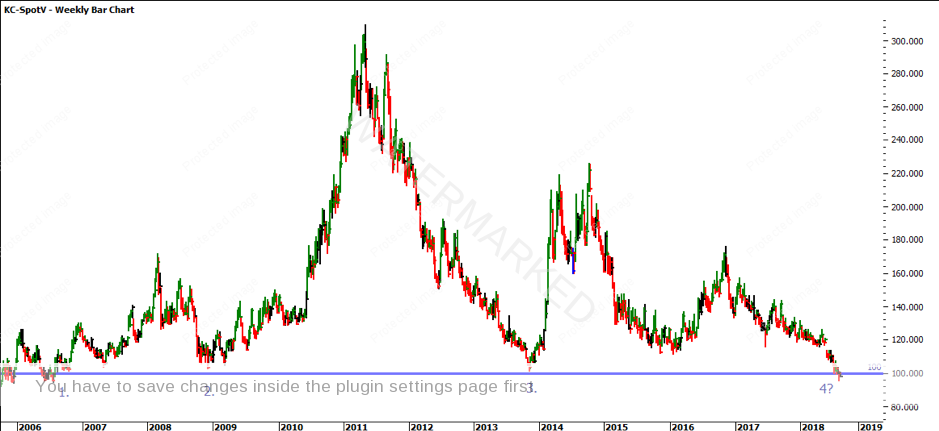
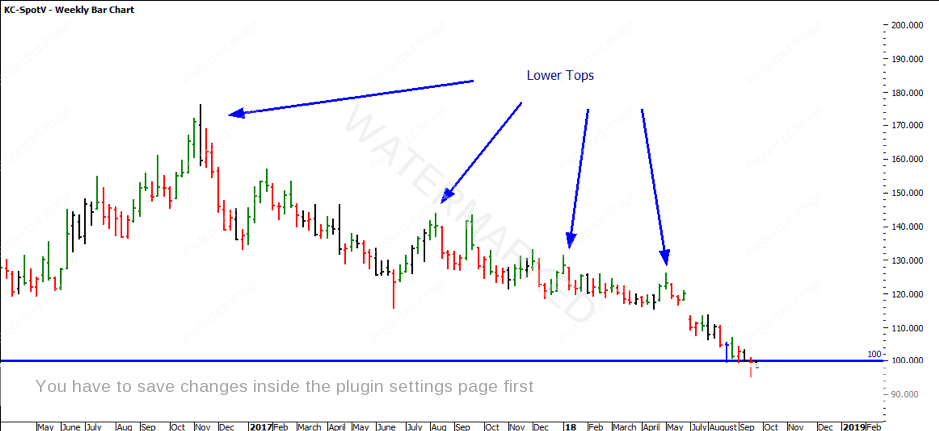
I am not suggesting that the break has failed just yet, but we are at the start of the beginning of a potential move in either direction. As David Bowden says we don’t want to be anticipatory stupid, so let’s monitor this set up over the coming weeks to see how the weekly chart closes in relation to the psychological level of $100.

It’s Your Perception

Robert Steer

error: Alert: Content is protected !!