This month it’s about Double Tops and Double Bottoms, and their 200% milestone – a common topic of conversation at the Trading Tutors desk, and amongst traders in general. In “Rule 2” on page 118 of the Number One Trading Plan manual, David states “After a Double Top or Bottom a market can be expected to complete 200 percent of the previous range.”
Sound too good to be true? Absolutely not! Take a look at a few previous examples:
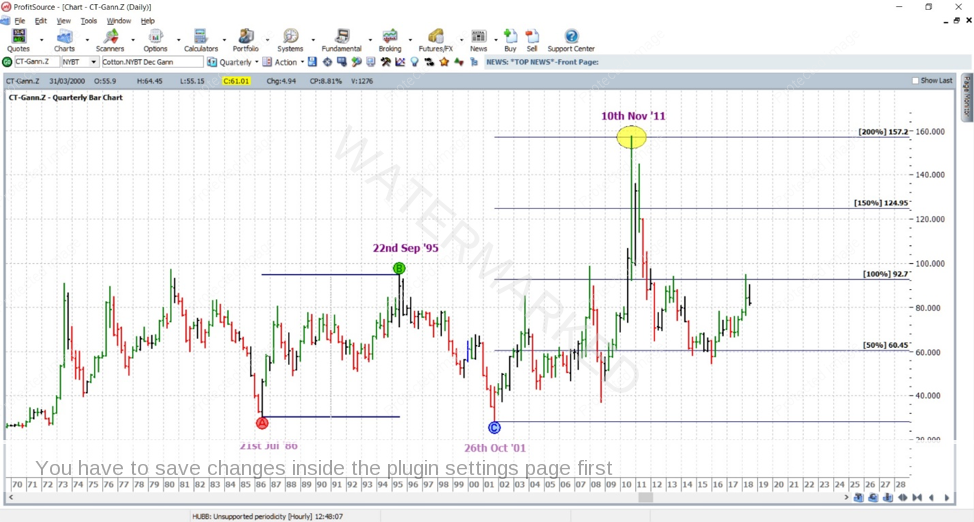
Chart One – The December Cotton futures contract (CT-Gann.Z in ProfitSource)
The 200% milestone, in this case, is shown on the Quarterly chart. A very big picture time frame.
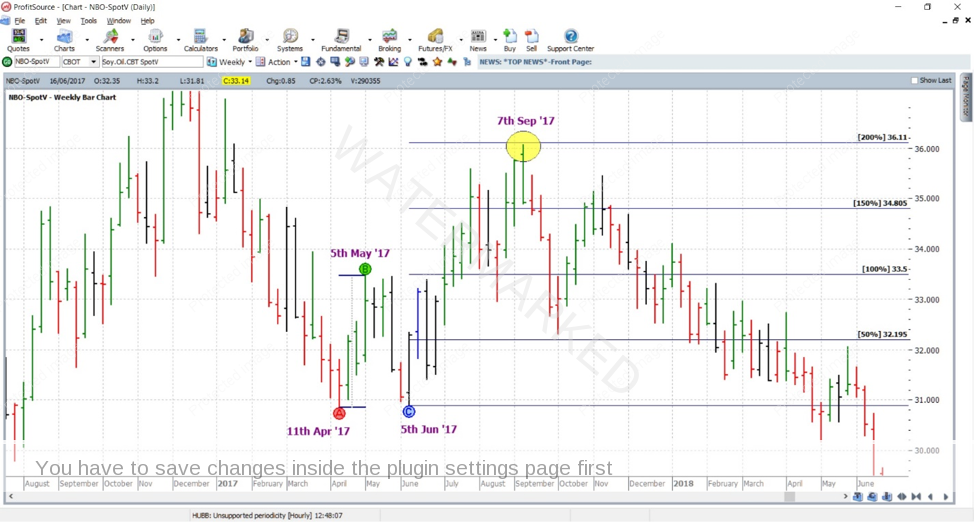
Chart Two – The Soybean Oil futures contract (NBO-SpotV in ProfitSource) weekly time frame.
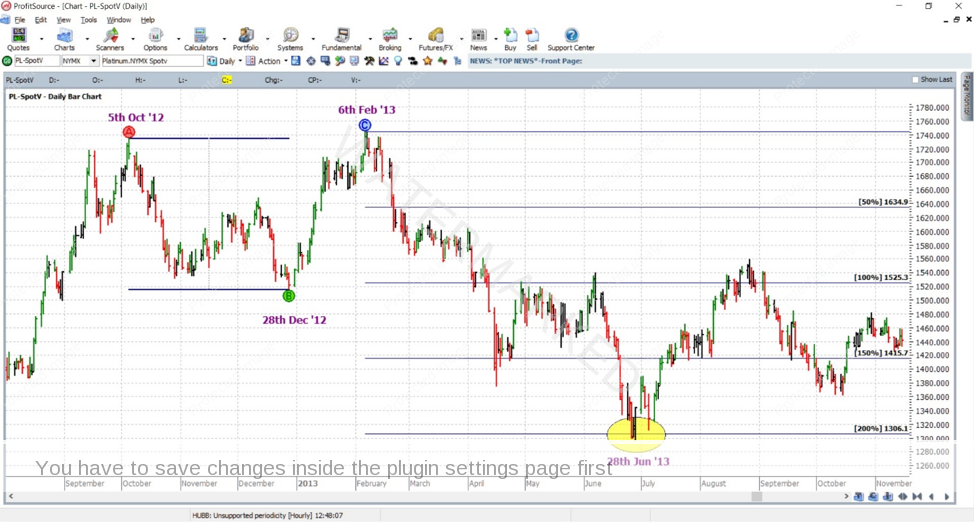
Chart Three – The Platinum futures market (PL-SpotV in ProfitSource) daily time frame.
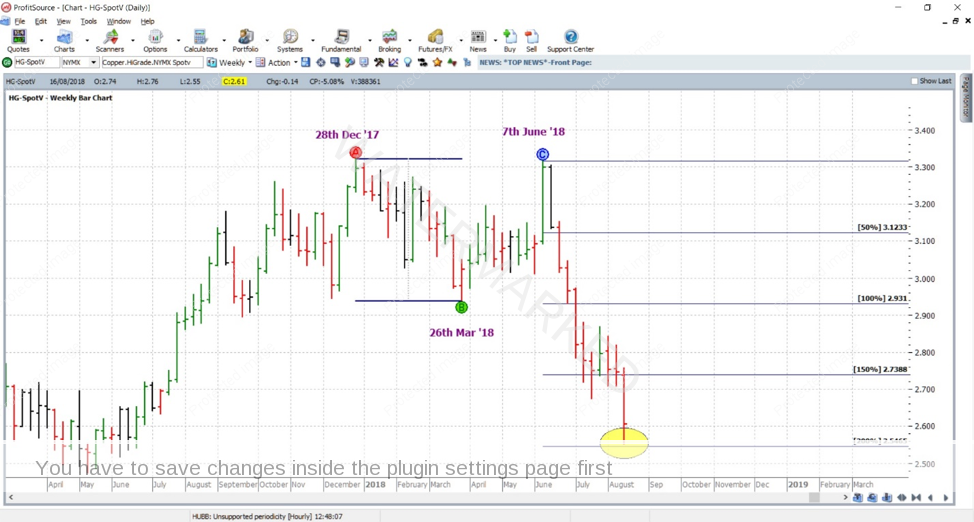
Chart Four – The High-Grade Copper futures market (HG-SpotV in ProfitSource) weekly time frame.
So what does this all mean (besides giving validation to “Rule 2”)? The first and most obvious thing is a potential profit target at the 200% milestone. Then we also have a price level to watch for a major reversal. All of your available price and time tools come into play with the analysis. Not to mention trade entry and stop loss management. In other words, all of your knowledge from the Smarter Starter Pack and beyond comes into play.
Now with the theory aside, here’s an exercise for you. One of the above examples, in particular, had its Points A and C at a major resistance level. Which one is it? Send in a chart to illustrate. What can we conclude here in terms of trade probability? A really good Double Top or Double Bottom set up may not seem to appear every day. But when they do, they can be well and truly worth our attention. Keep an eye out for them in your routine.
Work hard, work smart.
Andrew