It should be no shock to many that the Nasdaq (tech heavy index) has performed superbly off the back of the majors like Facebook, Twitter and Apple (recently becoming the first company to exceed a market cap of $1 trillion). The broad investment community has done well to be exposed to the long side of tech as a trader or investor. Many would argue that the tech sector has dragged the broader market along in the US, but given the length of this bull market, the global trade wars and even the Trump effect can it last?
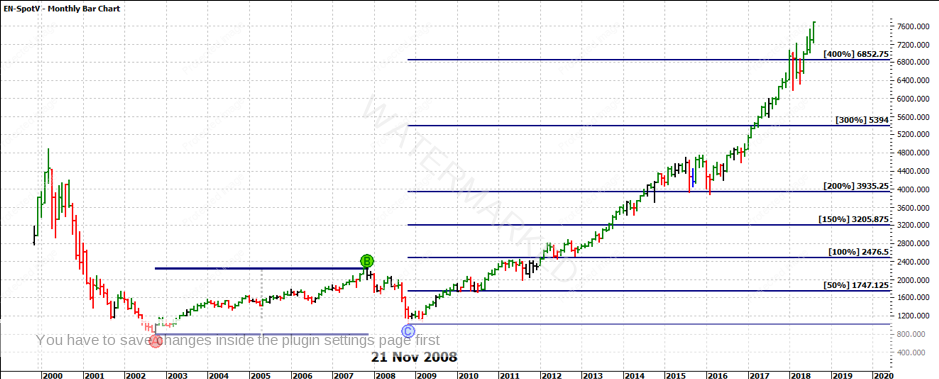
Chart One – E Mini Nasdaq Monthly Bar Chart
A quick reminder of where it all started, Chart One looks at the E- mini Nasdaq futures contract and the date the low came in back in 2008. This was the area where the markets commenced their rebound after the GFC and a keen eye will note the Nasdaq made a double bottom in March 2009 but it’s clear it started to arrest its descent well before the broader S&P 500. In that time the Nasdaq has risen multiple times that low to its current market high.
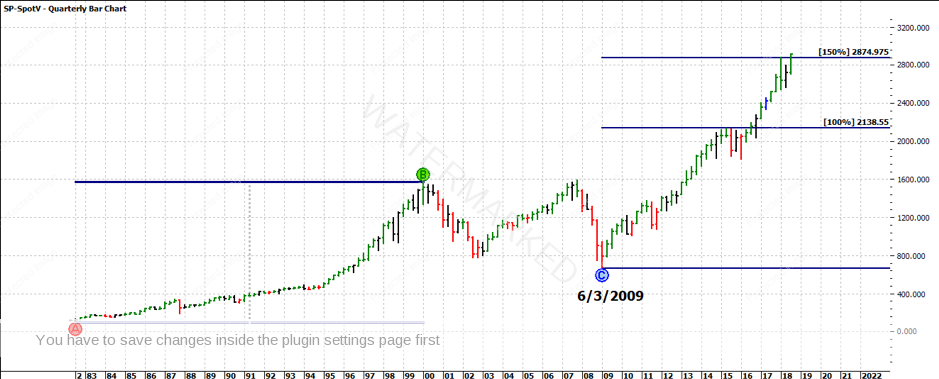
Chart Two – S&P 500 Monthly Bar Chart
Chart Two displays the S&P 500 futures contract that bottomed in March 2009 and has since risen to 150% of the previous range. On our Pressure Point chart, David tells us to think of this as a possible Point A. Clearly the S&P 500 has not risen as strongly as a shape or percentage when compared to the Nasdaq, and this is where we could be using any potential top on the Nasdaq as a cue to the S&P 500 when using Gann’s leaders and laggard’s discussion.
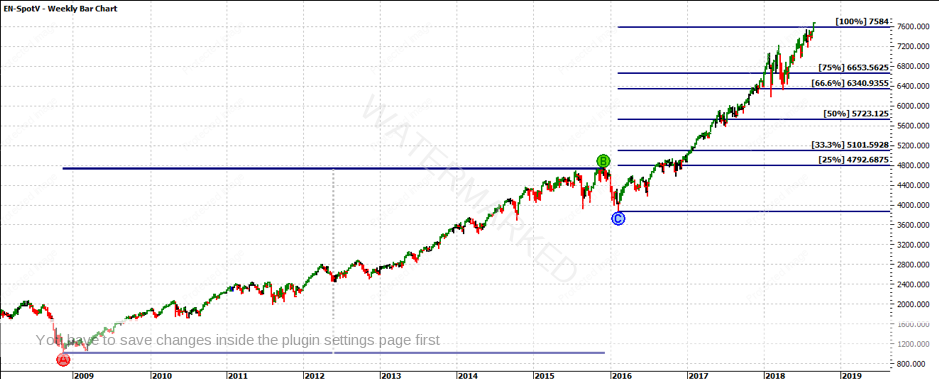
Chart Three – E Mini Nasdaq Weekly Bar Chart
One of the hardest technical analysis points with the Nasdaq currently is one of Mat’s favourites which is sections of the market. The general shape of the Nasdaq with small and limited pullbacks has made it difficult to break down the sections of the market. If you use the pullback into 2016 as a guide and project ranges we see that the current high has just passed the 100% of the range (or a repeat). The big difference this time round is the reference move was approximately 6 years from 2008 to 2015 whilst the same price has repeated in under 3 years. This is shown in Chart Three.
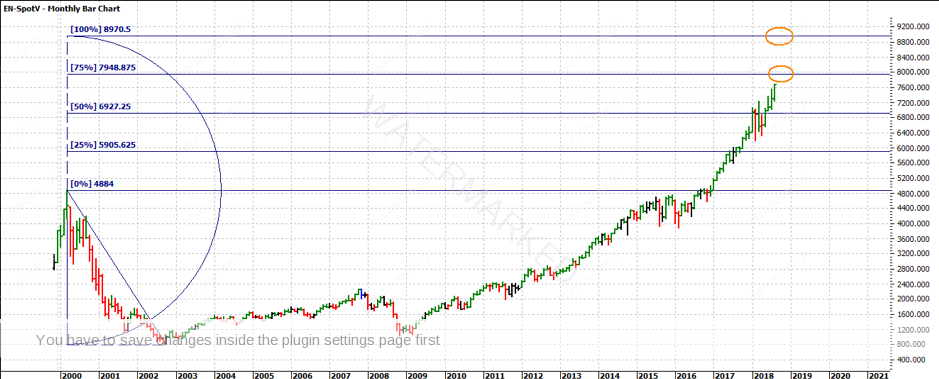
Chart Four – E Mini Nasdaq Monthly Bar Chart
In examples like this where sections are somewhat harder to break down I have another tool to assist in projecting ranges. In Chart Four you can see the Tubbs 2-point swing rule in use. The basic premise is that a market will go as high above a top as it did below. Using the tech wreck top in 2000 as the reference point and the all-time low of 797.5 we see the current projection suggests more upside but whilst the projections are possible the market may not go there in a straight line.
The understanding of Frank Tubbs work was something that David unearthed and brought back to life through Safety in the Market. Whilst not something you might use every day it’s a great confirmation tool to fall back on.
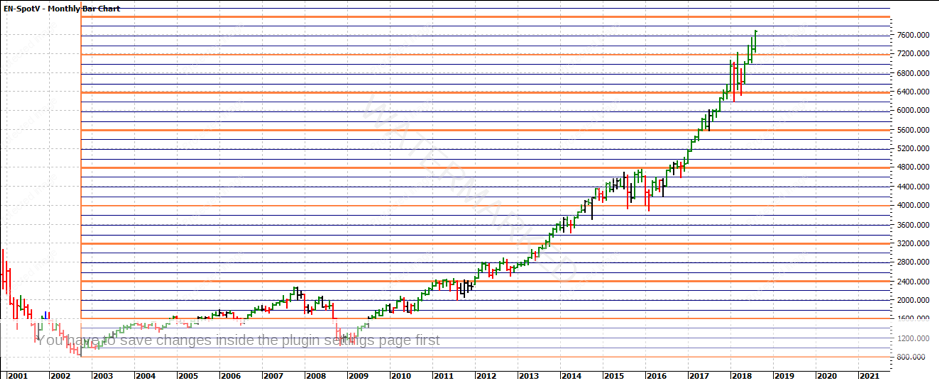
Chart Five – E Mini Nasdaq Monthly Bar Chart
The Lows Resistance Card is one that should always be on your regular charts on your markets. Given the Tubbs tool projects around the 8000-point mark as the next line of possible resistance it’s interesting when we use the lows card or simple maths. The all-time low of the Nasdaq is 797.5 so 10 times that would put us very close to 8000 points of course a round number for markets to ponder. Chart Five is the Lows Resistance Card on the Nasdaq and highlights where multiples of the lows have been useful, especially the orange lines as full multiples. To get the best understanding you need to set this chart up for yourself and go through and mark up the relevant points.
The challenge we face in terms of technical analysis and the current position of markets is as they make fresh highs it rules out the use of highs cards and Ranges Resistance Cards as potential tools for identifying support and resistance. We are still left with the likes of lows cards, pressure points and very importantly the first range out analysis.
I will leave you with two more interesting chart on the S&P 500 in terms of the first range out and the current position. Using the first range out of 2009 on the S&P 500 and applying it to the 2016 low we see the current range is 200%. If we combine this with Chart Seven using the first range out from 2016 we are close to 100% of that range.
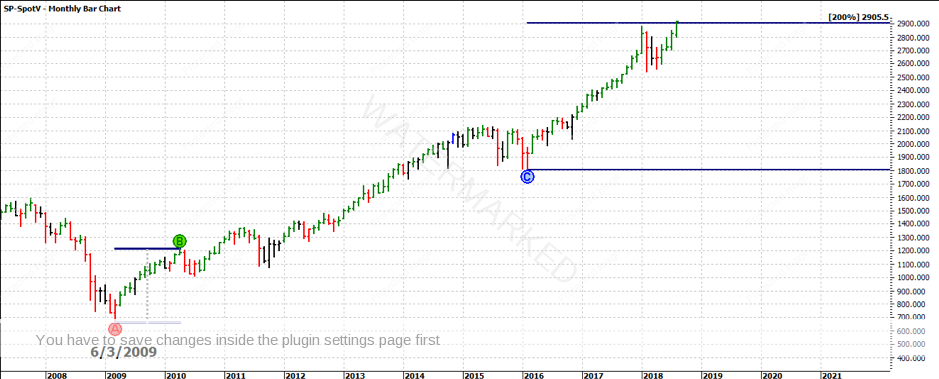
Chart Six – S&P 500 Monthly Bar Chart
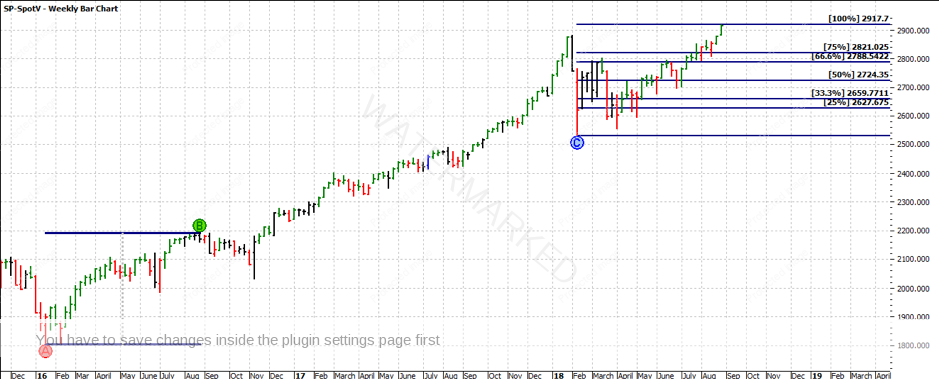
Chart Seven – S&P 500 Monthly Bar Chart
As we all realise none of these factors guarantee markets are ready to turn, I would be studying patterns that tops generally make. I would also be closely watching the Nasdaq for signs the run is over. That, in turn, may give some guidance on the S&P500.
Good Trading
Aaron Lynch