On a regular or semi-regular basis, I will scan through a list of charts using ProfitSource (to begin with at monthly or weekly resolution, then down to daily), and apply a Ranges Resistance Card (available from the Drawing Tools Box) with nothing but the 50% resistance level showing. Try this for a small list of markets, it’s a wonderful cure for “analysis paralysis” if you have ever suffered from it with your price analysis. And here is the sort of trade it can reveal. Read on…..
Chart One below is the continuous chart for the March Corn futures contract (NC-Gann.H in ProfitSource). In other words, it’s what we call a “Gann Chart” – which in this example links the March contract of each year for corn futures, at expiry. Applying a Ranges Resistance Card to the range from the 31st August 2018 low (325.00c) to the 24th May 2018 high (437.00c) gives us a halfway point (or 50% resistance level) at 381.00c. On the 5th September 2018, the market met this resistance level.
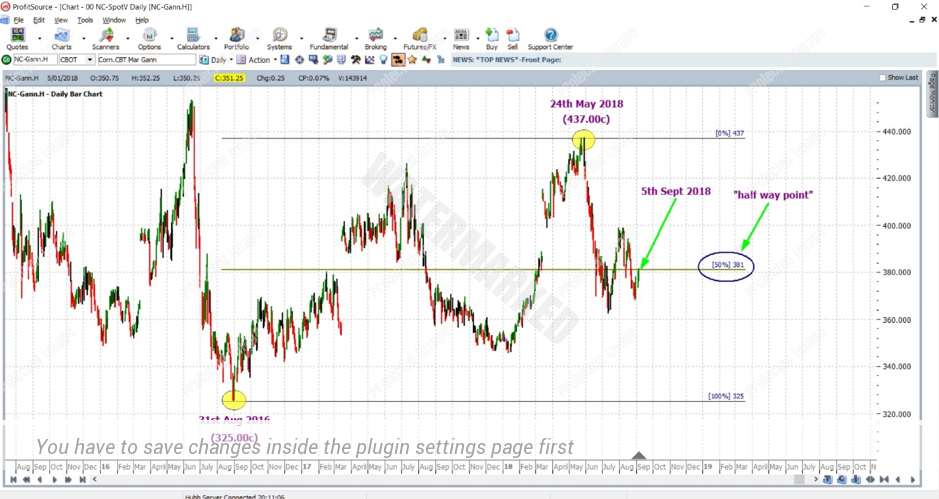
Chart One
Chart Two below is for the same futures contract, but this time with a Ranges Resistance Card applied to another range: 11th July 2018 low (362.25c) to 7th August 2018 high (398.75c). The 50% resistance level, in this case, is 380.50c. On the 5th September 2018, the market met resistance at this level.
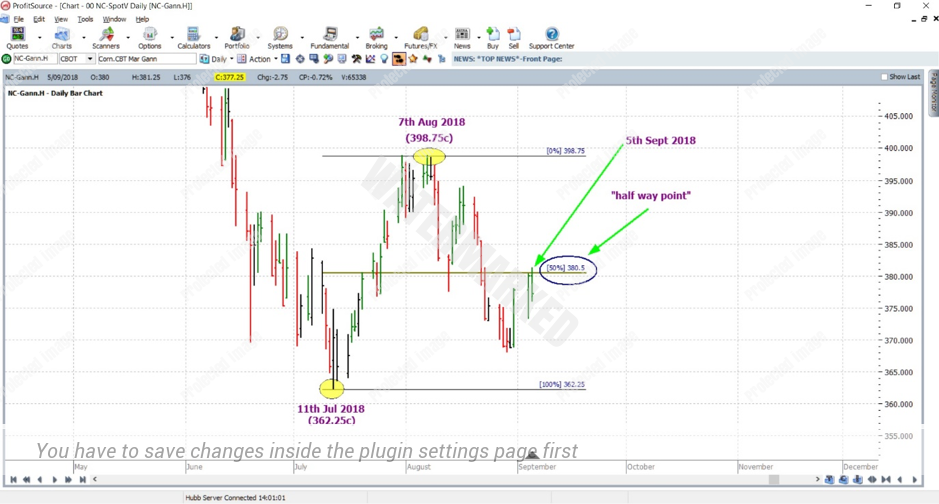
Chart Two
Chart Three below is again, of course, for the same futures contract, but this time with a Ranges Resistance Card applied to yet another range: 17th August 2018 high (394.00c) to 29th August 2018 low (368.00c). The 50% resistance level, in this case, is 381.00c. On the 5th September 2018, the market met resistance at this level.
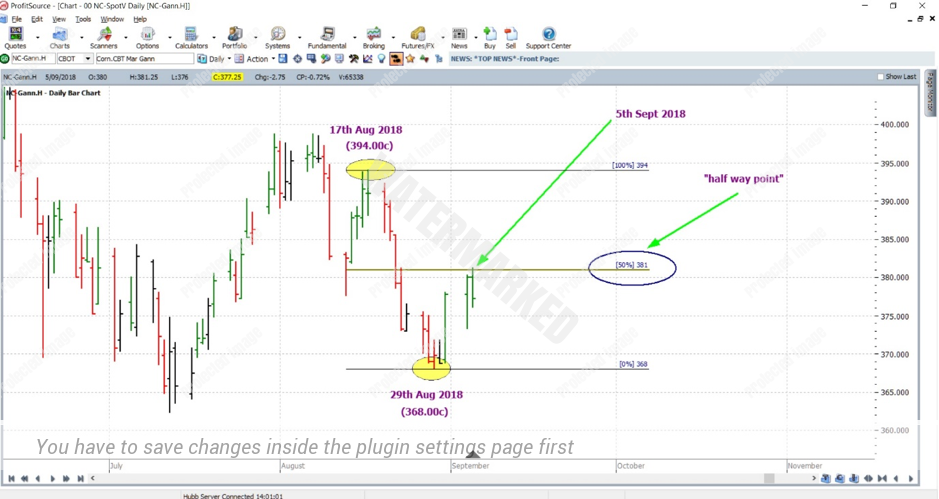
Chart Three
So, by now you have probably realised that we had a nice tight price cluster for Corn at 381.00 cents on the 5th September. See Chart Four below.
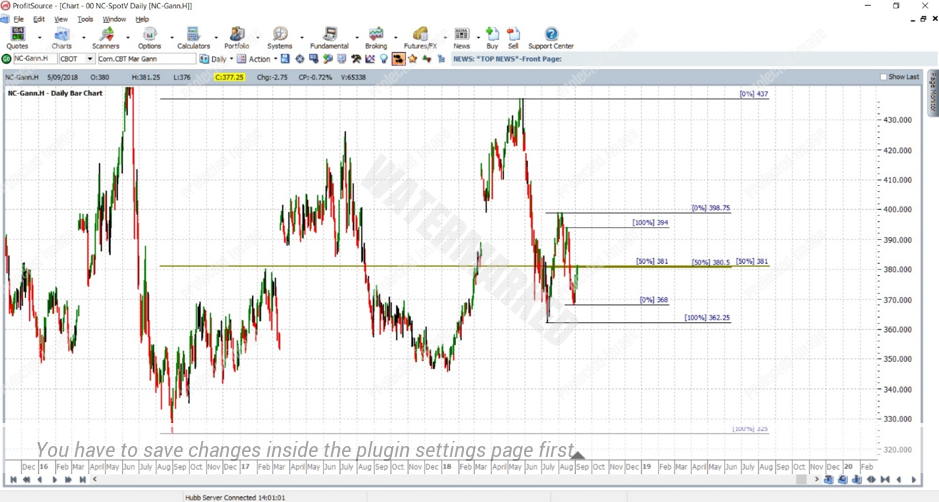
Chart Four
And having identified a strong price cluster as such, do we have a way of trading it? Yes, we do! 5th September was confirmed as the Point C of a high probability ABC short trade, which went on strongly to reach its 100% milestone on the 18th September. See Chart Five below.
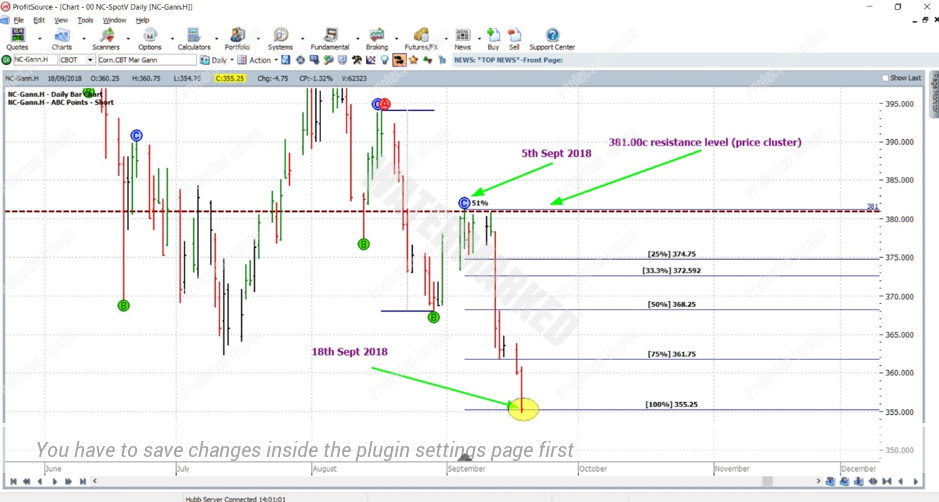
Chart Five
Recreating the charts in these articles is a good way to become familiar with ProfitSource and the analysis techniques we use. Give it a try with the charts above, and if you have any issues along the way please let us know, we’re always happy to help.
Work hard, work smart.
Andrew Baraniak