In 1988, David predicted the top of the SPI200 Futures Contract (AAi-Spotv in ProfitSource) exactly, calling a price of 1855, and nominating a date of 3 October, 1989 for the top to come in. David published the forecast a full twelve months in advance, and he even spoke about it on the Ultimate Gann Course DVDs (which were previously released as The Safety in the Market Video Series) ten months before the top was due. He must have been fairly confident to do that, knowing that those videos would last a long time!
Now, as much as I love talking about, hearing about, and studying David’s work on the 1989 top, it can present somewhat of a problem to newer traders. Can you guess what the problem is? Think about the components of the forecast: The Price was perfect, coming in at 1855 exactly, not a tick above or a tick below. The Time was also correct – David nominated between 2 and 4 October, using 3 October, which was the average of the 2nd and 4th. The actual top came in on 4 October. And the most impressive part of it all – it was all done twelve months in advance. So, what is the problem? The problem is that this forecast, this perfect forecast, sets an unrealistic expectation for us to aspire to.
When I first started studying the Ultimate Gann Course, I genuinely thought that if I wasn’t able to call exact tops and bottoms one year in advance, then I must be doing something wrong, or that I wasn’t good enough. Now, don’t get me wrong – I’m not saying that you shouldn’t try to be the best trader that you can be. At the Master Forecasting Congress, I showed the students a forecast – which I still stand by at the time of writing this article – that was over two years in advance. Over time, as you start to look at larger and larger cycles, you will start to see further and further ahead. The point I am making, however, is that a forecast doesn’t need to be made one year in advance. Open a chart of AAi-Spotv in ProfitSource, and go back to October 1989, and you’ll see that David’s short trade on the 1989 top would have made just as much money if he had only discovered the top on the actual day of the top. In other words, knowing about the turn twelve months in advance did not earn David any extra money on his short trade. You are paid for your trading, not for your forecast!
Think about why you got into trading. Did you get into trading to be a famous forecaster? Or did you get into trading to make money? I know why I came to trading – to make money! So first and foremost, your aim here is to make money. How do we make money? We make money by taking good trades. How do we take good trades? We take good swing trades in a strongly trending market. How do we identify a strongly trending market? We look for Classic Gann Setups.
Now, there are five components of a Classic Gann Setup. If you don’t remember what they are, you can look them up in Chapter 2 of the Ultimate Gann Course. I’m serious! I’m not going to tell you! You should know them by now! David’s 1989 top was a Classic Gann Setup. But it is just one example. Another example of a Classic Gann Setup is last month’s low on the Canadian Dollar (CD-Spotv in ProfitSource). Let’s take a look at it now.
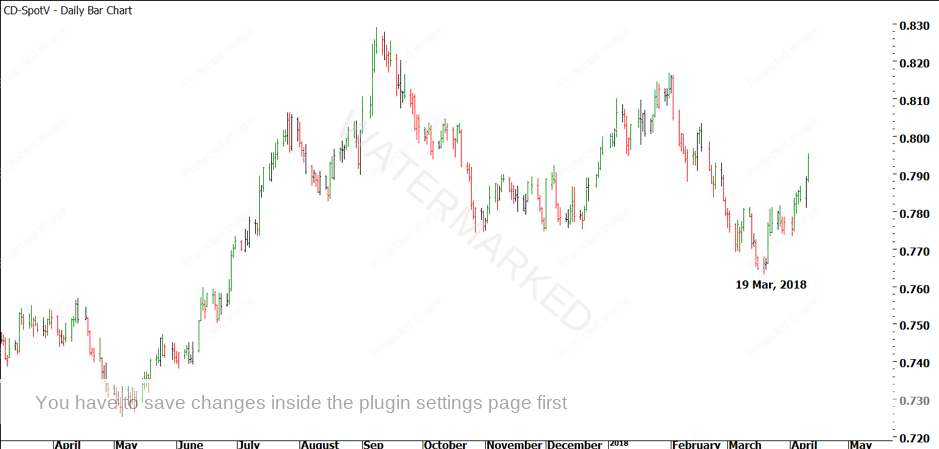
Chart 1 – The Canadian Dollar low on 19 March, 2018
The first thing to note from Chart 1 is that the low came in on 19 March, 2018. This is very close to the March Seasonal Date. Regardless of whether or not you had predicted a turning point around this time, Seasonal Dates are always a good place to watch for a change in trend in the market. The market won’t always turn on a Seasonal Date, but you should still be prepared for one.
The next things to note are the simple ‘Equal Time Frames’ that ran into the low, as shown in Chart 2 below.

Chart 2 – Equal Time Frames
Now, before you say ’49 days does not equal 47 days’, remember that David tells us to ‘wear the market like a loose garment’. And, I will also point out that if you extended the forecast out to 49 days, you ended up with 21 March, which would have been right on the Seasonal Date. So, it was a good place to begin watching!
Now, that is enough for a forecast! (Don’t worry, I will give you more though!). Equal Time Frames running into a Time by Degrees date is enough to at least make me want to do some more work, even though it is not enough to trade. So, what else can we do? We can look at Price. In Chart 3, you’ll see that Price was very close to 100%.
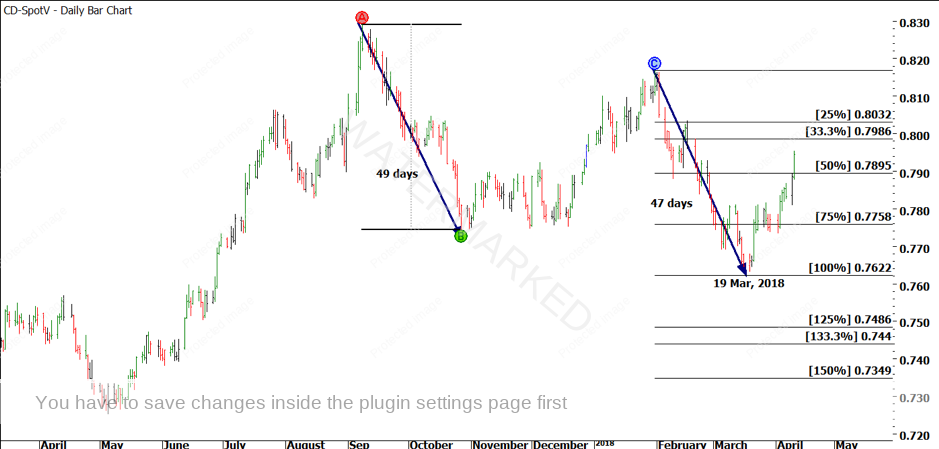
Chart 3 – Equal Time, Equal Price
Now, the evidence is starting to build for a low. We know that there is some Time and Price Pressure looming ahead, as seen in Chart 3. In Chart 4, this is confirmed by a simple Ranges Resistance Card, which you can create for yourself in ProfitSource.
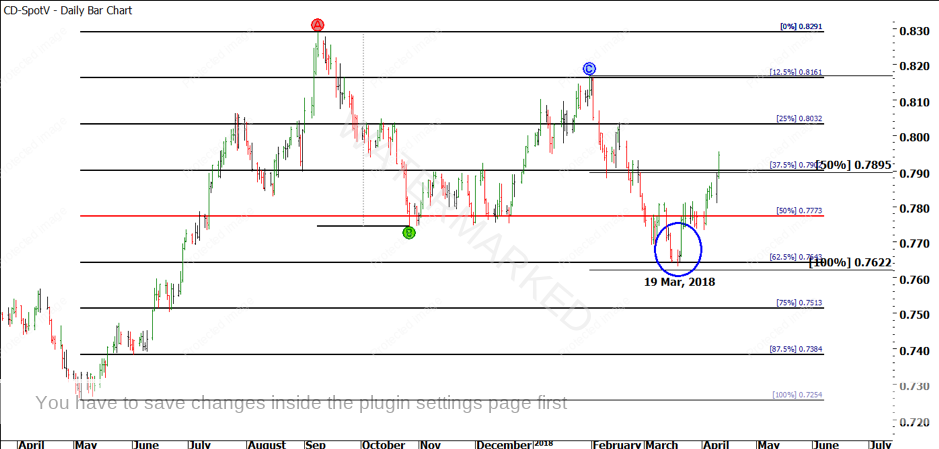
Chart 4 – Ranges Resistance Card
See how this forecast has been pieced together, one step at a time? It is quite simple and logical. Sure, there was no guarantee that the Canadian Dollar would make a low. However, there was significant Price Pressure, in the form of a major Range repeating into a Ranges Resistance Card, and there was significant Time Pressure with an Equal Time Frame lining up with a Time by Degrees date. That’s enough for me to watch the market around this point, and to take a swing trade if the opportunity presented itself. By the way, try running Gann Angles down from the September, 2017 top, to see if you can find any Squaring Time and Price evidence to support the low!
Now, this Classic Gann Setup could have been identified a few days or even weeks before it occurred, just from the information that I have provided. Sure, there were ways to identify it much earlier, perhaps even as far back as early 2016. Maybe even earlier! But as a trader, ask yourself – would you have been happy to call it on the day it happened? Judging by what has happened so far, which has been a First Range Out repeating more than 100% and looking likely to continue, I would be!
As an instructor, I am often asked for advice about learning different lessons or tackling different challenges when it comes to trading. For someone tackling the Ultimate Gann Course, the best advice I would give them would be to go and find and study as many Classic Gann Setups as possible. Look at your own market. Look at David’s markets. Look at any market you can think of! Then, study the big tops and bottoms. See how they came together. There is always harmony around the turns – all you need to do is spot it. You don’t need to spot it a year in advance. You don’t even really need to see it more than a day or two in advance. You just need to be able to spot it as it is occurring.
If you would like to get lots and lots of practice in finding, analysing and trading Classic Gann Setups, come and join us for this year’s one and only round of Ultimate Gann Course Coaching which commences in May. You’ll see examples on the currency markets that I will take you through, and together, we’ll break down your own markets, so that you can find, study and hopefully trade Classic Gann Setups on your own markets, too. Remember the 8 December, 2017 low on the Australian Dollar that I spoke about in last month’s article? Students in the 2017 Ultimate Gann Course Coaching group saw all of that analysis before the low came in. And that was just one example, on one market.
How many Classic Gann Setups are you watching at the moment? If the answer is ‘none’, then you need to go and look for some! David said that you will usually see three or four Classic Gann Setups on a market every year, so you might need to wait a few weeks, or even a few months, for the next one to show up. In the meantime, I’m going to talk about trading a Classic Gann Setup in my video article for this month, so make sure you click through and watch that too.
Be Prepared!
Mathew Barnes