The logical need for markets to move higher and lower is not one that sells papers or creates clicks so when markets do fall they gain lots of attention. Anybody who is surprised that markets fall and fall faster than they rise is a poor student of history. The two greatest questions we all ask when markets fall out of bed without warning is could we have foreseen this and how could we have benefited from this?
Well fortunately for those involved with Safety in the Market both those skills are available to study and learn, the former takes a lot of work, the latter can be something that we can harness earlier in our paths in trading as we are happy to be long as well as short in markets based on our analysis. Keeping it simple, what attracts people to short selling markets is when correct profits are possible and that the velocity of moves lower is nearly always greater than to the upside. So, the potential of profits in a short period of time can be enhanced.
The key philosophy is that you need to know what time frame you are trading or investing over. If you are 25 years old with shares in a super fund then this week will not likely raise too much concern, you can also be a trader who seeks to be in markets for a few days to a few weeks and sees this as a shorting opportunity. Ideally, you can be both, but it does require you to juggle the perspective hats, especially for newcomers, so make sure you have that straight first, then the door into profits in falling markets becomes easier.
Chart One shows the 2018 price action for the S&P 500 futures contract in the US. Although many still discuss the Dow Jones, the difference of 500 companies compared to 30 makes the S&P index more reflective of what we are seeing in the US markets.
This chart confirms the interest of participants as the price action declined to the 50% retracement level of the 2018 low and high. What has taken 6 months or more to drive higher has been undone in a week of trading.
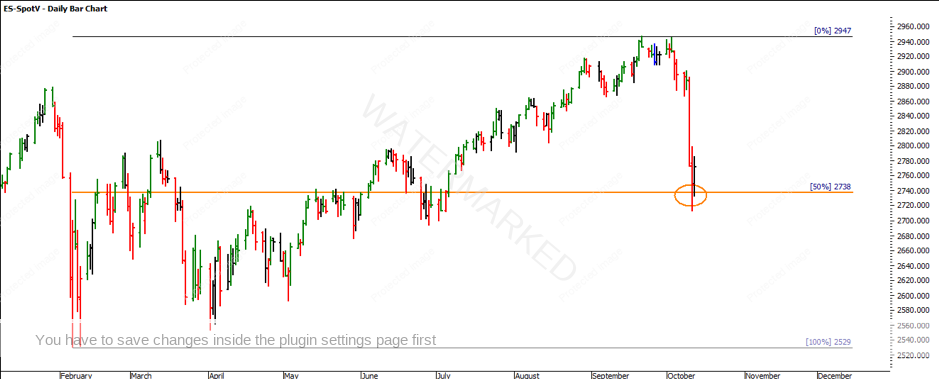
Chart One – Daily Bar Chart S&P500
The swing chart is even more telling with the benefit of hindsight as we see the largest daily downswing in many months on the 1-day chart followed by a first lower top. If you were watching for markets to decline, then this lower top signal provides the opportunity to trade a tidy risk and reward ration in excess of 3 to 1.
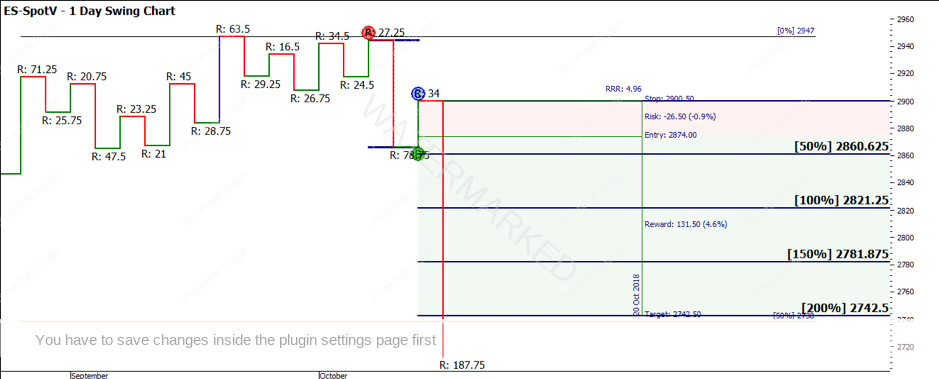
Chart Two – Daily Swing Chart S&P500
The main concern economically has been trade wars between the US and China and the rising interest rate environment in the US. These two factors have presented some alarm bells for markets and this week was when they came to fruition. We are more concerned with technical aspects of markets and there were clues as well in terms of setting up for short trades.
Let’s review the Australian markets because as we know, global equity markets will move in sync with each other for the most part. Chart Three shows the 2018 price action and again how the slow and steady work of markets rising can be undone very quickly. 2018 on the Australian market has not been so kind as the finance sector has been under pressure with the Royal Commission’s activities. I note with interest how the market closed at the 50% level around 6020 before sell-off off occurred. Again, a very relevant point but a different context. The market has fallen to 150% of the bearish swing range so far.
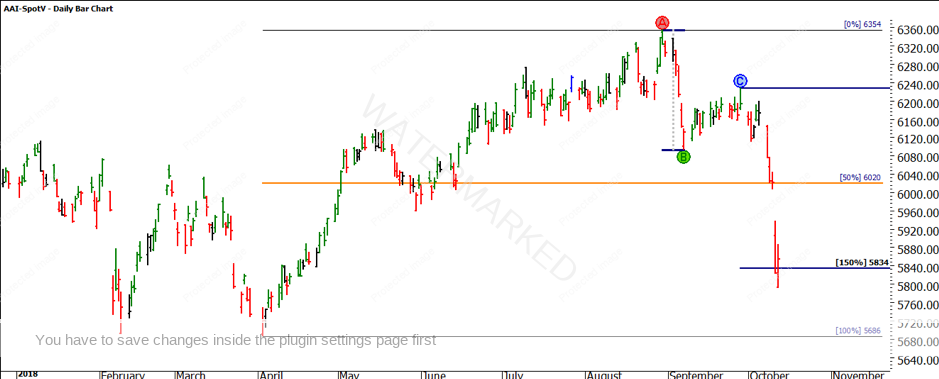
Chart Three – Daily Bar Chart SPI200
Chart Four uses the techniques acquired from the Active Trader Program to not only understand the mechanics of how to trade short on the market but also how to determine clusters for a potential change in trend. Using the repeating ranges lesson from David we can see the effect of three major ranges proving a cluster around the current high, especially the 75% of the level of the two larger ranges.
Once in play, you can then rely more heavily on your swing charts to assist with timing an entry and managing exit targets and trailing stops.
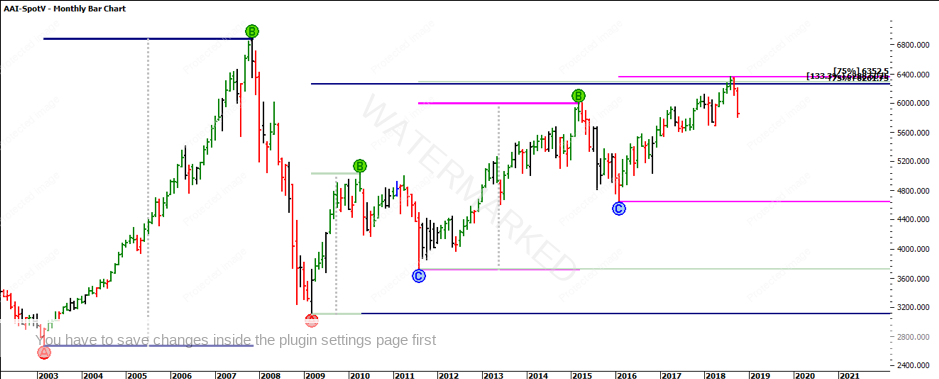
Chart Four – Monthly Bar Chart SPI200
As a trader in equity markets, the last few years has certainly been a bullish market with mainly long opportunities and that has meant keeping with the trend. Traders must be equally comfortable being short the market and having the skills to manage both style of trades will keep you in good stead.
Now is certainly a great time to dust off those skills and review your trading plan to decide under what conditions and with what signals you will be looking to short markets.
Good Trading
Aaron Lynch