Let’s talk stories. One of the questions I ask myself is what story has the market told me today? I like to think that every bar has a story, and that the bar provides insight into tomorrow’s story. The market is an ever-evolving battle of price action and reaction between the bulls and the bears.
With every push from the bulls comes a reaction from the bears and vice versa. David first introduces this concept to us in the Smarter Starter Pack, where we are calculating the swing ranges, observing whether they are expanding or contracting.
But, this isn’t the only way that David has us reading the market’s story, we also do it when we rate the strength of a trade. We use percentages of the AB range to anticipate Point C. If Point C retraces less than 50%, we have a strong market, if it retraces 50% it is a balanced market and if it retraces more than 50% it is a weak market. David also has us recording the subtle market smarts like the pitch of the trend and the temperature of the bars. We are essentially recording all of this information to understand who is the star of the story. Is it the bulls or the bears?
However, one market smart that is often overlooked is signal tops and bottoms. These bars provide a lot more insight into the markets story then we think. David comments that signal tops and bottoms are to be one of the most usable market smarts in your trading. In fact, he suggests that 80% of major tops and bottoms on both daily and weekly charts are recognizable by their action – and often if there is a major top or bottom coming into play, the signal top and bottom will be the first indication. Have a think about the last time you used signal tops and bottoms?
Let’s take a further look into the story tops and bottoms, on Commonwealth Bank of Australia (ASX:CBA). Yes, I called it story tops and bottoms, because every signal has a story attached. All this information can be studied further in Chapter 3 of the Ultimate Gann Course. We will focus on using market smarts in hindsight because David says our hindsight will become our foresight if we use it often enough.
The first chart below is an Open-Close Reversal. As you can see from the down bar, (the day prior to the signal top) it closed in the middle of its bar. Given the professionals know a change in trend was about to occur, this could have been profit taking, or it could be the first sign the bears were ready to push the market lower. Either way, on the day of the signal top the market was able to gap higher, breaking the previous day’s high and making a new daily high. Once the top was in place, the bears gained control and were able to drive the price down to test the previous days close. This would have been a stronger signal given the close was lower than the previous days close. The proceeding day showed a big push from the bears, gapping on its open – but in this instance, the bulls drove the price up all day and closed on its high. But was this the end or the start of the distribution?
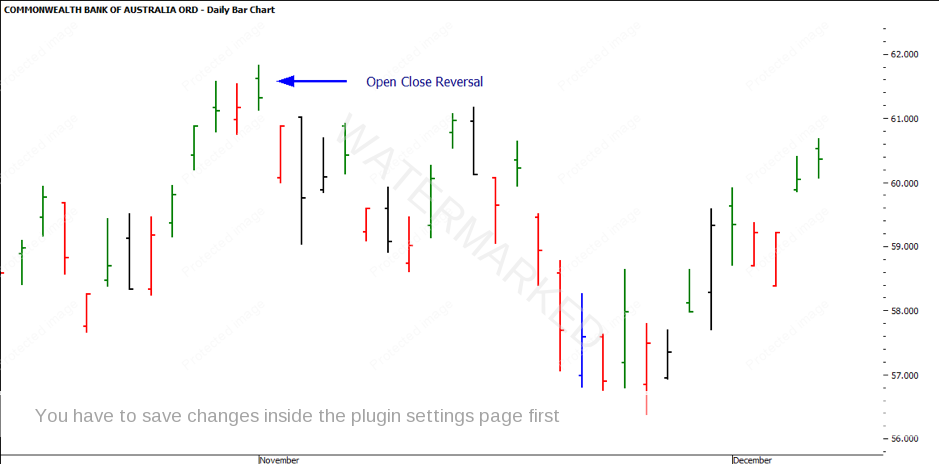
Open Close Reversal Example
A Key Reversal is a stronger pattern than the open-close reversal day. It is very similar also, as the market opens below yesterdays close and is strong enough to break the previous high but closes on its low and below yesterdays close. Again, it is a battle between the bulls and bears.
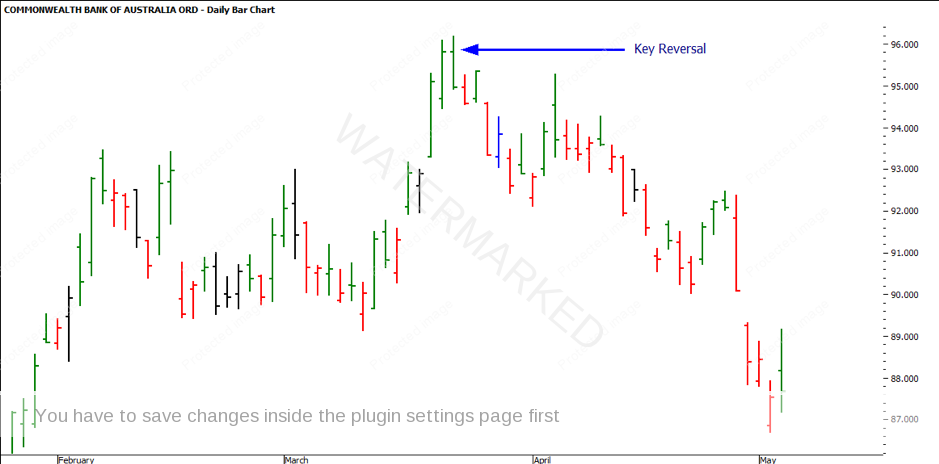
Key Reversal Example
As the story of the Outside Reversal goes, in the chart below, you can see the market gapped higher on its open, showing a rush of buying from the bulls. This is a common trait around a high. I wouldn’t be surprised if on that particular date some great news came out. However, as the day evolved, the bears were able to drive the price lower, not only breaking the previous day’s close but also breaking the low and closing the gap in the market.
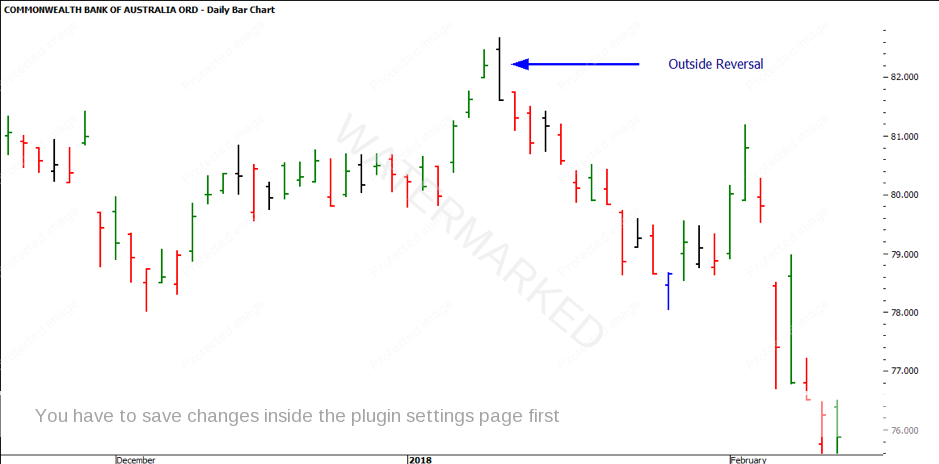
Outside Reversal Example
An Island Reversal always seems to remind me of the bulls and bears taking a short holiday on an island. This is created when a gap separates the price action from the day before and the day after. The pattern can only be confirmed after the event, but usually resulting in a big move. The more days that the bulls and bears spend on the island, the stronger the signal usually is. It is well worth a deeper studying into island reversal days, particularly the volume and pattern.

Island Reversal Example
I often refer to the Hook Reversal with David’s comment about ‘rope a dope’. It catches your attention particularly when a perfect open/ close bar is created. The volume is the key indicator here. Generally, the proceeding day with an inside day gives it away that a potential reversal is to come. The closes should be closing in similar areas but don’t be fooled. It is important to not trade this, or any signal bar, as a stand-alone indicator.
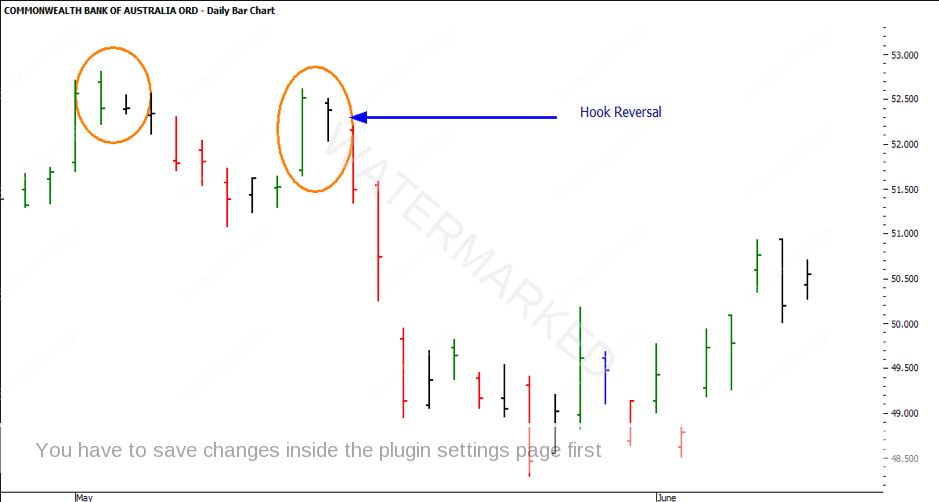
Hook Reversal Example
Lastly, the Snap Back Reversal is similar to the hook reversal, however, the second-day range can be higher or lower than the first day’s bar range. Again, the bulls drive the price up, but the bears end up mirroring their exact price range. It is important to watch volume on these days also.
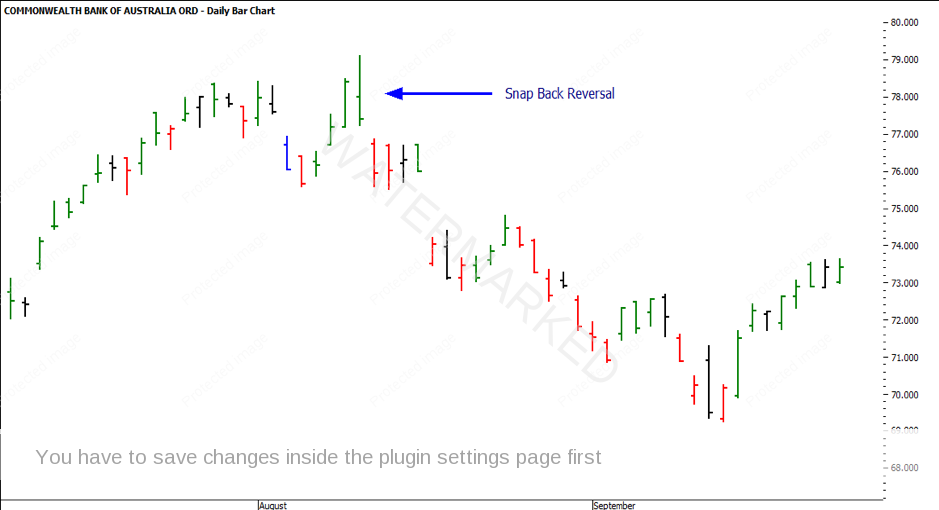
Snap Back Reversal
I have found that the combination of a reversal day with a double top or bottom pattern makes a high probability outcome. It doesn’t always need to be a pressure date, however, if you have this lining up also, the probability of the story playing out as intended is more likely.
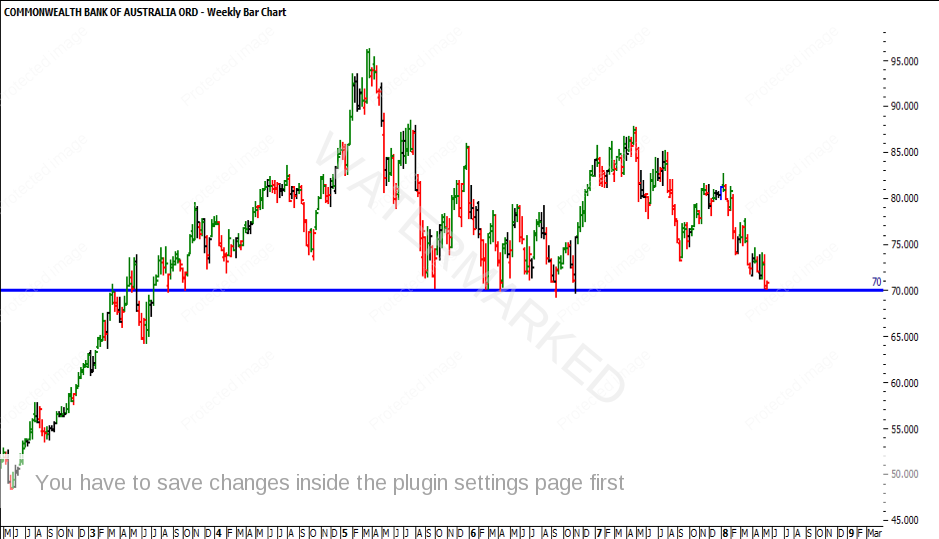
Let’s take our story time to the most current market action on Commonwealth Bank of Australia (ASX:CBA). As you can see the $70 level has been showing support since September 2015. A simple horizontal line on the chart at $70, makes it obvious enough to see that the market has come down here for the sixth time. Let’s use some market smarts to take a deeper look into what underlying story is being told.
[table id=3 /]
The bar lows have an average price of $69.82 and an average volume of around $4.35M. From the information presented in the table we can take a few things away. There were three lows that occurred in September 2015, September 2016 and September 2017, so September might be an area to watch again this year.
The weekly bar close is another interesting area. You’ll notice that every time that the market made it’s low on the day, it was able to close the week higher and above the average price of $69.82, or even above the psychological level of $70.
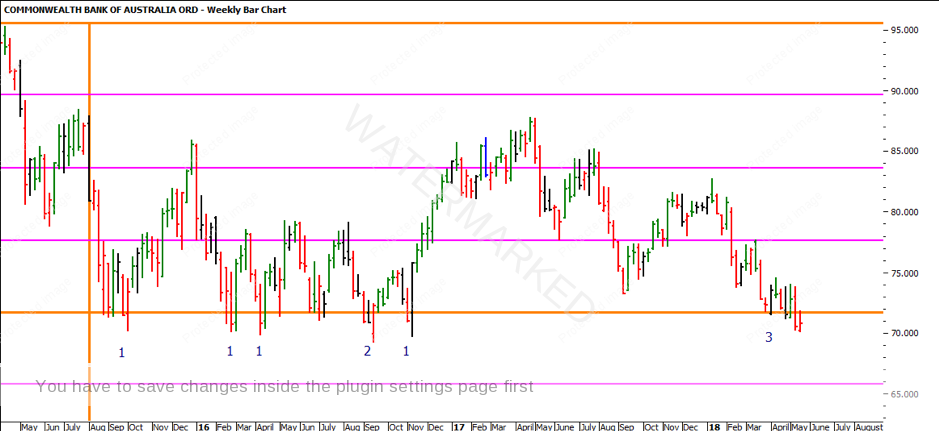
If you refer to the chart below, you’ll see I have a Lows Resistance Card on the chart from the 2009 GFC Low at $23.90. I have noted how many times the market was able to close below the 100% multiple (orange line). It is the current price action on CBA that has been able to close below this multiple three 3 times now. This is going to play a crucial role in determining whether the market trend has been won by the bulls or the bears.
Part 2: Your Story
If I turn our attention to another type of story now; it is not always the story that the market is telling us. Often, we all get caught up in our stories and think we are our stories. Those stories take on a life of their own. More often than not that life sometimes isn’t the one we want.
Think about the story you’re living right now. Who wrote it? Did you consciously decide to create the reality you’re living now, or was it mainly shaped by your parents, friends, spouse, school, or the media? If you don’t like the story your living, then change the perception. Envision how you’d write the next chapter of your story. Better yet, actually sit down and write it. Focus your perception on creating a new reality, one where you are in charge of the story. Take back the job as screenwriter and director, and stop just being an actor.
Everything begins with a decision – decide now to be in charge of your own perception of reality. Because if you don’t, there are plenty of folks whose sole purpose in life is to craft that perception for you. Do you trust them to have your best interests in mind…?
Look at areas of your life. If you often find yourself quitting before you get the results you want, you will quit trading too. If you find yourself sticking with it and eventually getting there with persistence, that is what it will take to make you a trader: persistence. If in your life you are impatient, you will run out of patience trading. If things fall into place and you happen to be at the right place at the right time, your trading will follow the same pattern: you will happen to pick the right trades at the right time.
None of this is good luck, bad luck or coincidence. It is your mind, your psyche playing out your past patterns. Tony Robbins says: “Winners find a way and losers find a reason.” Think about that. Winners win because they find a way around the challenges they encounter. Losers lose because they give up and find a reason for their giving up.
If your trading and the system you study says you must use stops and you don’t, what needs to change? You and your thinking or the system (or the market, the broker, the stock …)? If your system says take this trade and you procrastinate, what needs to change? If you are in a trade and get impatient and pull out, only to see the trade make tons of money, what needs to change?
Change your thoughts. Think differently. If success has eluded you in the past, find, copy and emulate a winner. Find out their ways and their thinking and follow it.
It’s Your Perception
Robert Steer