
Crude Volatility
Support and resistance are a standard concept in technical analysis, as is sideways and uncertain markets followed by high levels of volatility. Crude Oil has been an extreme focal point for me for over 20 years now. I have lived through the lens of peak oil and extreme pessimism around energy security to what is a new cycle of renewable energy and battery storage for the masses. These fundamental changes have seen the long trending style of move be replaced by shorter and more violent swings.
This means we must adjust our style to ensure we adapt, or we are likely forced to find new markets. Either option is acceptable, but its critical some structure moves into our process as opposed to jumping at shadows.
The long-term road maps signalled to me some more sideways and volatile moves through 2024/2025, and we may be potentially coming to see this resolve. Trends have been hard to develop over more than a few weeks, and intraday volatility has meant setting and holding positions has become more challenging.
Looking at the most recent low on July 2nd, 2026, this proved to be a great place to get long, the first higher swing bottom that formed was the “simplest” entry technique with risk management built in. The challenge for you (and me) was that a pure price based (cluster) related entry was harder to come by. This setup required my understanding of time to allow for my rules to trigger and execution to occur.
Chart 1 below uses a Highs Resistance Card of all-time high (with the orange line being 50%). The actual low came in at $67.04.
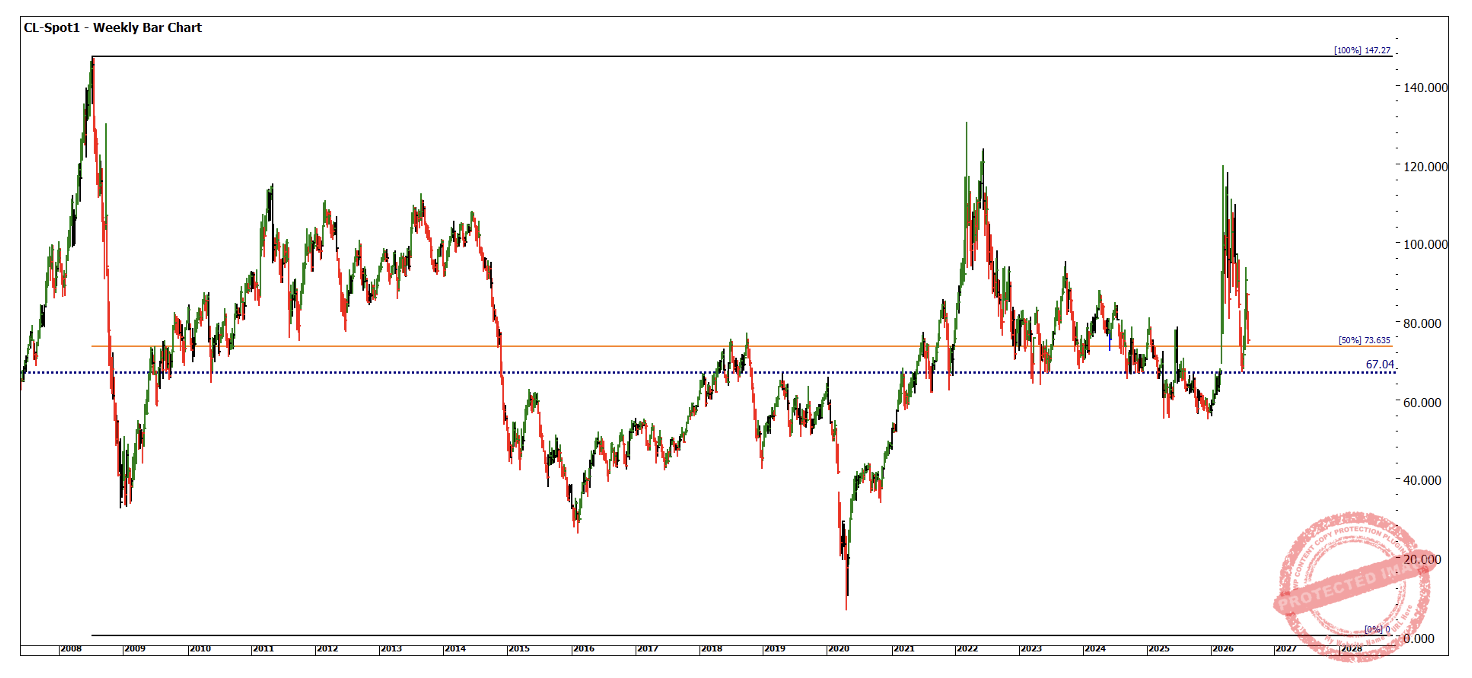
Chart 1 – Weekly Bar Chart CL-Spot1
Charts 2,3, and 4 all use different reference points for the application of a Range’s Resistance Card. All provide relevant information, but none really clustered around the low to act on that information alone.
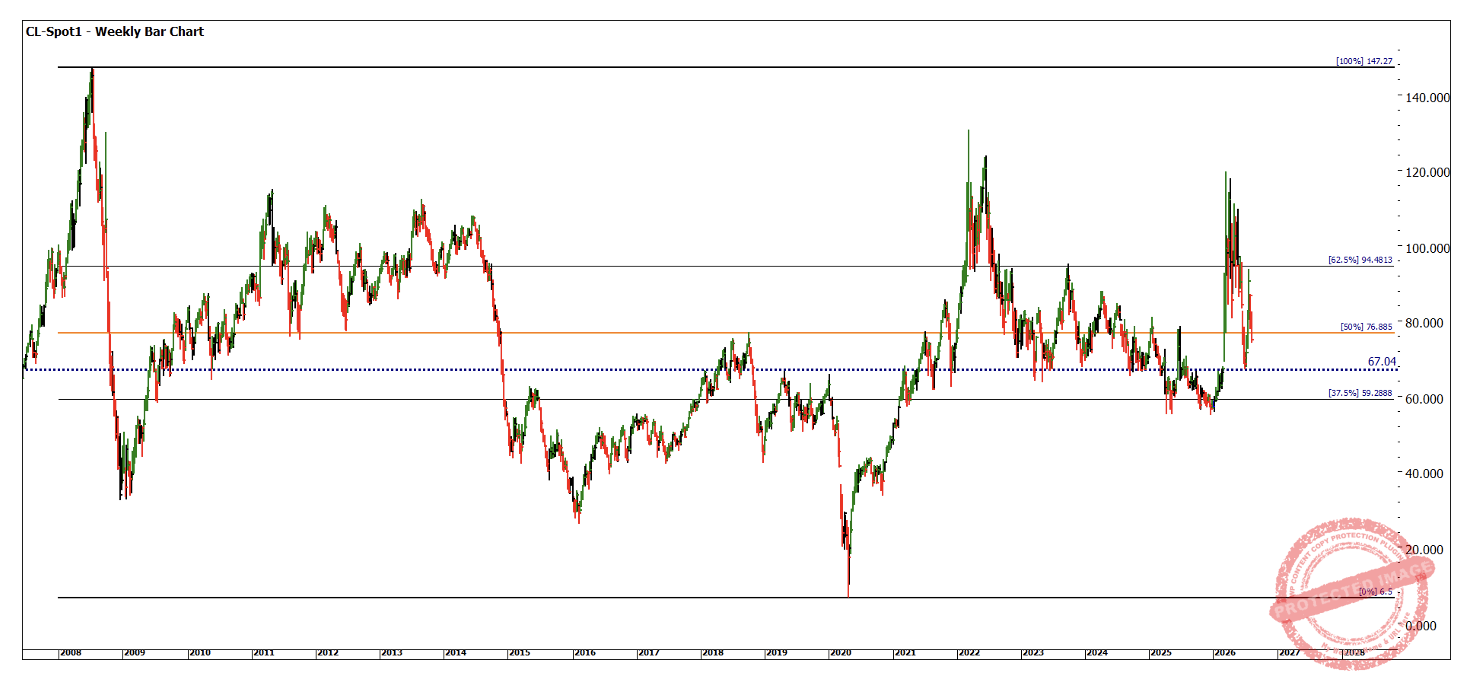
Chart 2 – Weekly Bar Chart CL-Spot1
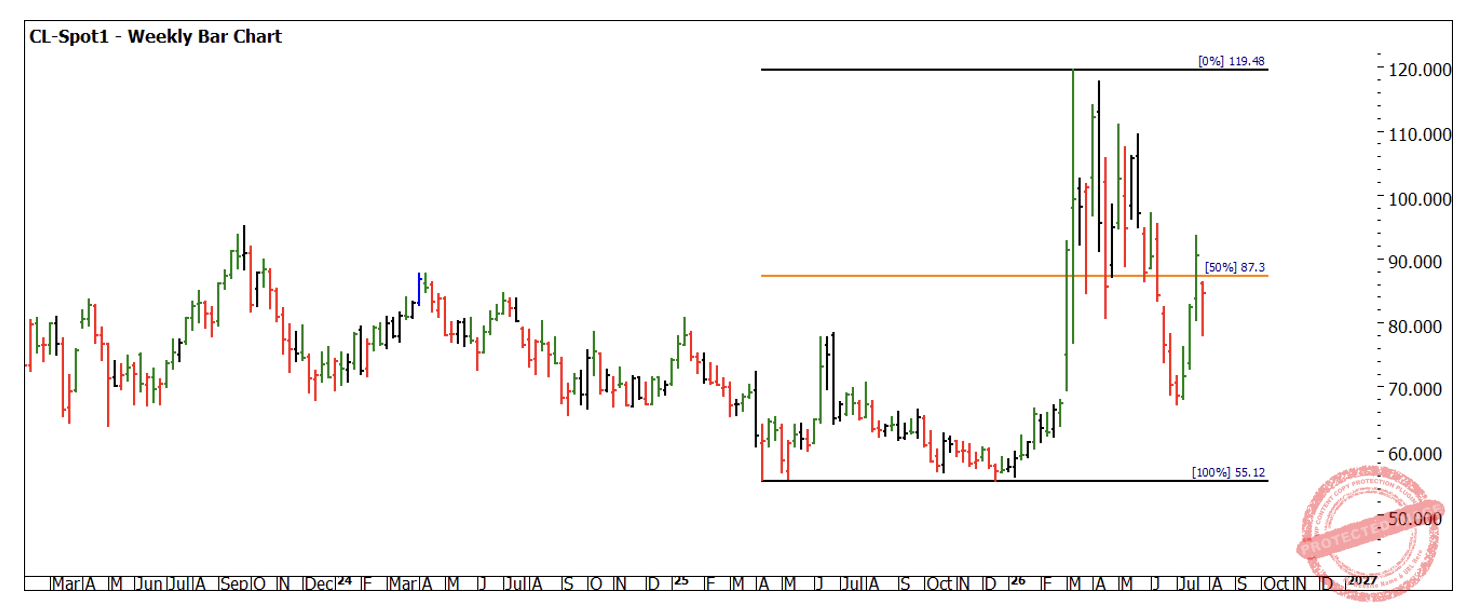
Chart 3 – Weekly Bar Chart CL-Spot1
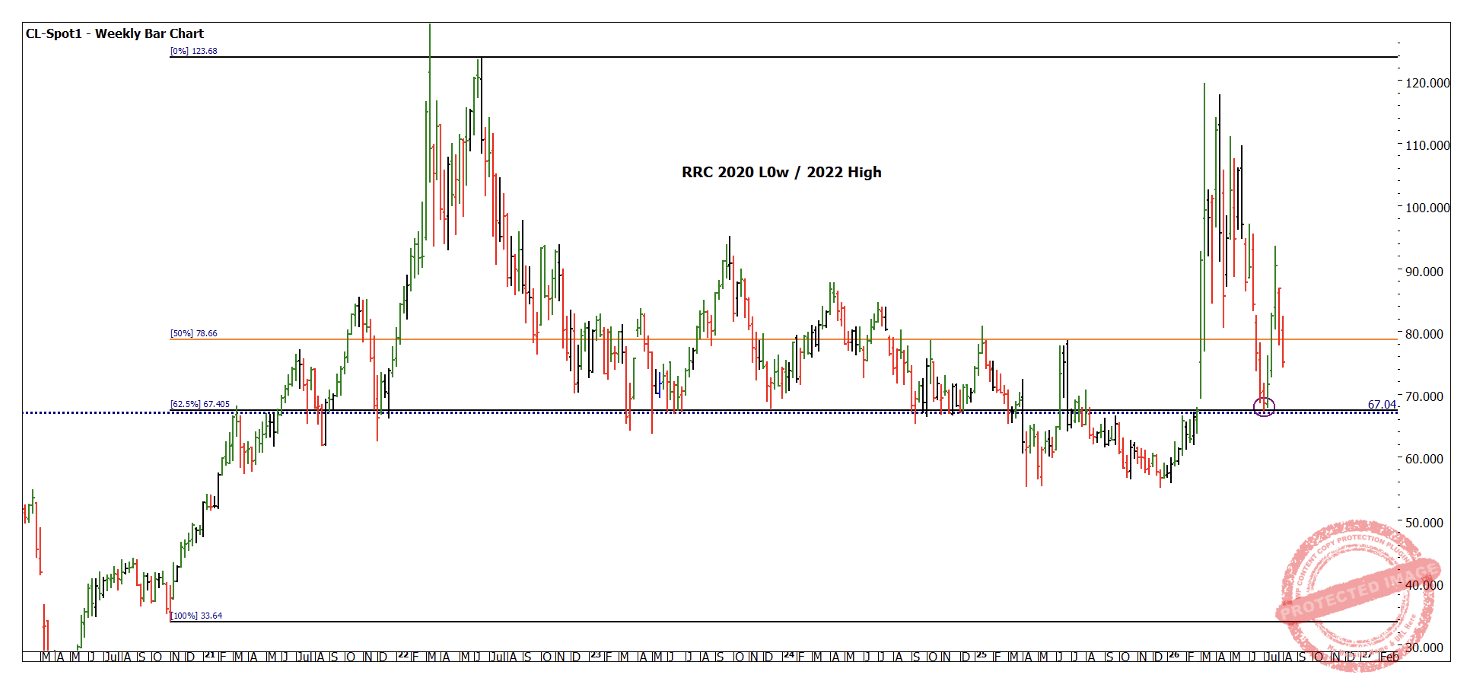
Chart 4 – Weekly Bar Chart CL-Spot1
The next charts from 5 to 12 are all a variation of the Lows Resistance Card work from the Number One Trading Plan. All examples use the same principles, to establish a price cluster. I appreciate it is information overload, I suggest you recreate them all, then sit back and see what they are telling you.
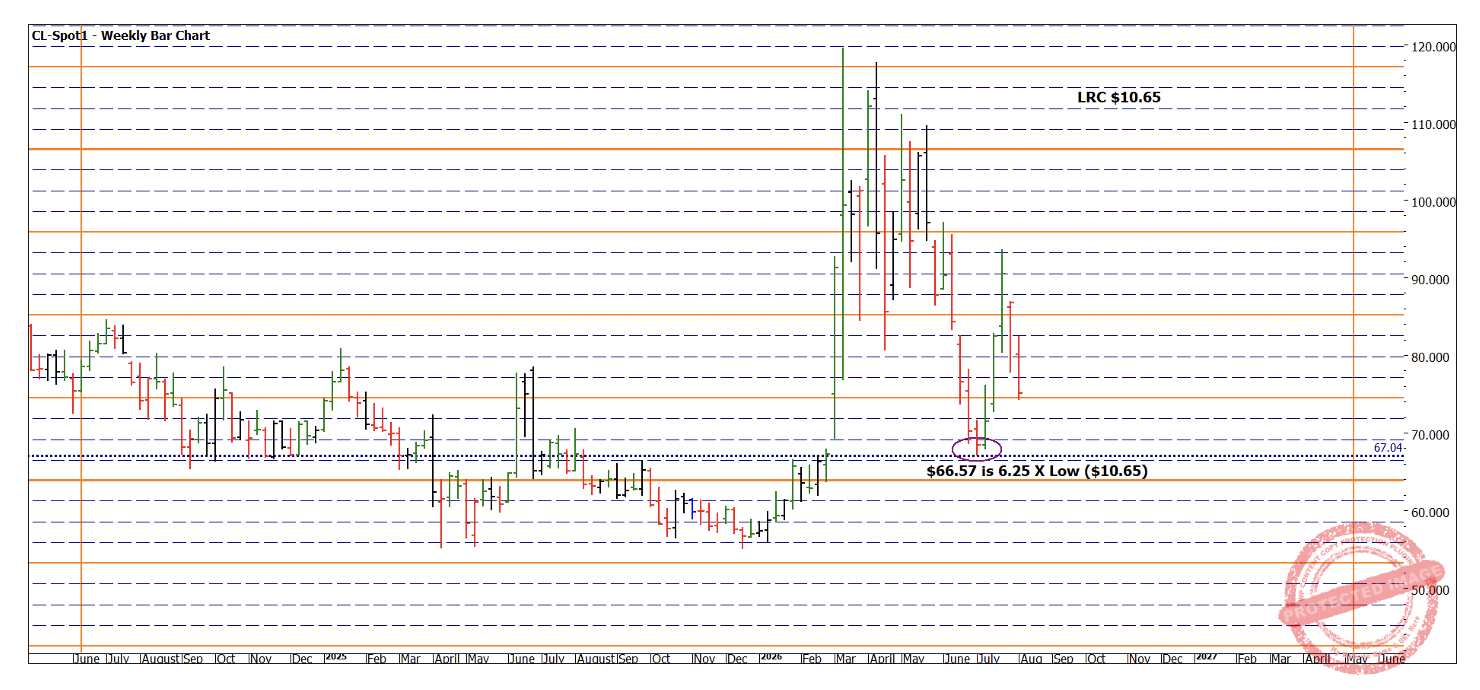
Chart 5 – Weekly Bar Chart CL-Spot1 $10.65 LRC
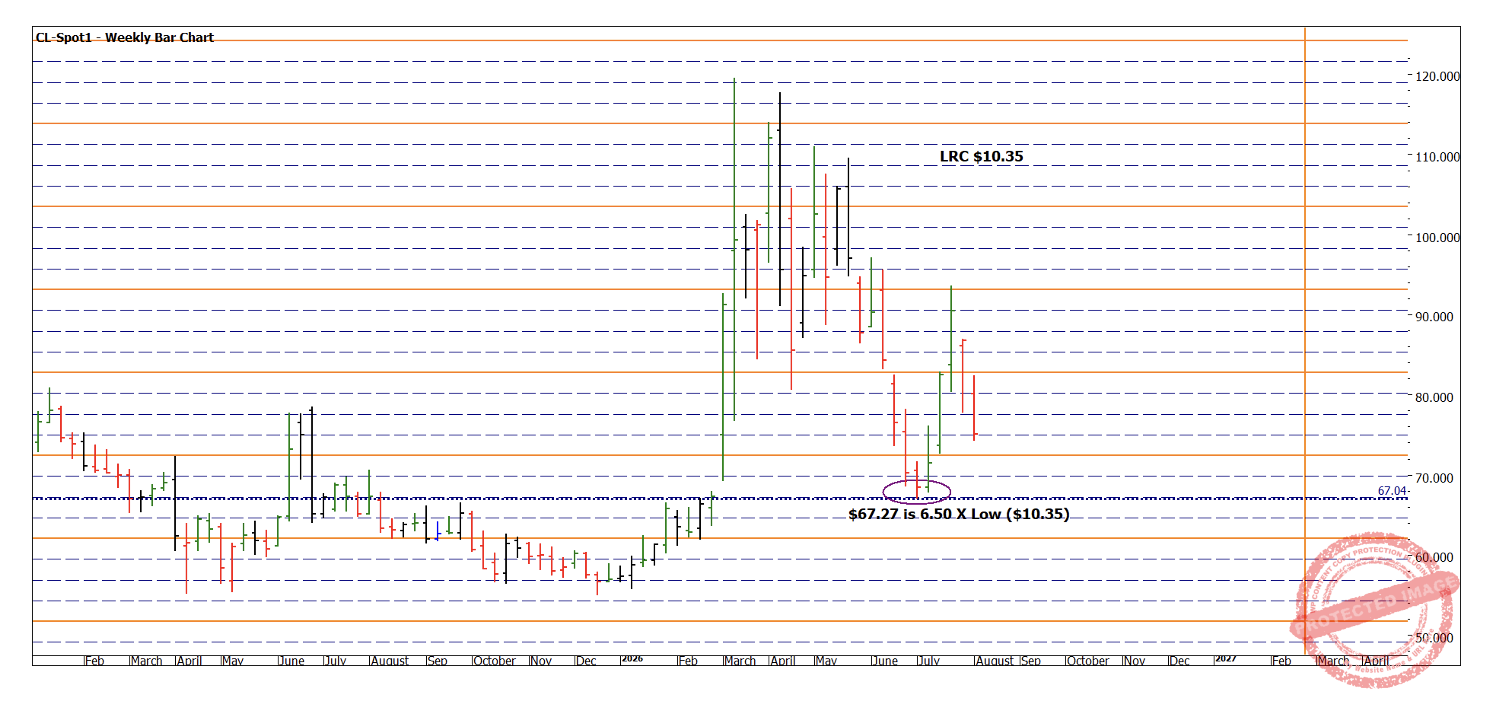
Chart 6 – Weekly Bar Chart CL-Spot1 $10.35 LRC
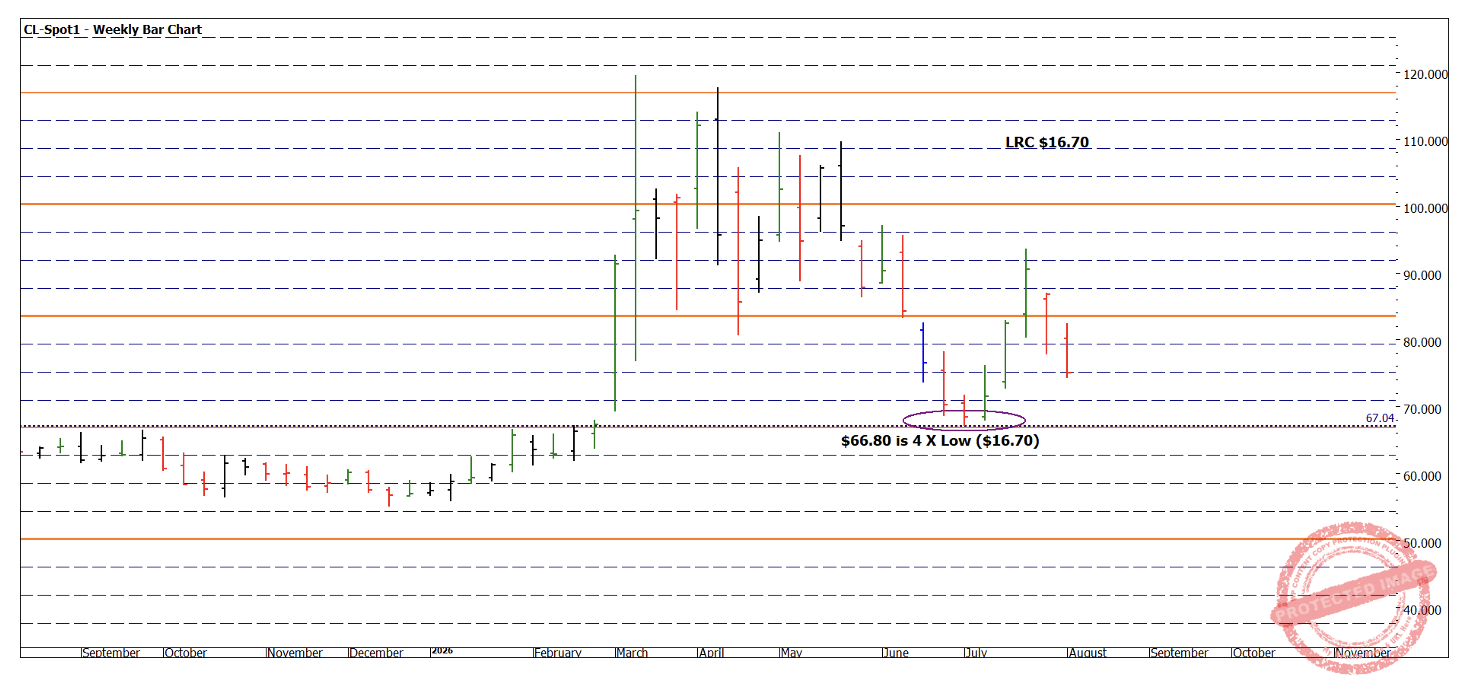
Chart 7 – Weekly Bar Chart CL-Spot1$16.70 LRC
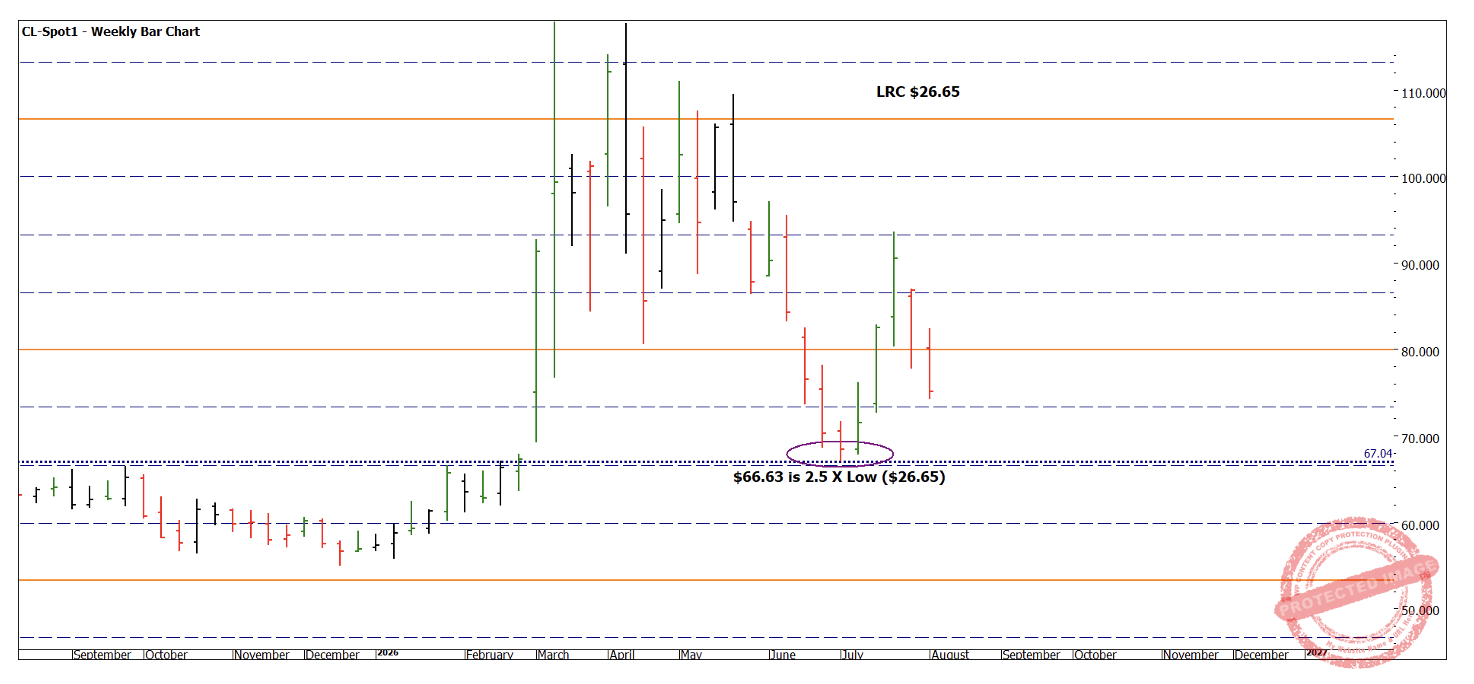
Chart 8 – Weekly Bar Chart CL-Spot1 $26.65 LRC
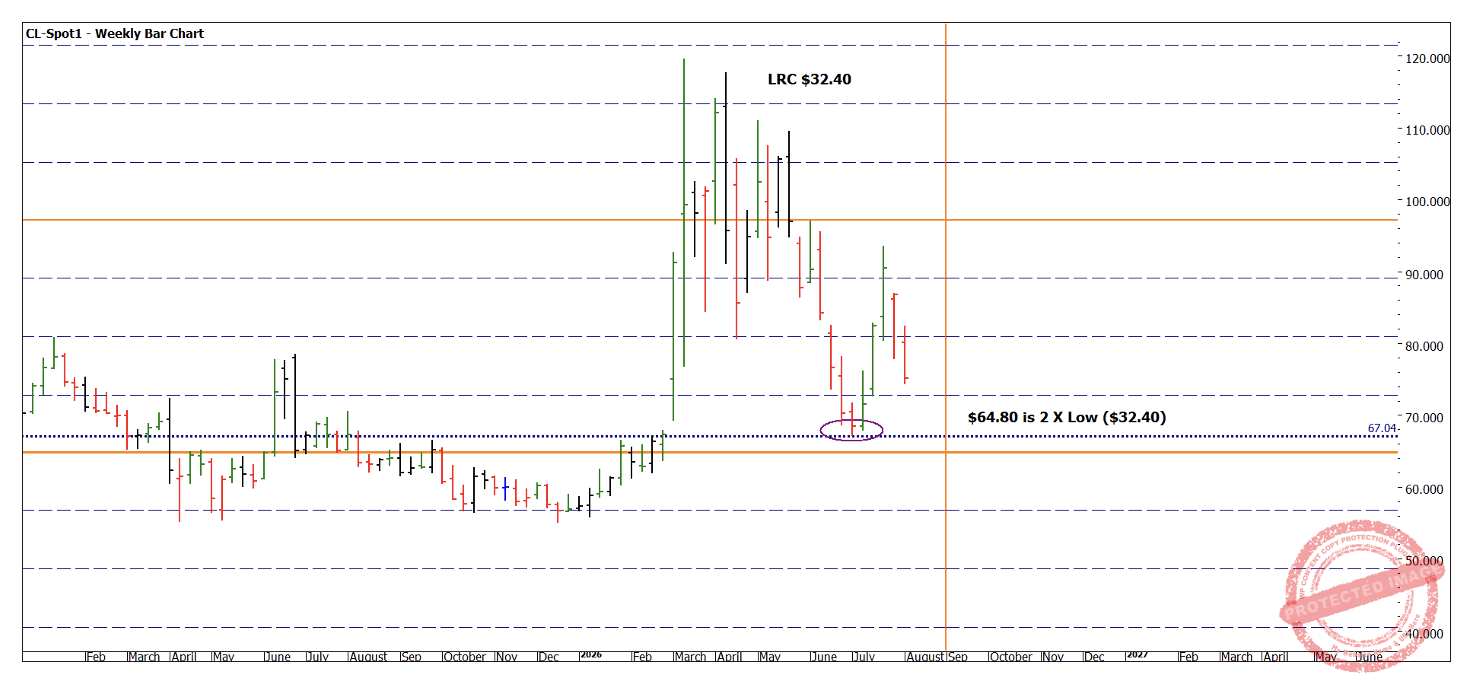
Chart 9 – Weekly Bar Chart CL-Spot1 $32.40 LRC
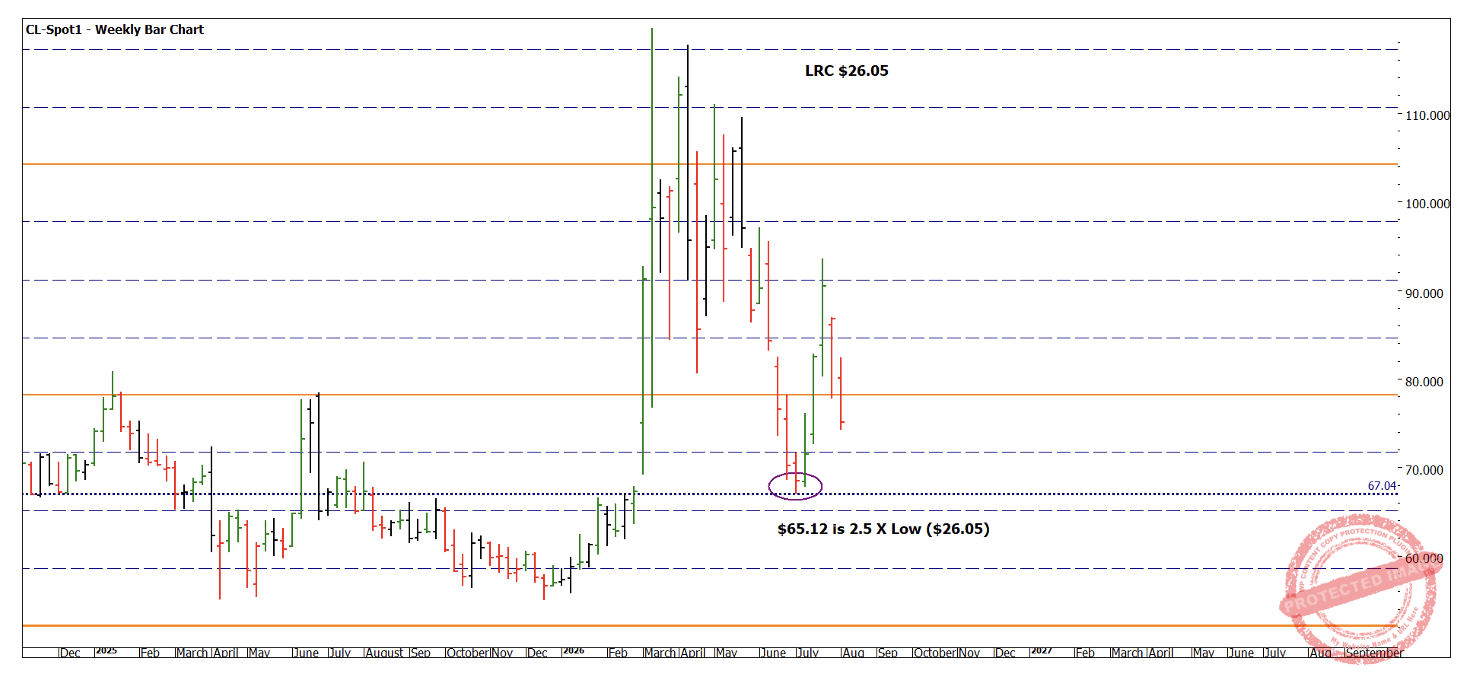
Chart 10 – Weekly Bar Chart CL-Spot1 $26.05 LRC
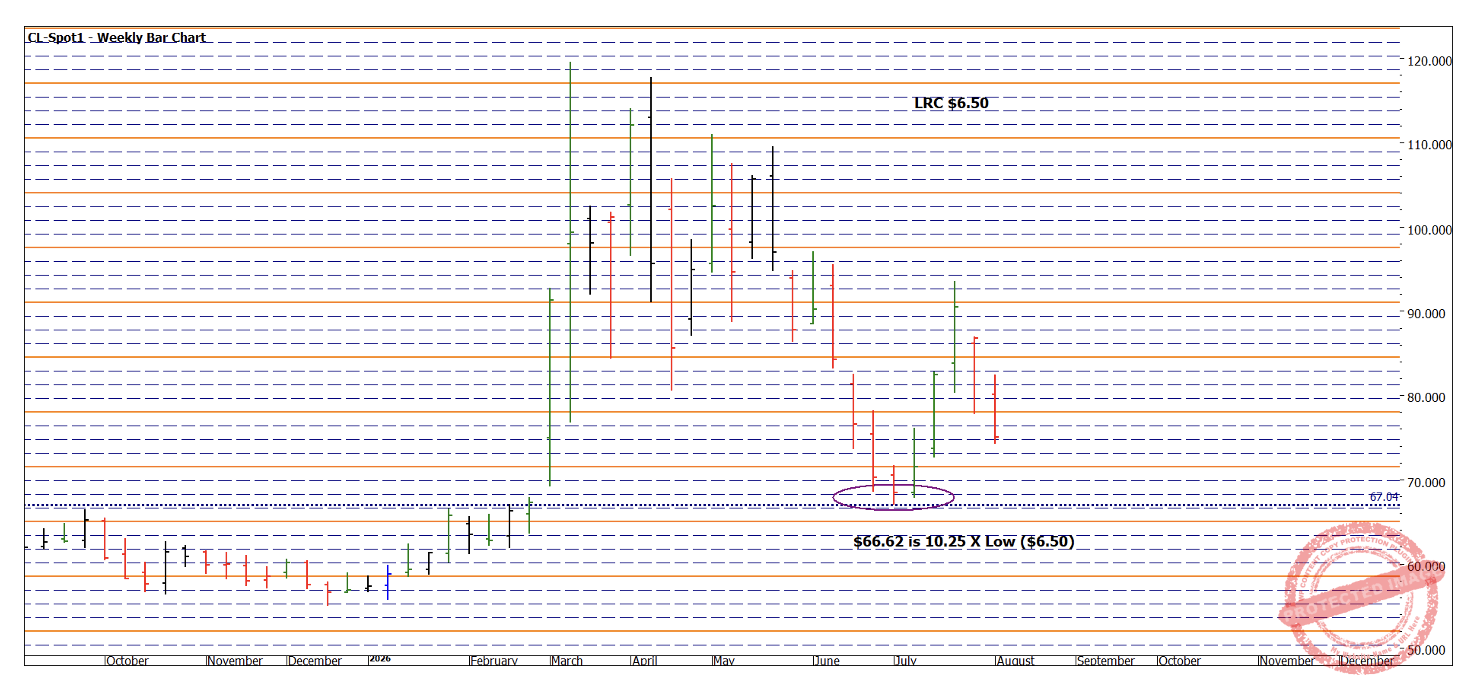
Chart 11 – Weekly Bar Chart CL-Spot1 $6.50 LRC
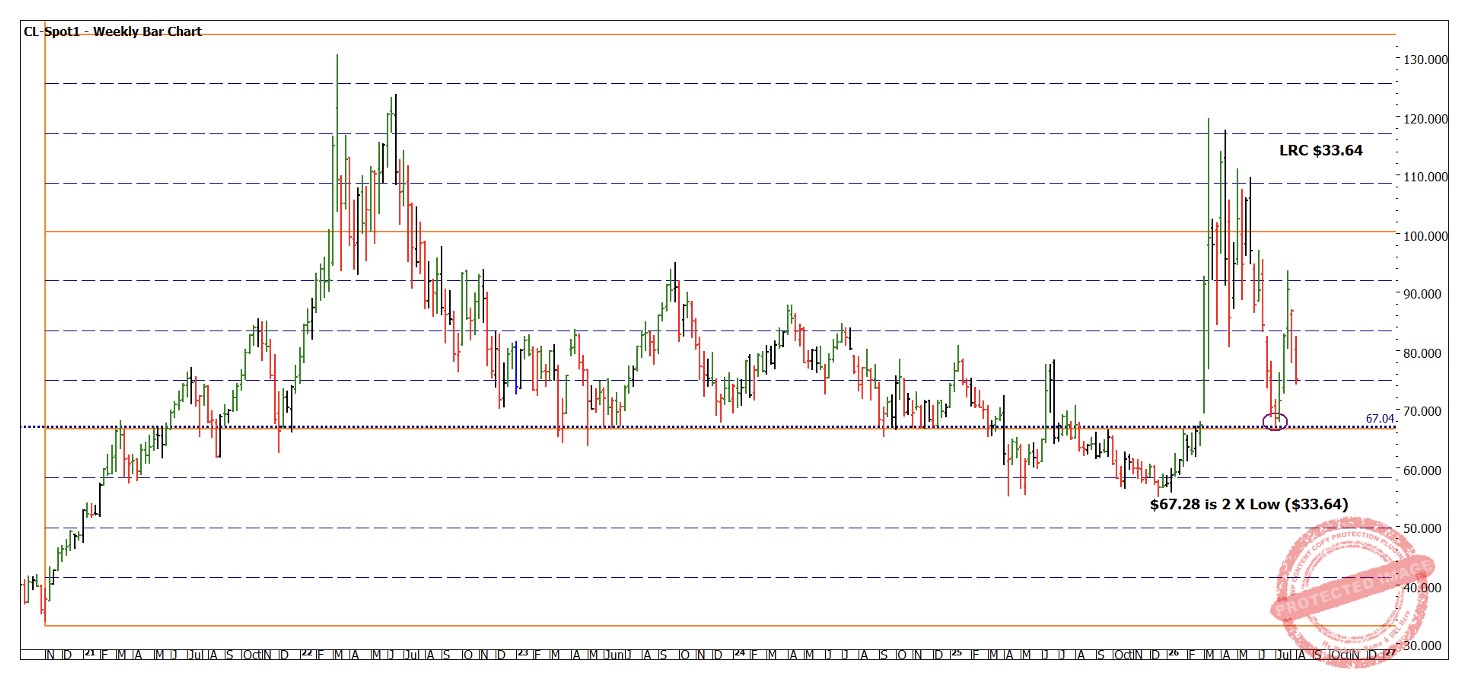
Chart 12 – Weekly Bar Chart CL-Spot1 $33.64 LRC
This analysis was insightful but potentially not enough to assist us with the right signals to execute the market. If we can add the dimension of time to the equation, we can add additional concepts to add confirmation to our process. I have studied Crude prices across the 43 years we have price data available. Early July has proven to be a seasonally better than average time to see a change in trend. Add a final chart to your melting pot and I have measured some ranges in time. The outcome shows repetition (as we subscribe to history repeating). I leave this for your consideration.
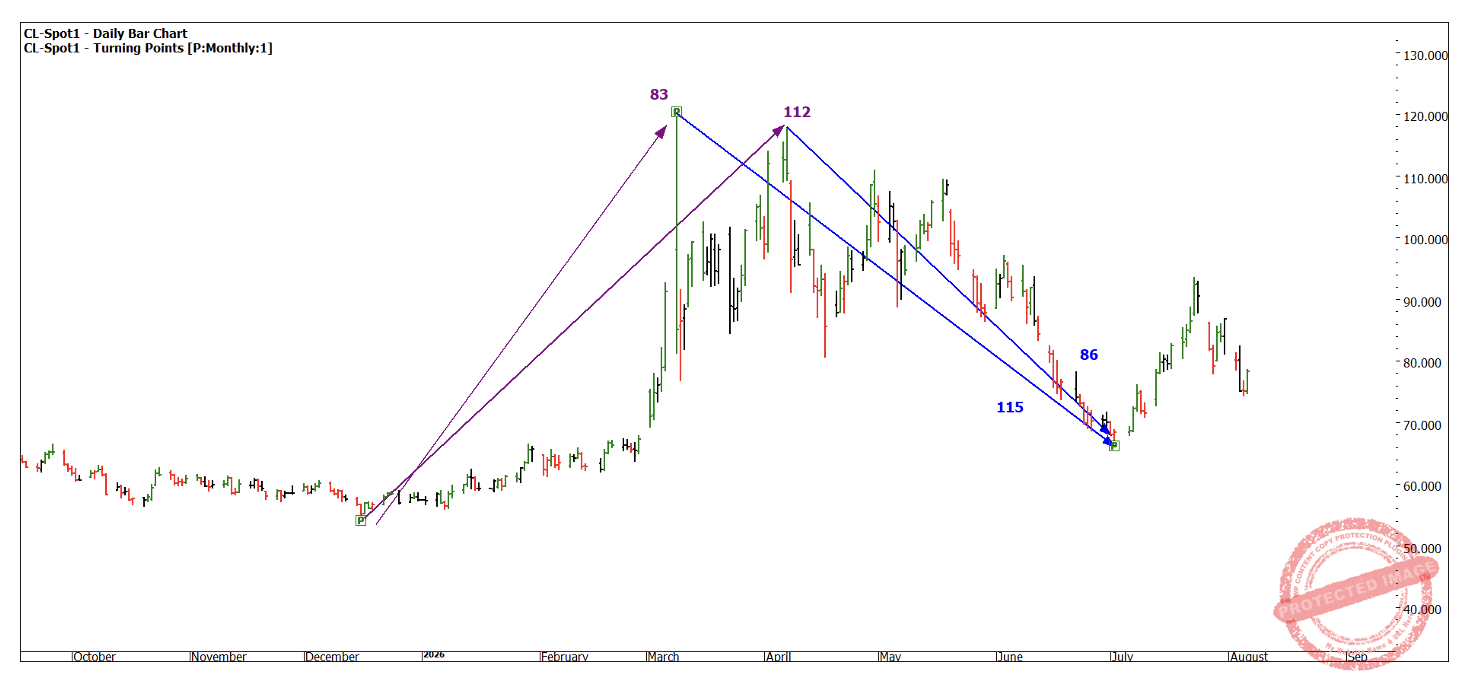
Chart 13 – Daily Bar Chart CL-Spot1
Good Trading
Aaron Lynch