
Types of Chart
Back to the commodities space this month and we look to a recent case study from the Corn futures market. Before that however, in ProfitSource, there are a few different chart types for each of the main commodities, so let’s summarise those available for Corn.
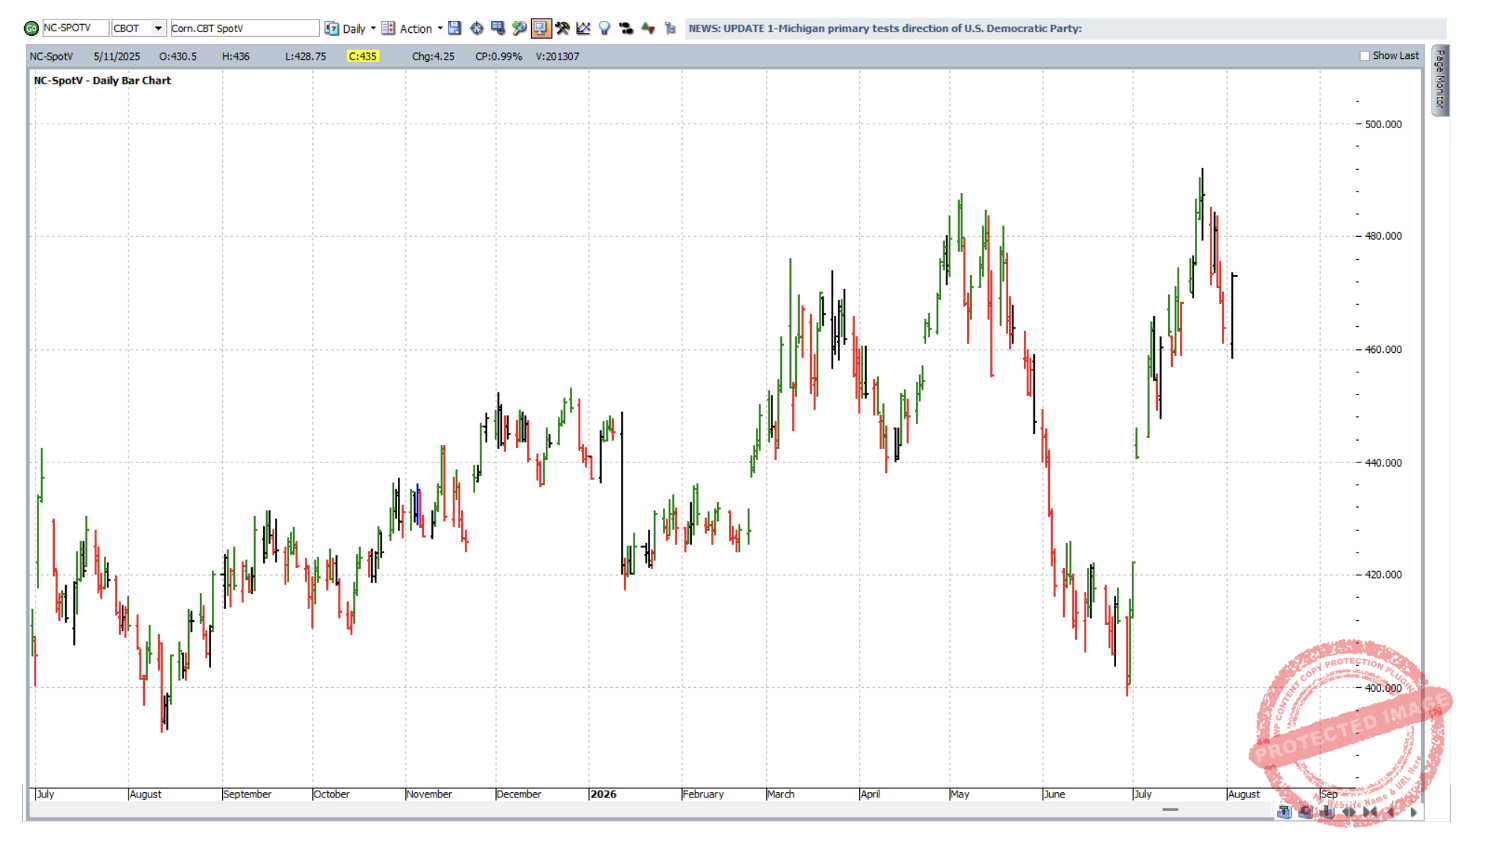
First of all, we have the continuous “SpotV chart”, symbol NC-SpotV and this draws data from the Corn contract trading with the highest volume on the given trading day. It is shown below with approximately 12 months’ worth of the latest data.
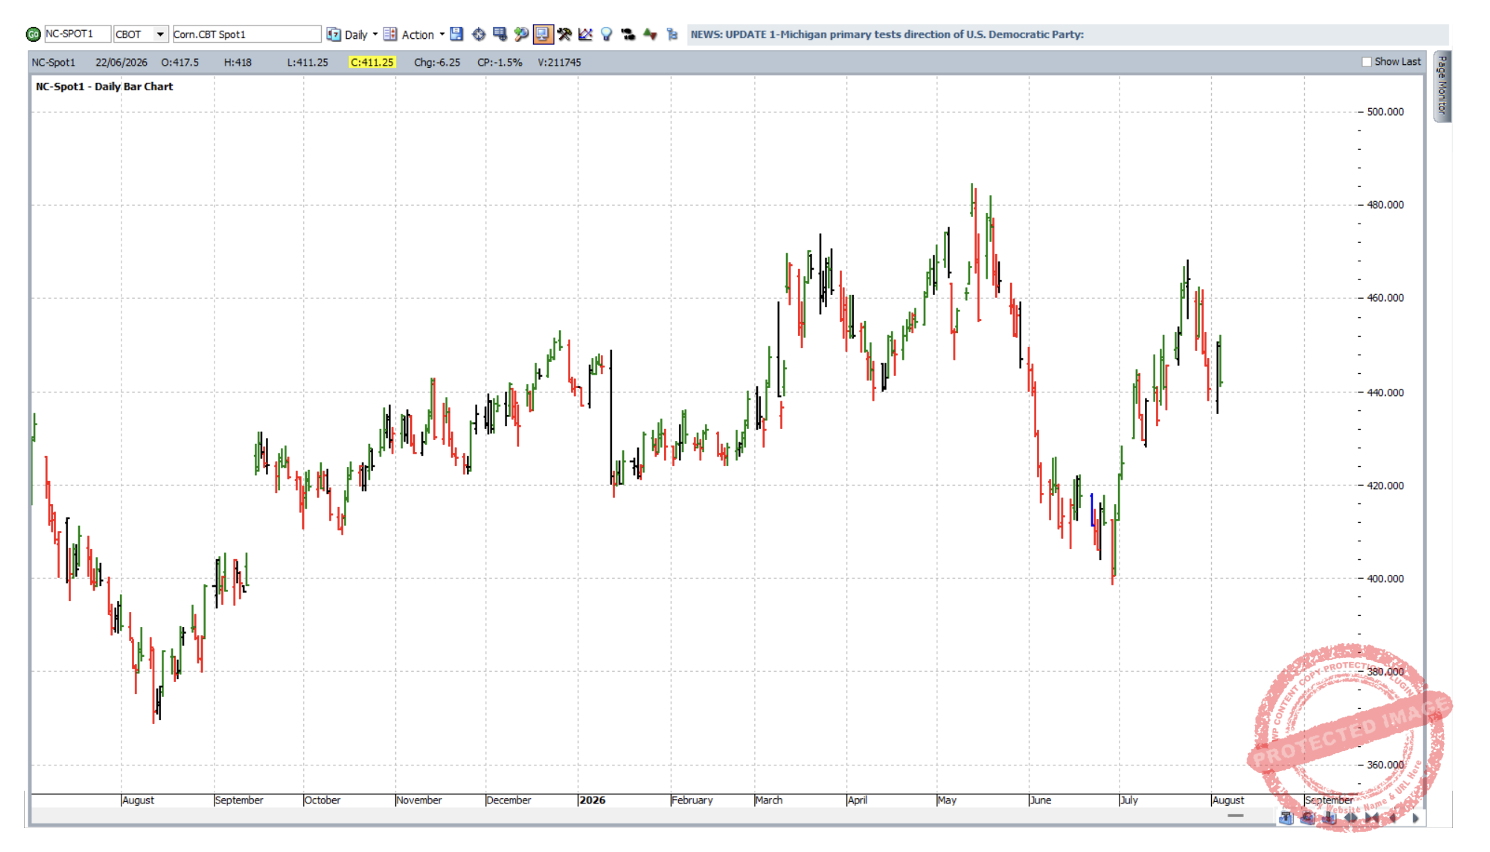
Then we have the continuous “Spot1 chart”, symbol NC-Spot1 which draws data from each successive Corn contract until its expiry.
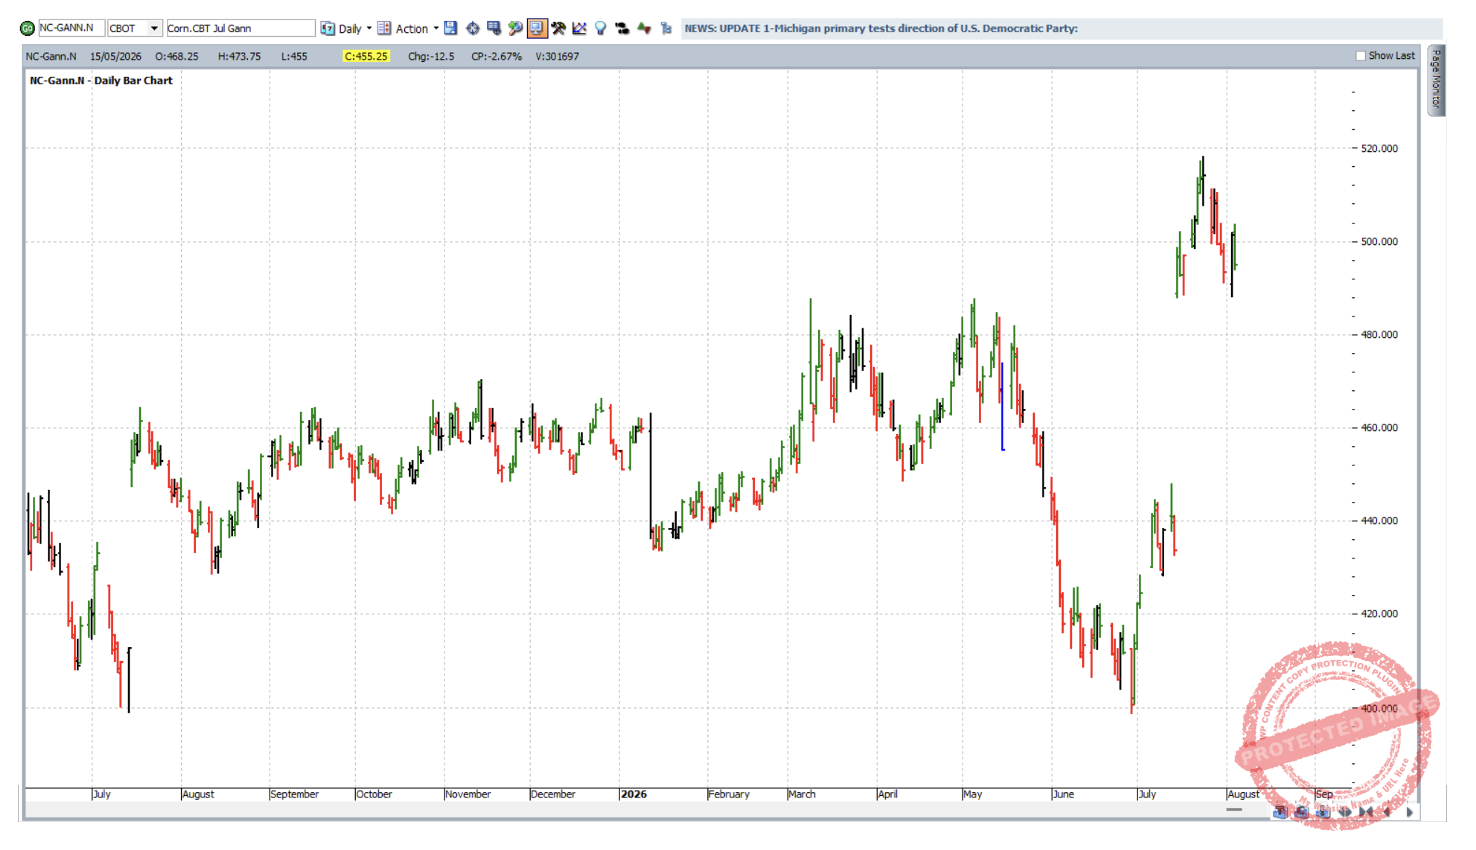
Then there are the charts which are dedicated to a particular contract month from any given year. Let’s take for instance the July contract for Corn. This contract (as with every other contract month) has two types of chart. First of all, there is the continuous “Gann chart” for July Corn, symbol NC-Gann.N and this draws data from the July contract of one year to the July contract of the next year and so on, each contract contributing data to the chart until its expiry, with the next July contract in line taking over.
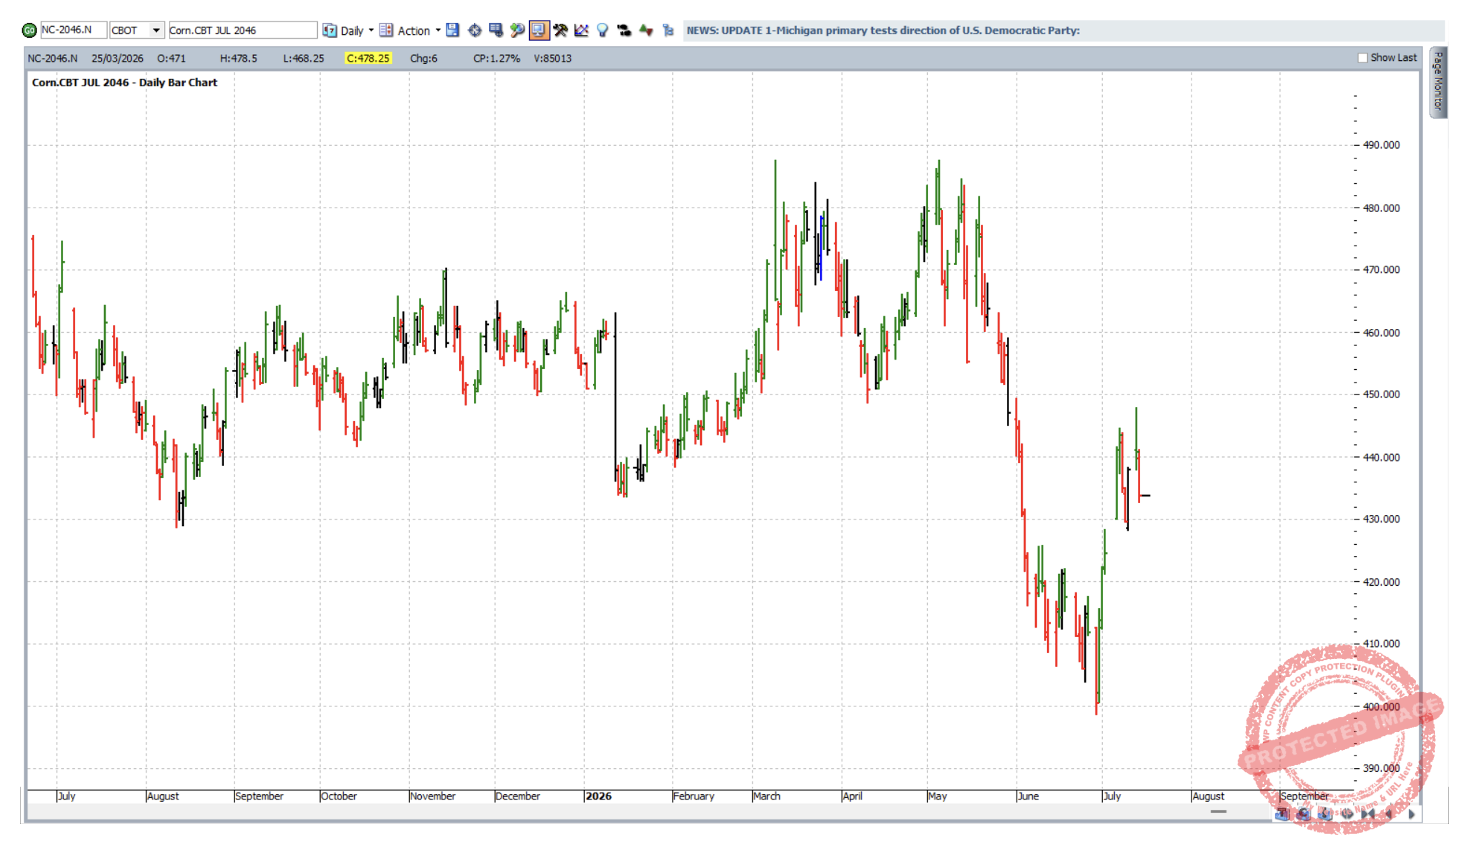
The other type of chart dedicated to an individual contract month is the discontinuous chart for a particular contract within a particular year. These charts start at the birth of a particular contract and run until its expiry. Shown below is that for July 2026 Corn, symbol NC-2026.N; naturally this chart stopped producing data in July of this year.
At the moment this article might be raising more questions about charts than what it’s answering, so let’s turn that around. First of all, which chart do we use?….
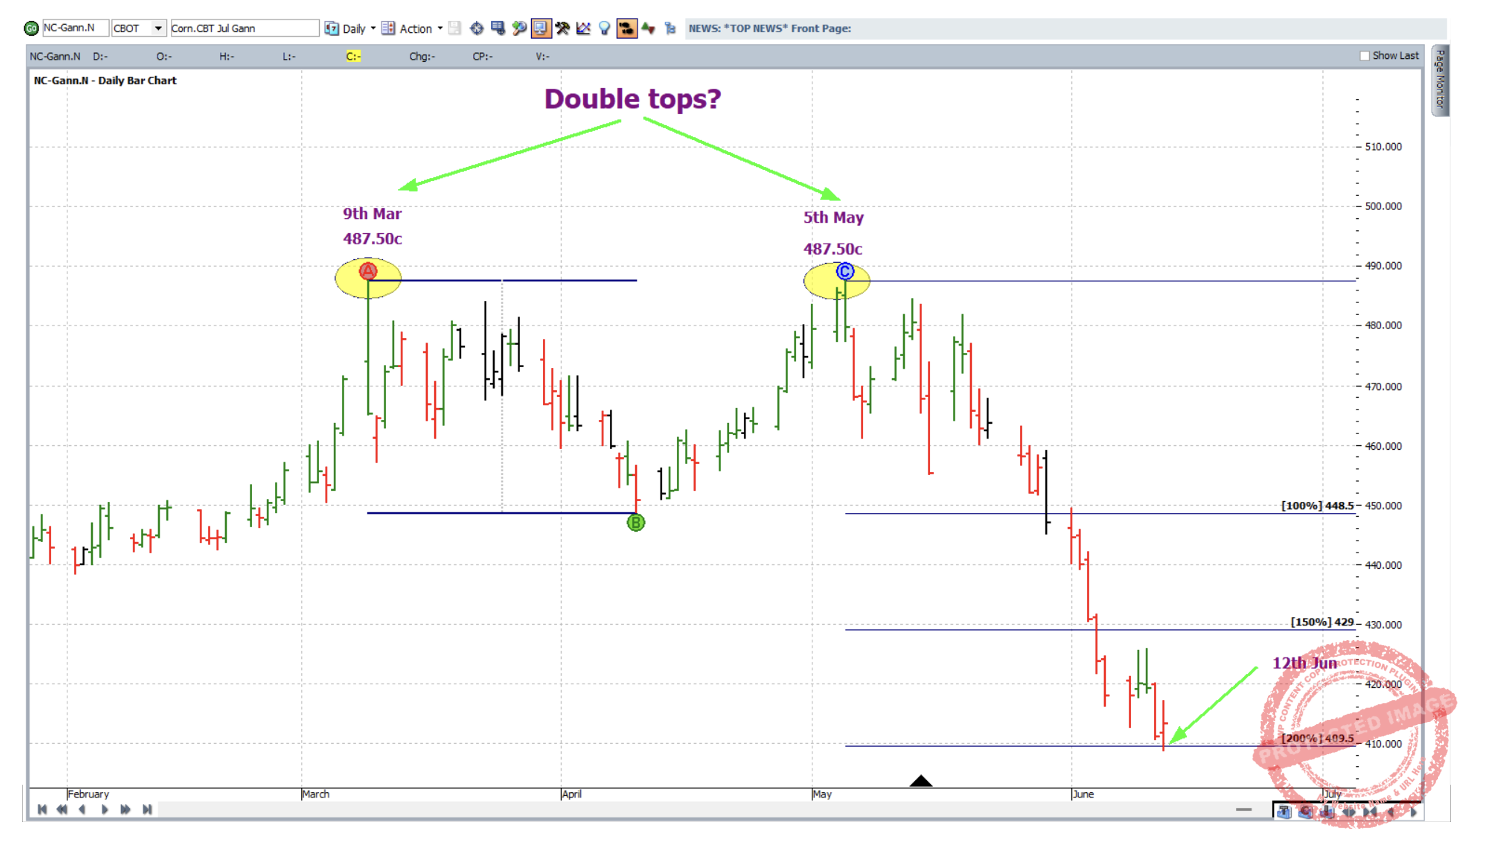
The answer is to keep an eye on all of them. For instance, if you look closely enough at the four charts above, you will notice that only the last two of them had a clear double top formation. Double tops are outlined in the Number One Trading Plan manual. This formation is shown below in more detail (and in Walk Thru mode at the point in time that it was only a potential). It’s shown on the continuous Gann Chart for July Corn.
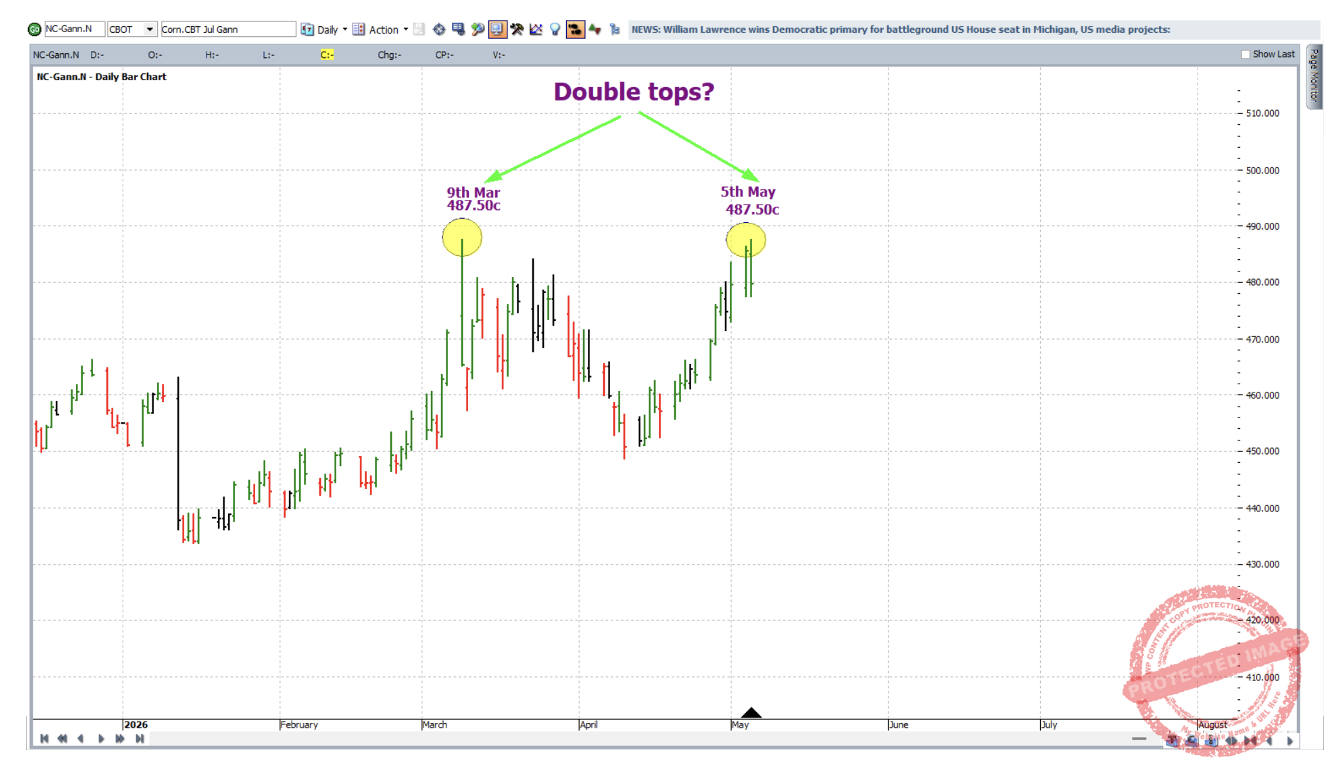
For the trade itself, a first lower swing top entry signal (as defined by the Number One Trading Plan manual) was confirmed on 14 May 2026, getting you short July Corn at 477.25 cents per bushel with initial exit stop at 484.75c; As for the trading plan, 200% of the double tops was the exit target, with stops to be moved when two key milestones were reached: 100% and 150% i.e. halfway and three-quarters of the way through the expected run. Normally stops would be moved at 25% multiples but this was a fairly small picture/small range double top so only acting at 50% multiples gave the market room to breathe on the way down.
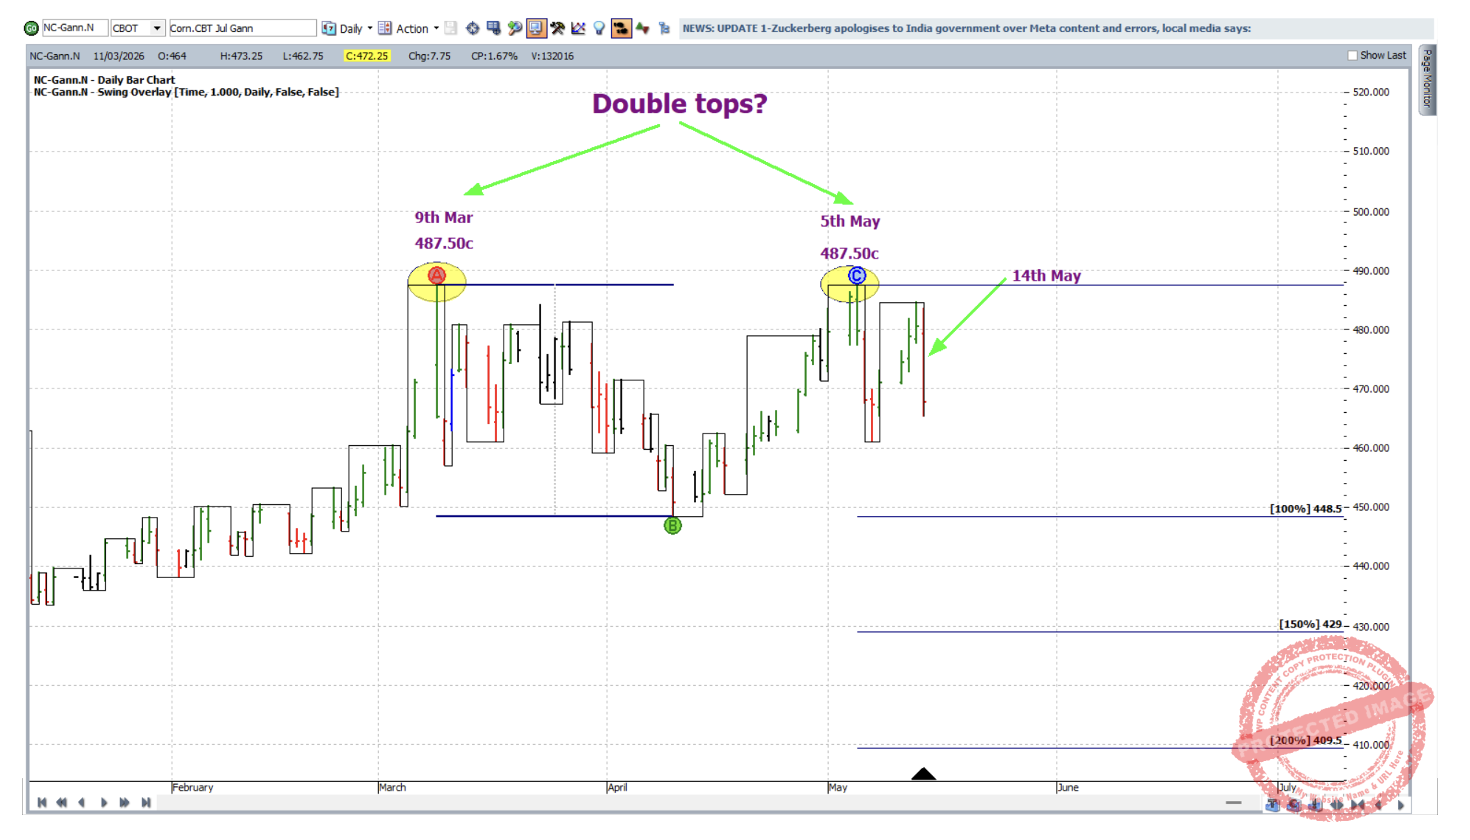
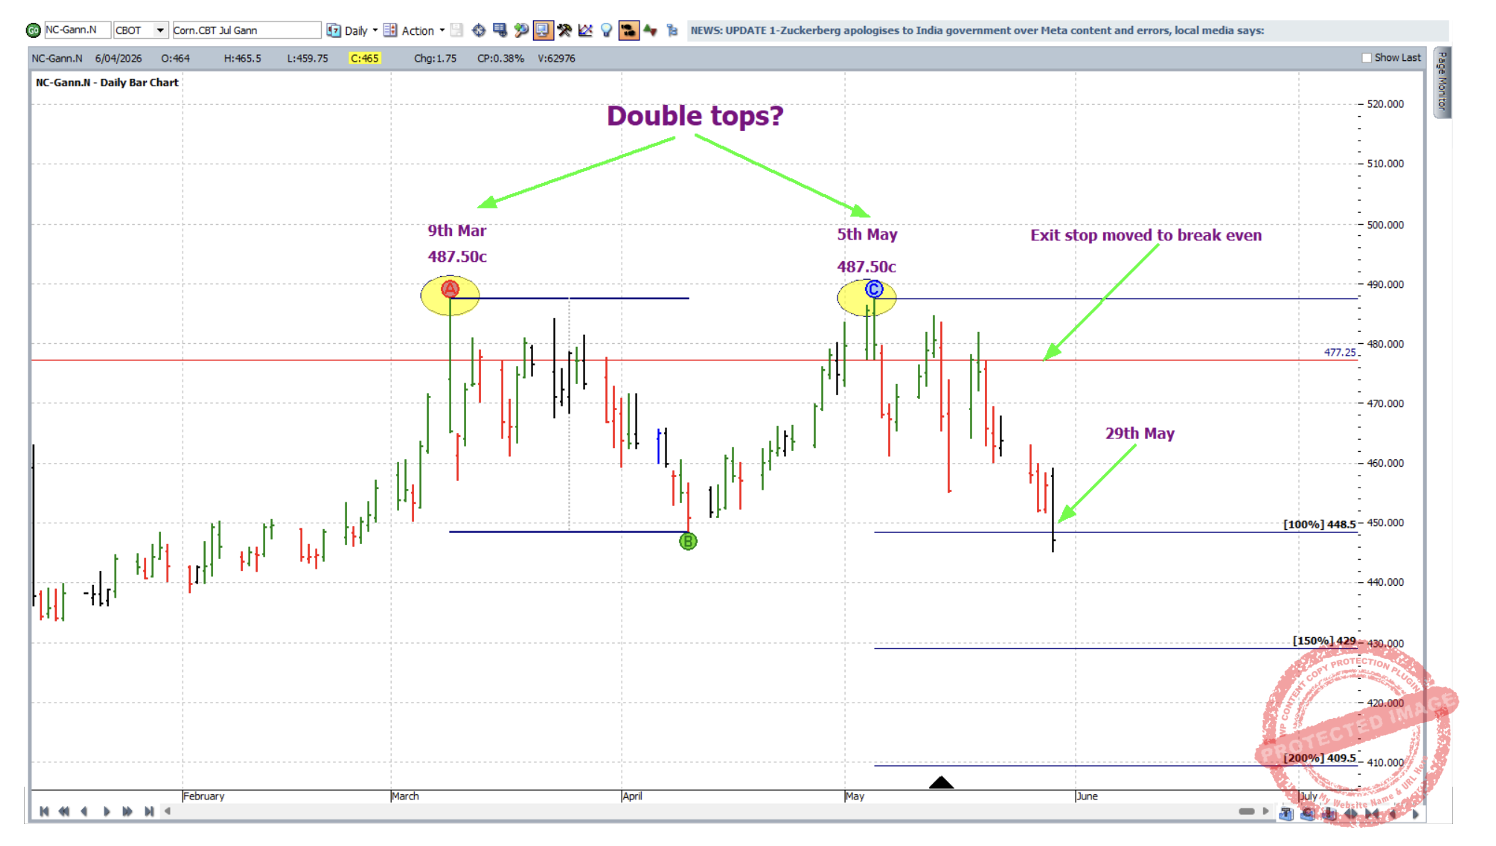
On 29 May 2026 the 100% milestone was reached and exit stops were moved to break even.
On 4 June 2026 the 150% milestone was reached and exit stops were moved to one third of the average weekly range (approximately 5.50c at the time) above the 100% milestone in order to lock in some profit.
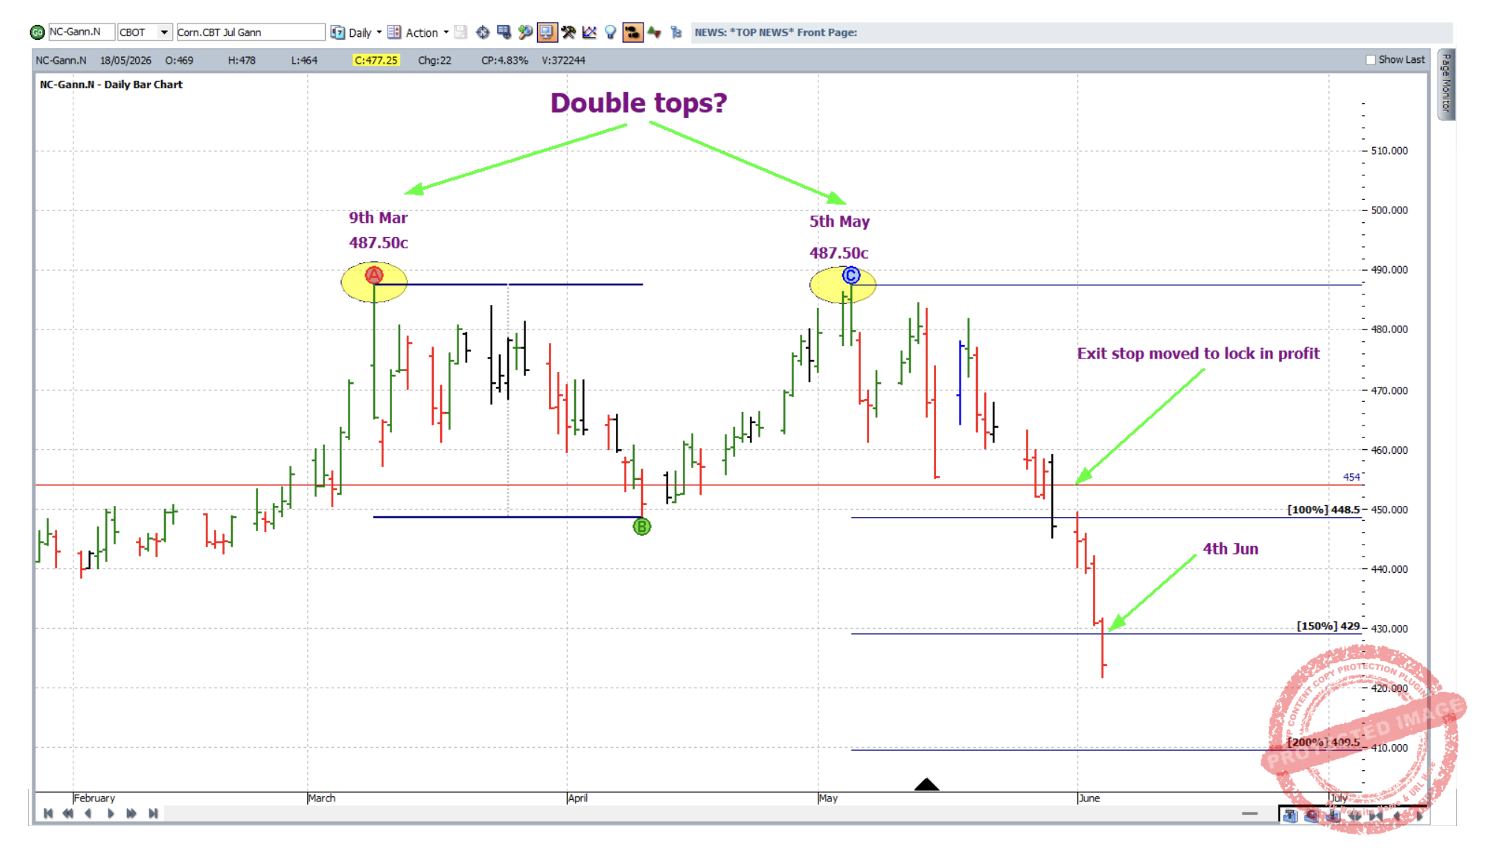
And on 12 June 2026 the 200% milestone was reached and the trade closed at 409.50c.
Now for a breakdown of the rewards. In terms of the reward to risk ratio:
Initial Risk: 484.75 – 477.25 = 7.50 = 30 points (point size is 0.25)
Reward: 477.25 – 409.50 = 67.75 = 271 points
Reward to Risk Ratio: 271/30 = approximately 9 to 1
According to the contract specifications for Corn futures on the CME Group website, each point of price movement changes the value of one contract by $12.50USD. So in absolute USD terms the risk and reward for each contract of the trade was determined as:
Risk = $12.50 x 30 = $375
Reward = $12.50 x 271 = $3,387.50
In AUD terms at the time of taking profit this reward was approximately $4,800.
Risking 5% of the account size for this trade, the resulting percentage change to the account size after taking profits would be:
9 x 5% = 45%
CFD brokers will offer access to this strongly trending market via a CFD, where much smaller position sizes are available.
For the purpose of analysis, one market can lend itself better to certain chart types than others. There’s no hard and fast rule. It depends on the amount of back testing done and the underlying intuition which is gained by consistently putting in the hours of work.
Generally speaking, at any given time we always look to trade the contract of highest volume, which for July Corn, for instance, is from roughly mid-April to mid-June each year. That being said, during this period you might only find a set up on one of the other forward contract month charts which could still be liquid enough to trade.
One thing this article lacks is the supportive price forecasting work from resistance levels and milestones from our resistance cards and bigger picture ABC applications. There was however at least one simple and solid piece of time analysis which supported the case for the double top to be successful and our Ultimate Gann Course students may take an interest in looking into that further.
Work hard, work smart.
Andrew Baraniak