
Triple Tops or All Time High?
The SPI200 has recently broken to the upside out of a narrow July sideways trading range, which at present would appear to be accumulation rather than distribution. I found July a tough month for interpreting direction, which normally means the market is in a sideways trend!
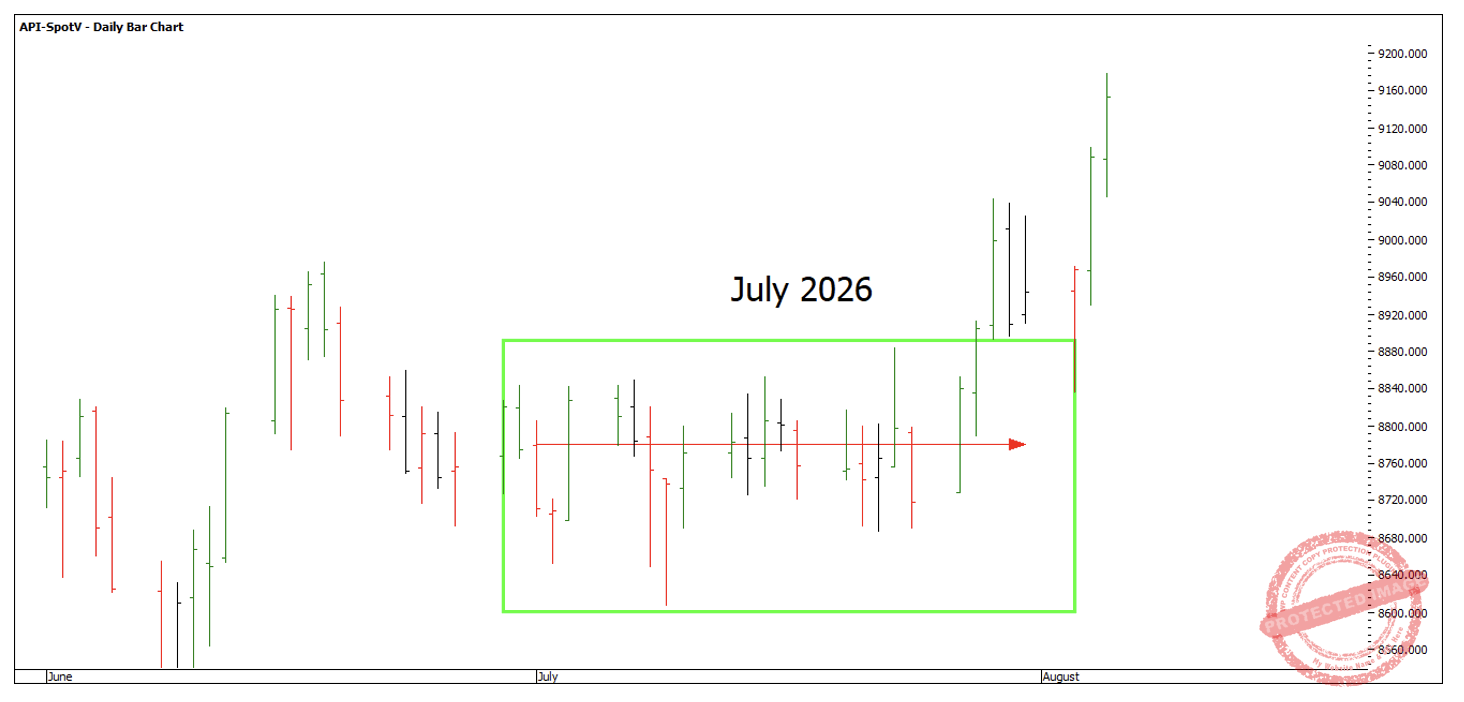
Chart 1
Swing charts are such a fundamental part of my analysis, but something I learned years ago while maintaining a 4-hour swing chart, was a clear sign of a sideways market was when I started to see Overbalance in Price swings in both directions.
Generally speaking, this technique or ‘filter’ is highly reliable. You can find the reference to ‘Overbalance in Price’ in the Number One Trading Plan on P97, and then the ‘Trading Exercise’ that followed.
On 23 July the market broke multiple bar chart tops under increased volume, only to be beaten back down on the 24th. However, a breakout like this can often be a warning the market is getting ready to break out.
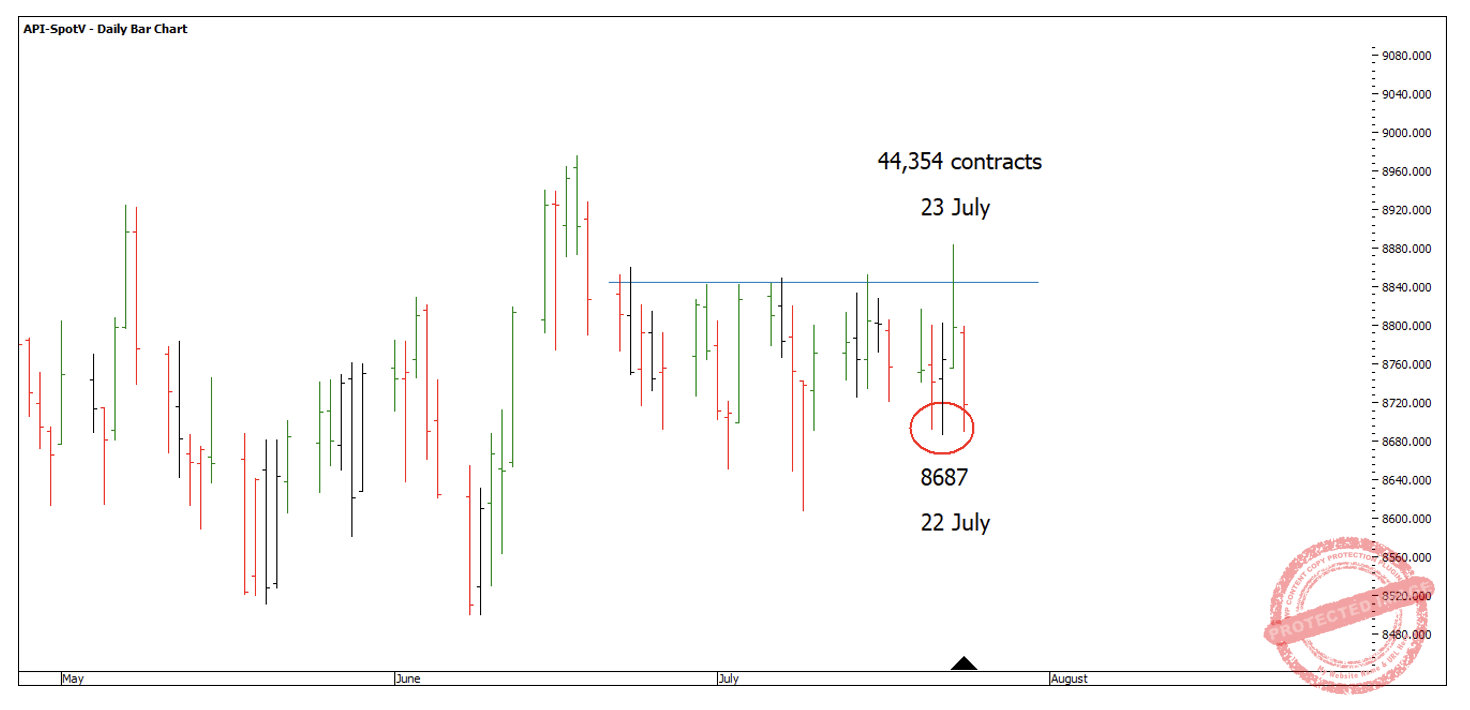
Chart 2
A really good example of this was on Gold back in early 2024, just on a much bigger scale! Gold had broken through for a fourth time, although broke out significantly higher than the previous highs. Rising bottoms with multiple tops at the same level can also be another signal the market is likely to break to the upside.
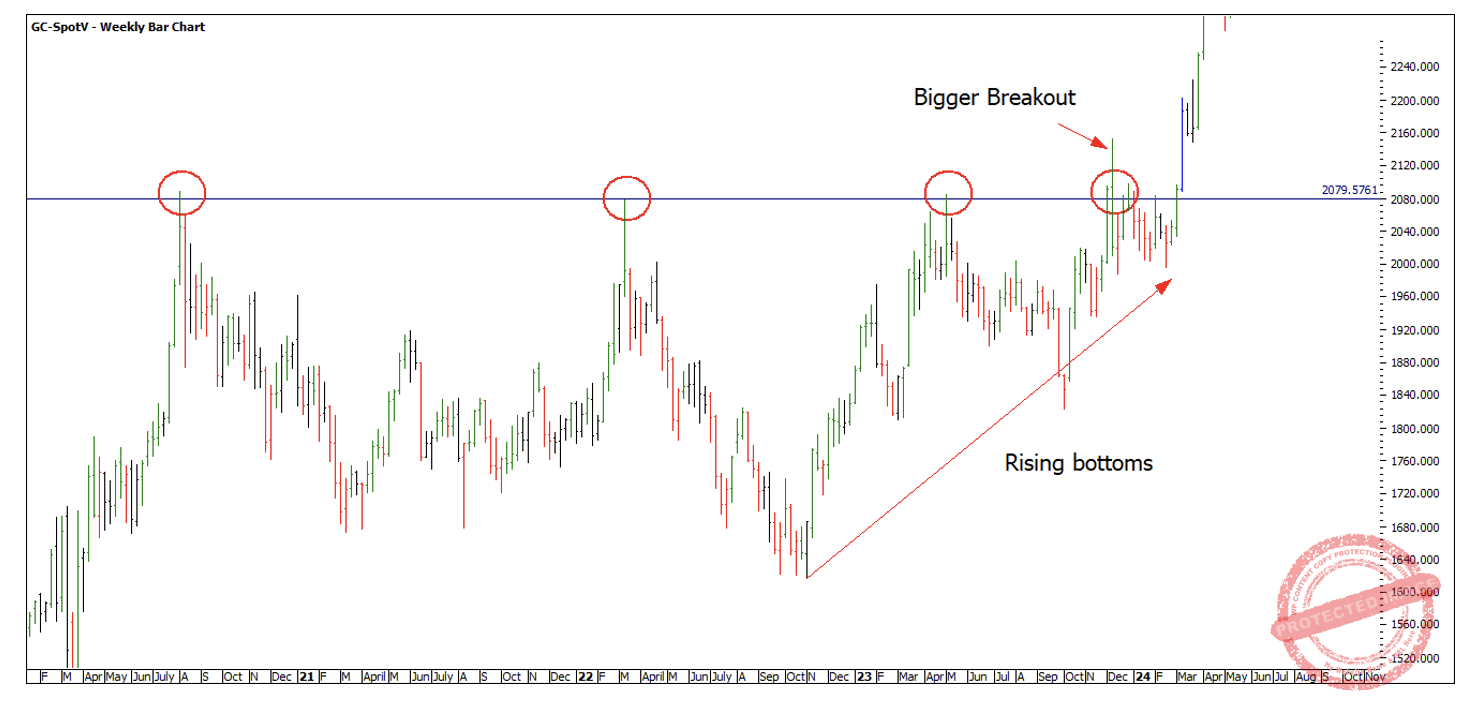
Chart 3
As the SPI did breakout to the upside, we finally saw a big increase in volume on 29 July of 57,796 contracts providing some confirmation of direction.
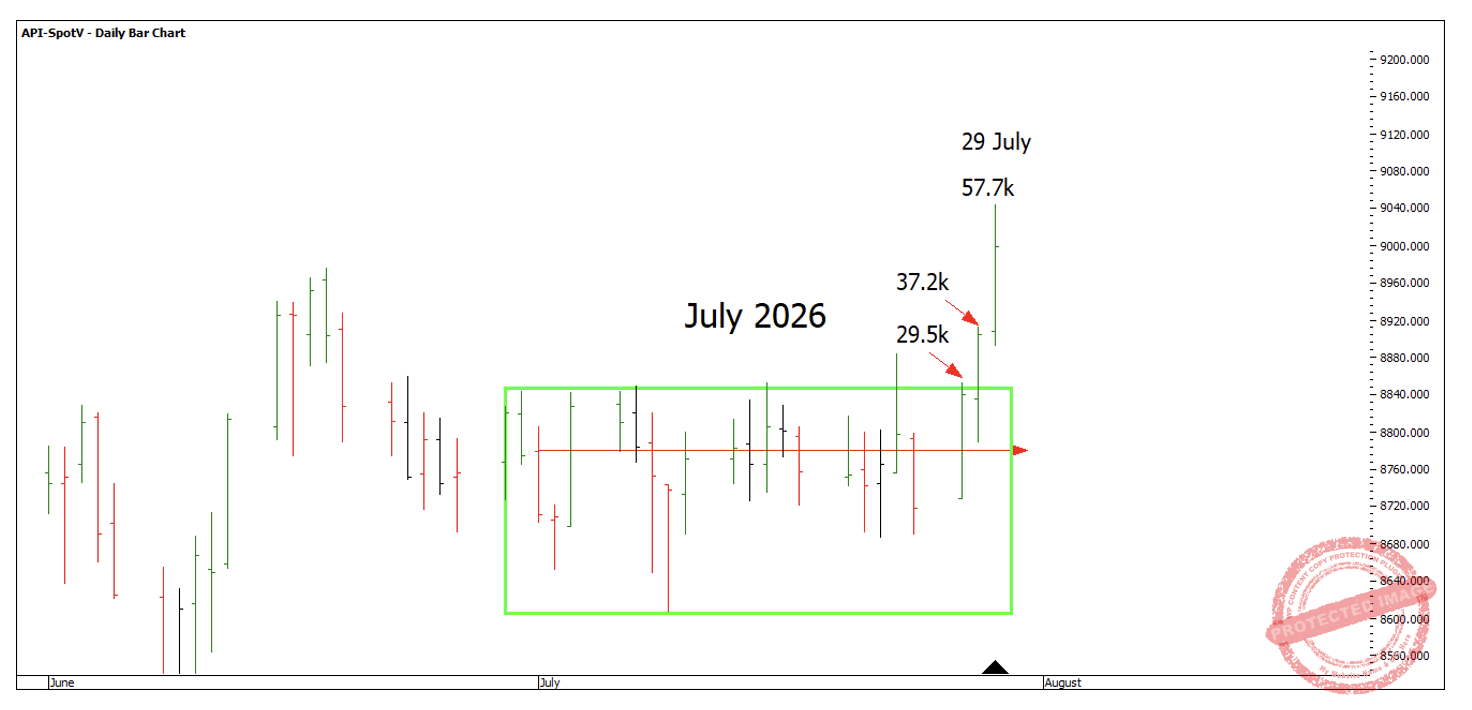
Chart 4
As this market then had two inside days followed by a day down, we saw a balanced retracement that went a smidgen through 100% of the last daily swing down, finding support at 8837 on the old tops that once was resistance.
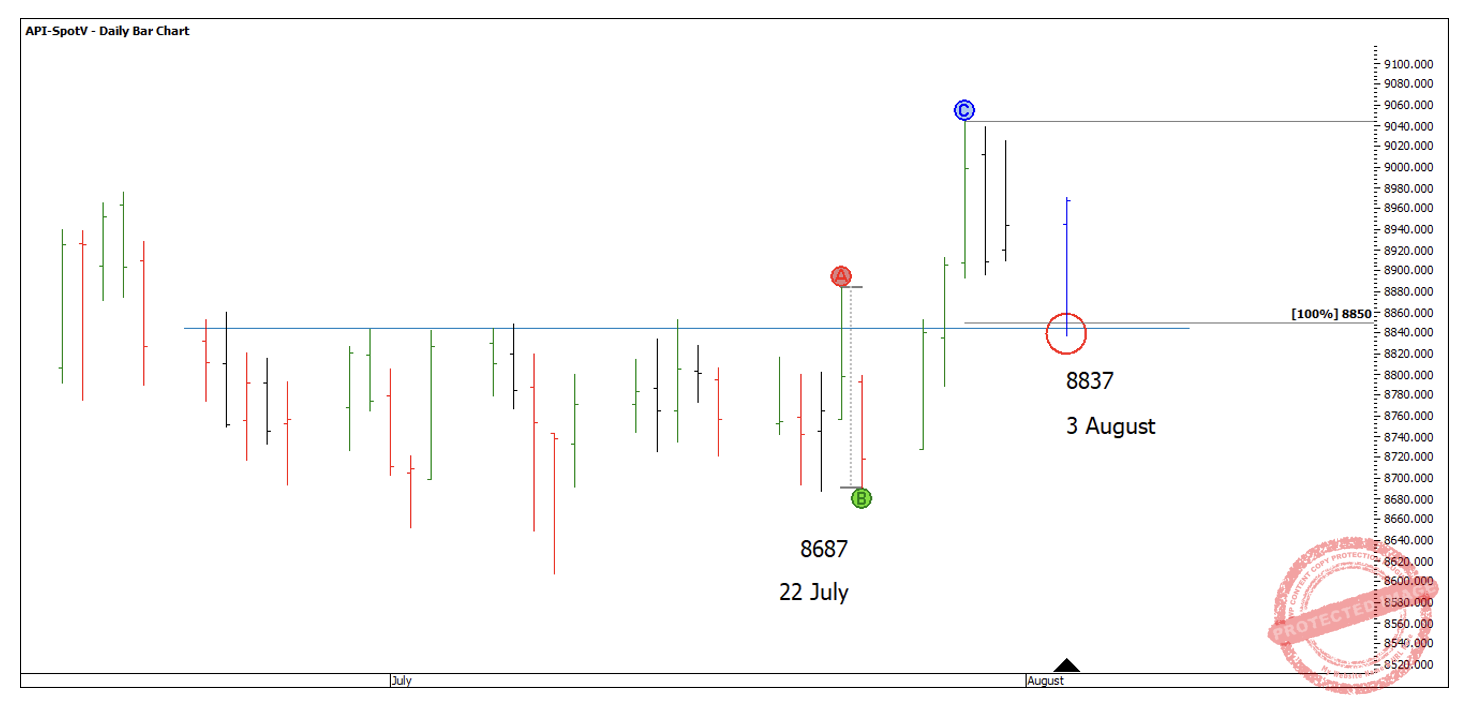
Chart 5
For extra price support, a classic trendline from the previous all-time high of 9187 called the low to within about 1 point, also showing us a different application to old tops becoming new bottoms.
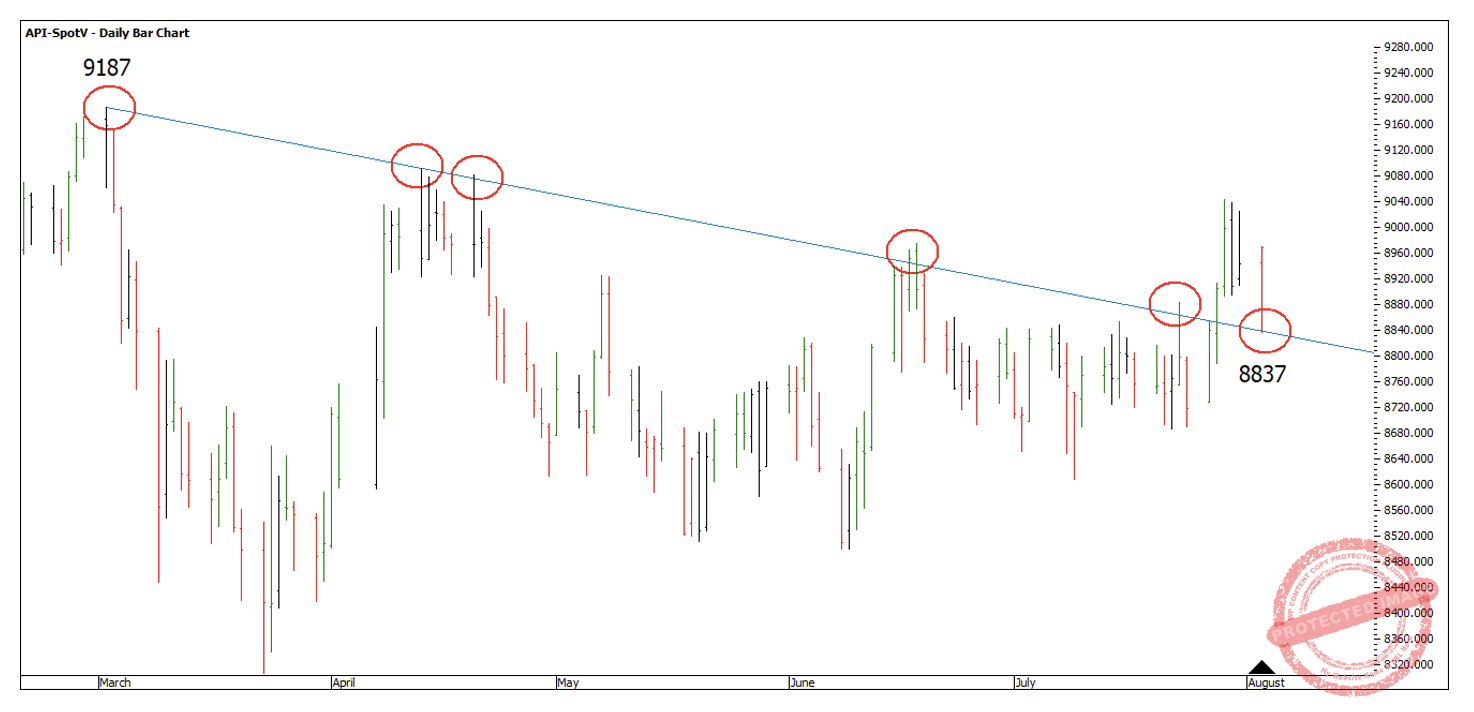
Chart 6
As I finish writing this article, the SPI has topped at 9239 for the day, just a smidgen short of the trend line running up from the past two major highs.
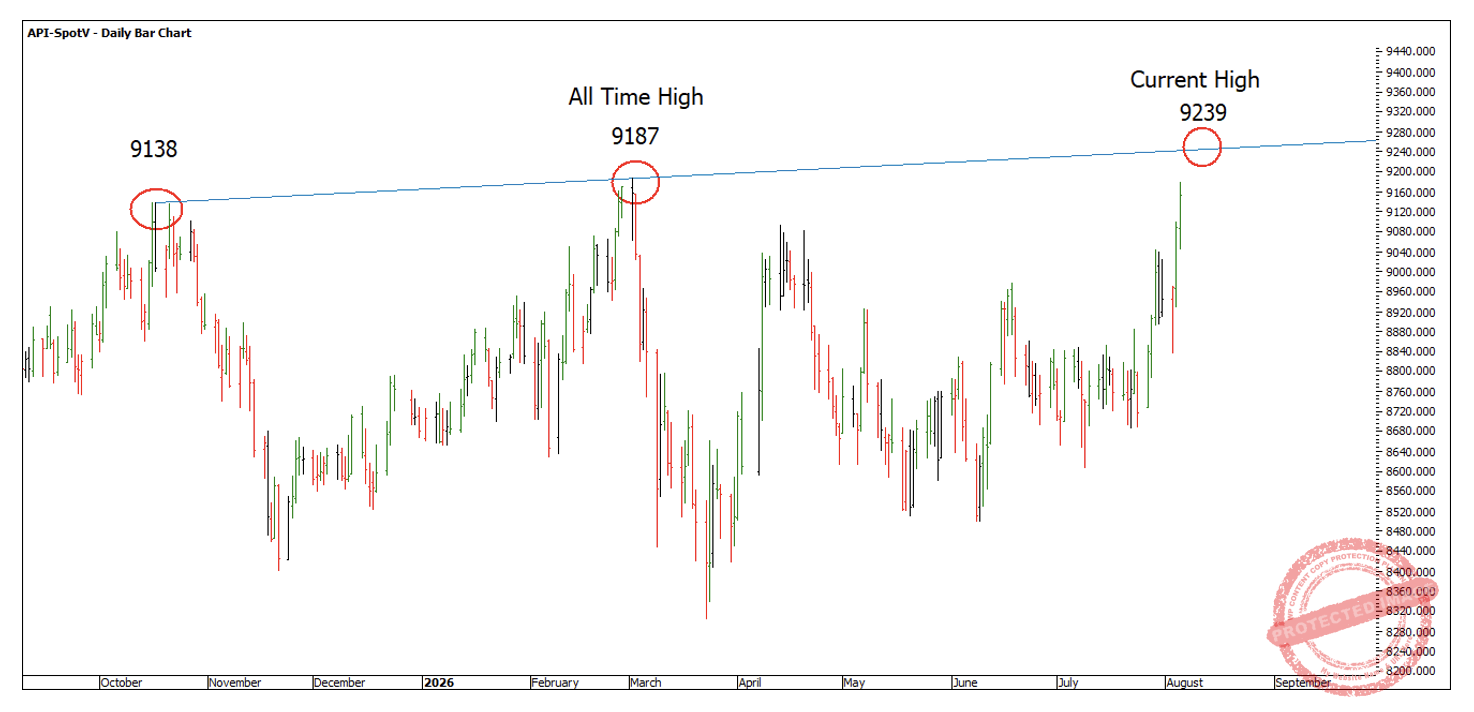
Chart 7
As the end of day data is yet to come into ProfitSource, I can use barchart.com to check where the market is currently trading. Below is the measurement of the daily ranges on a 4-hour bar chart. The current daily swing up into 9239 is an expanding daily swing range at 402 points compared with 354 points of the previous range.
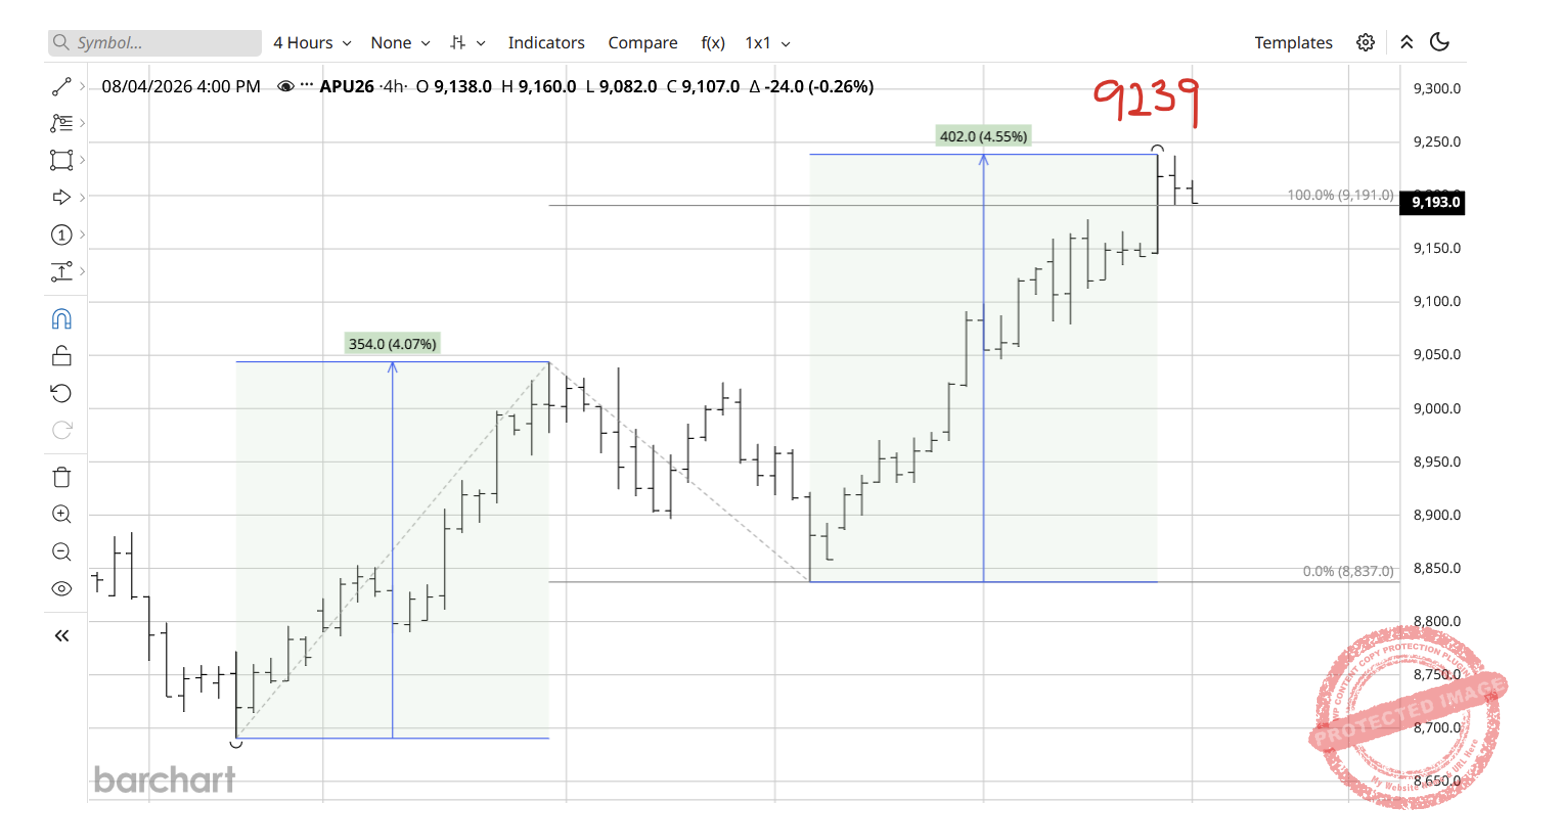
Chart 8
My thoughts are that the overhead trend line could be the next hurdle before cleanly breaking into new all-time highs. Beyond this, the next major numbers I see are two 100% milestones on a very large yearly time frame, 9523 and 9457.
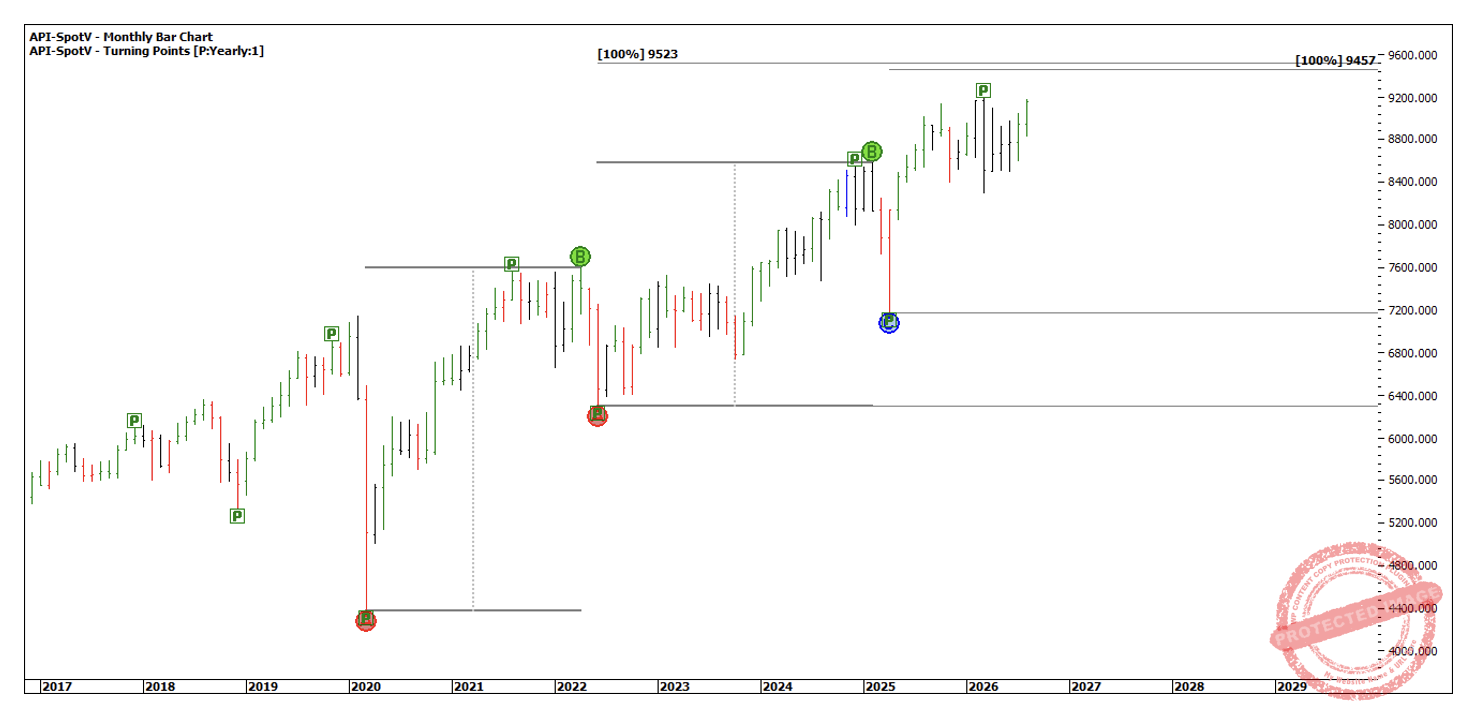
Chart 9
My general outlook remains the same, long and strong with any pull backs being retracements against the main trend and more buying opportunities. However, I still let the market tell the story and I stay ready to trade with the trend!
Happy trading,
Gus