
September Seasonal?
I sometimes feel that talking about the same market month in, month out can become a little repetitive, especially for readers who enjoy hearing about a range of different markets.
Although, the further I go down the road of hand charting, the more I add to my charts and the more I seem to see. Once you add something to a hand chart, it really seems to pop, and you start noticing things you may have previously overlooked.
Of course, the downside of hand charting is the time it takes. With a busy daily life, I really only have time to focus on one market. Keeping charts updated is a real discipline, and I’m sure plenty of traders have spent hours creating charts, only to eventually find them sitting in a cupboard somewhere.
This month, I want to share some thoughts on calling the 17 September weekly swing low, and some elements that came together.
For an overview:
- 2×1 Weekly angle support
- 150% of the weekly First Range Out (FRO) = 8697
- 5% Monthly Ranges Resistance Card = 8665
- 200% of the last daily swing = 8682
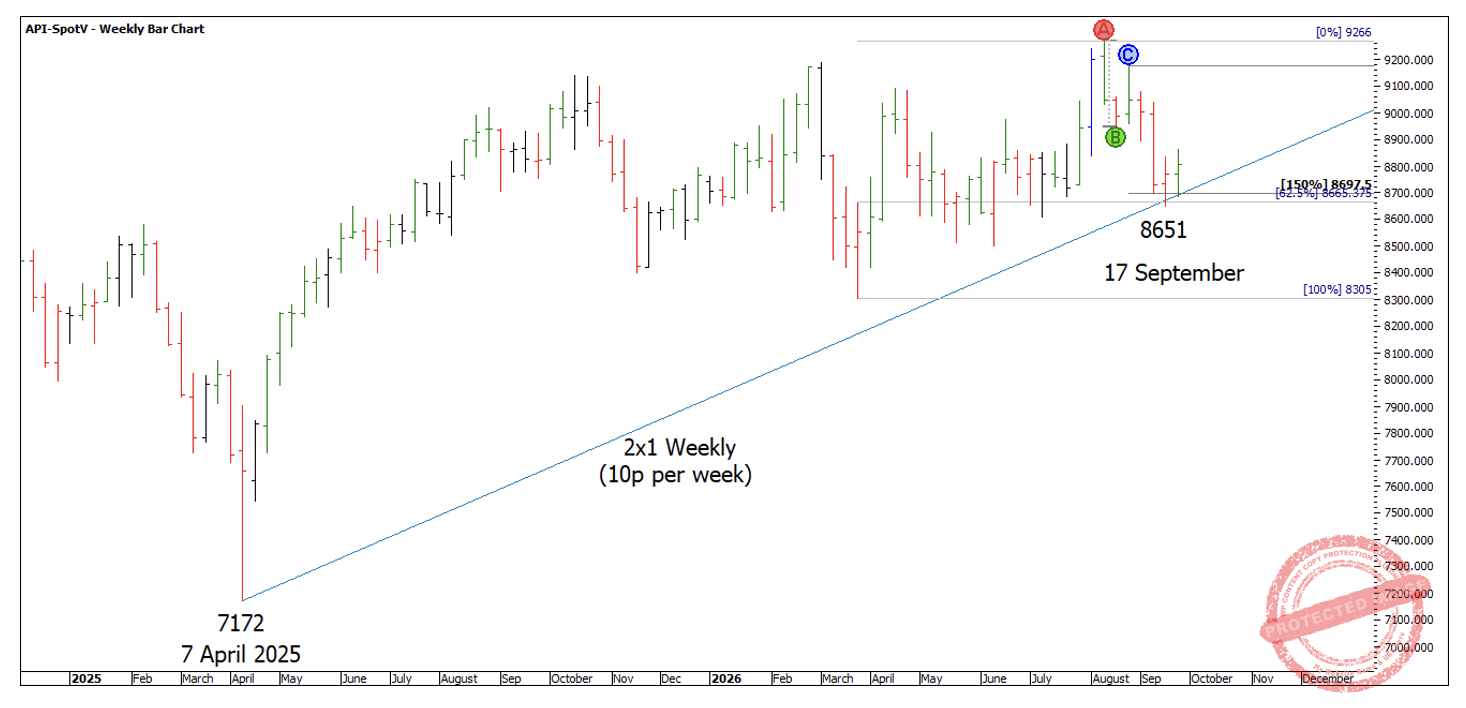
Chart 1
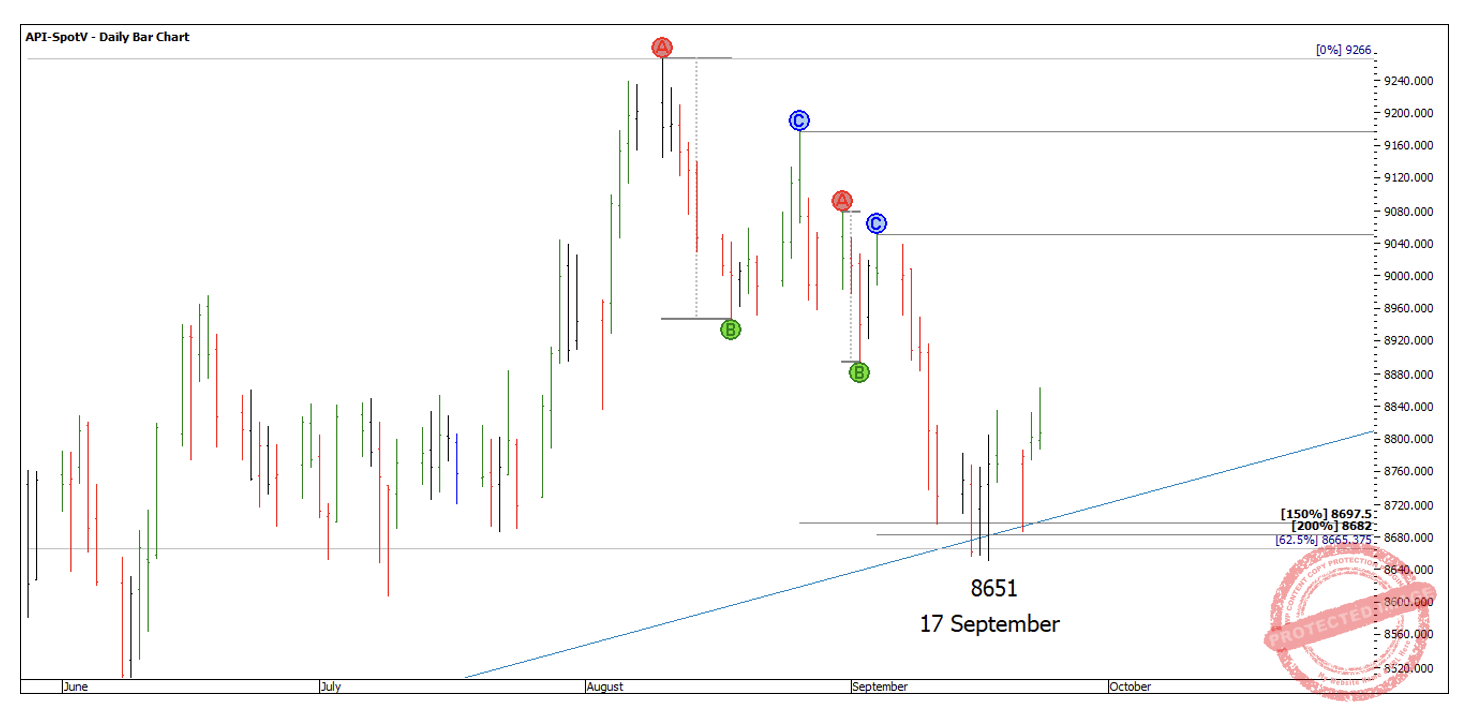
Chart 2
The above ProfitSource charts are a lot neater for article purposes, as opposed to my monthly swing chart pictured below. The hand chart looks fine to me, but I’m aware that it may look a bit ‘busy’ for someone who didn’t draw it up.
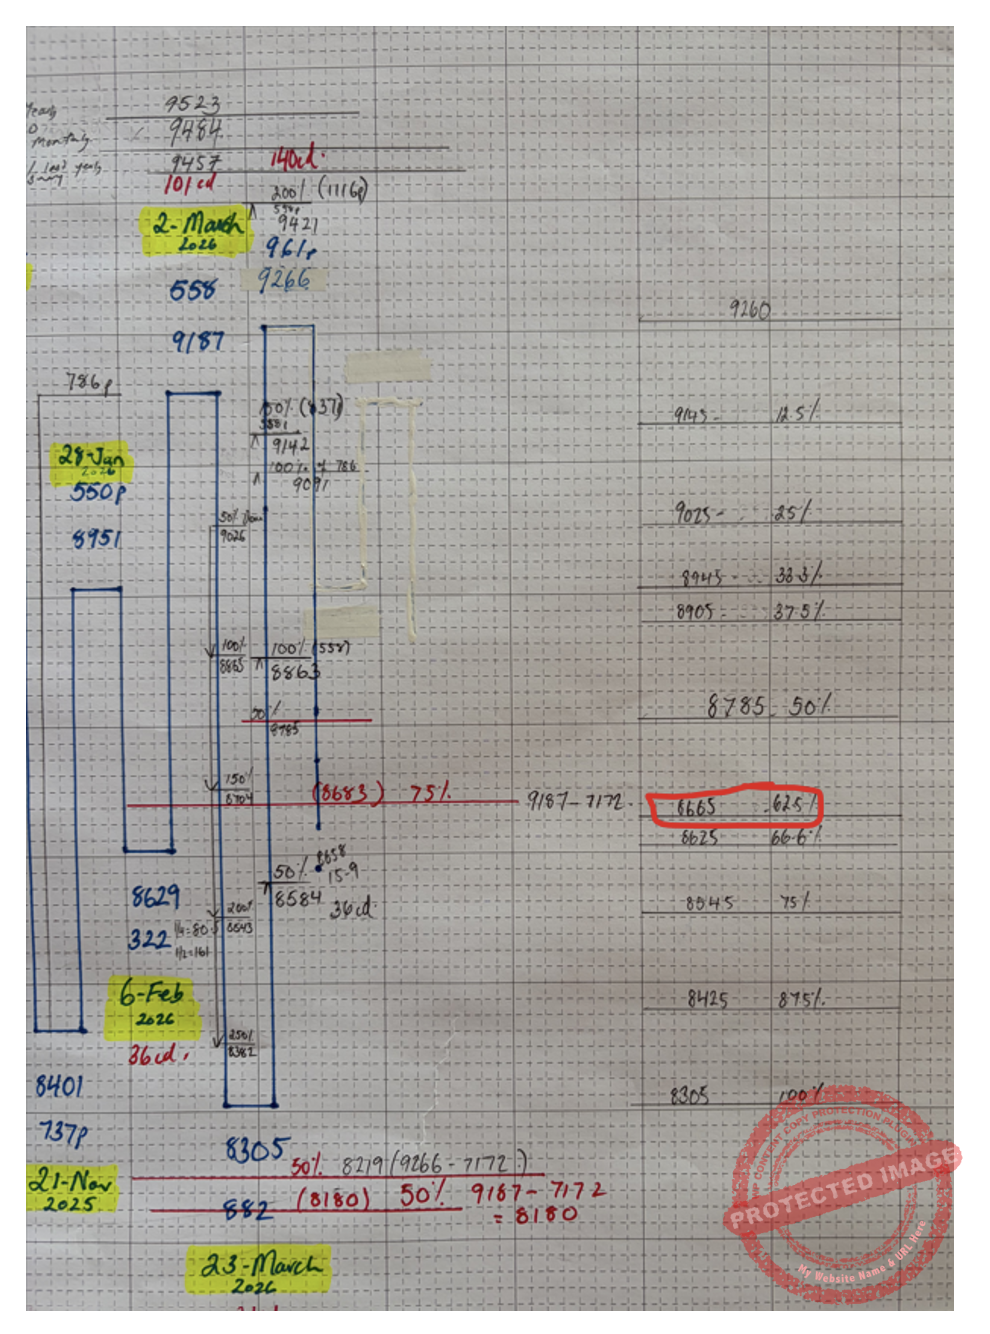
Chart 3
Looking at the 30-degree Time by Degree Vibration Wall Chart, there is a vibration around 23 degrees to 26 degrees with the 17th of September being a 1 year anniversary from a weekly swing turn back in 2025.
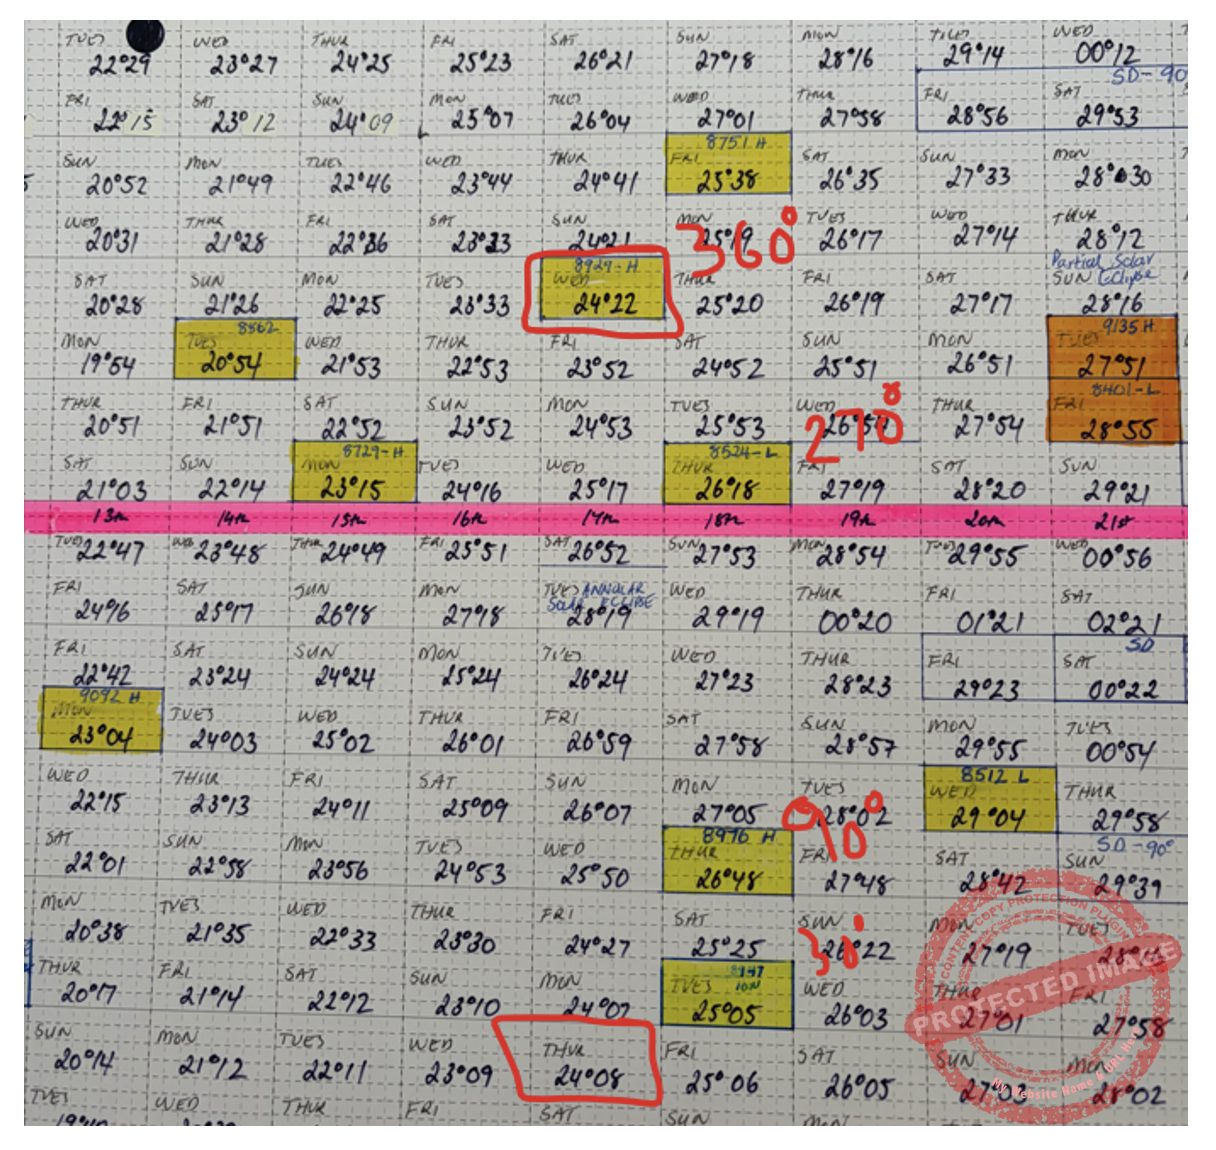
Chart 4
Looking at the all-time low square of 458, you can see the 17 September low of 8651 landed in the strong part of the square.
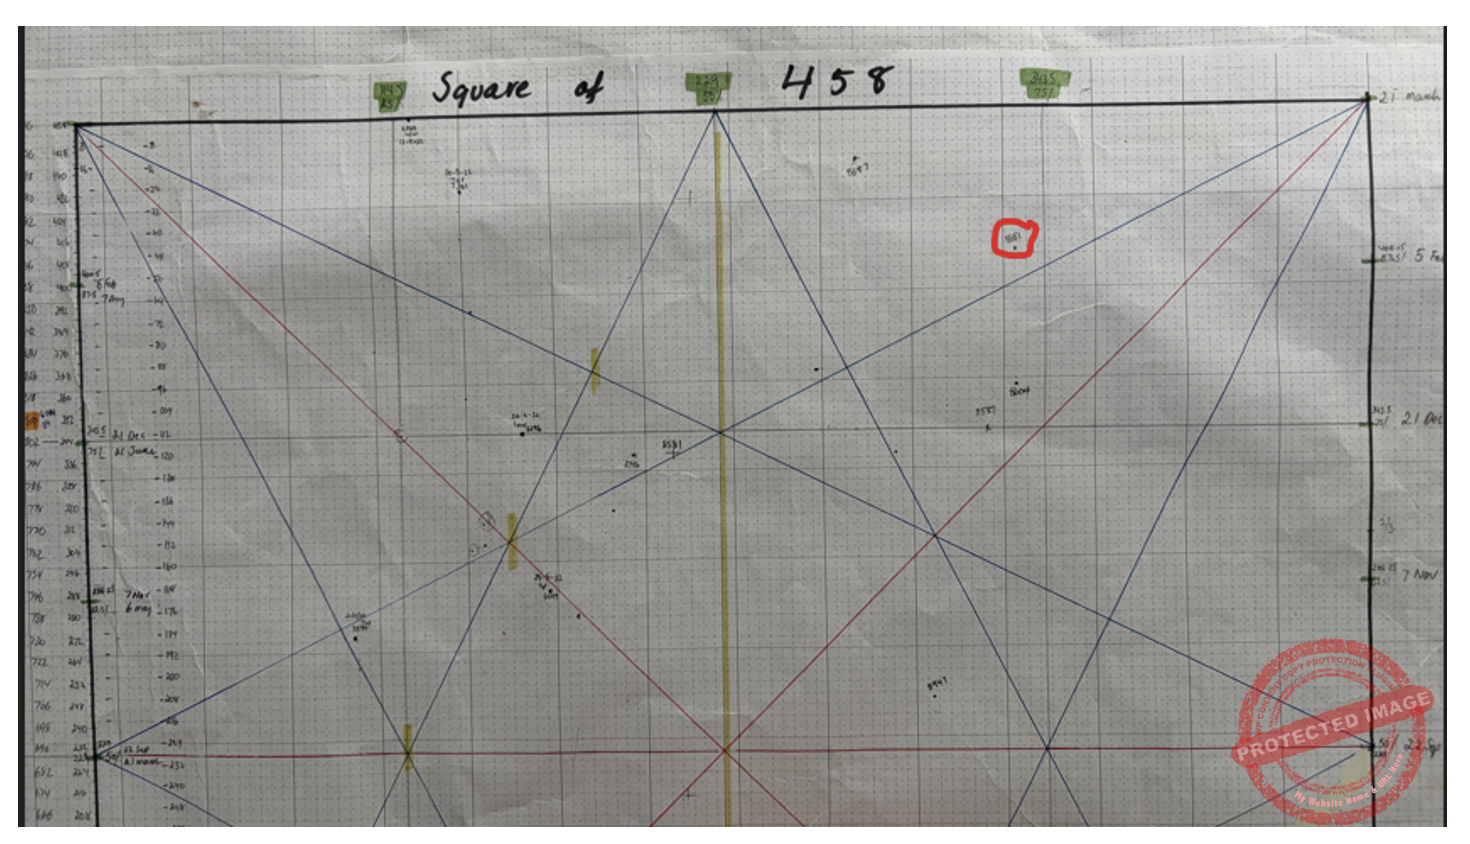
Chart 5
The 17 September low of 8651 was right on contract rollover and was actually the December contract low. Whereas the September contract low came in at 8597 and was a false break double bottom with the 9 July low.
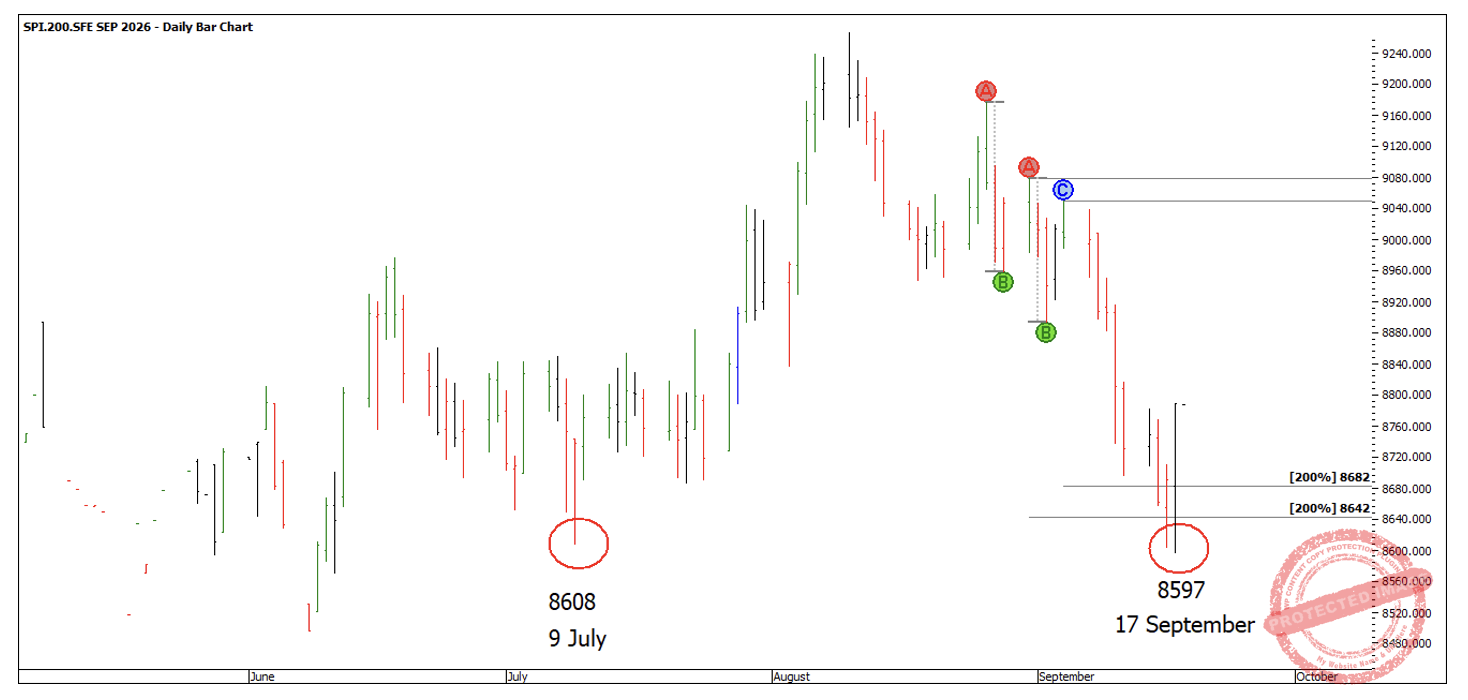
Chart 6
If you were trading this low then you needed to be trading the December contract, and the 17 September low had a very clear pattern running into it. That is, four clear sections down on the 1-hour bar chart into a false break double bottom.
Section 4 was 150% of the previous section, and the whole move came in at exactly 300% of the 1-hour First Range Out.
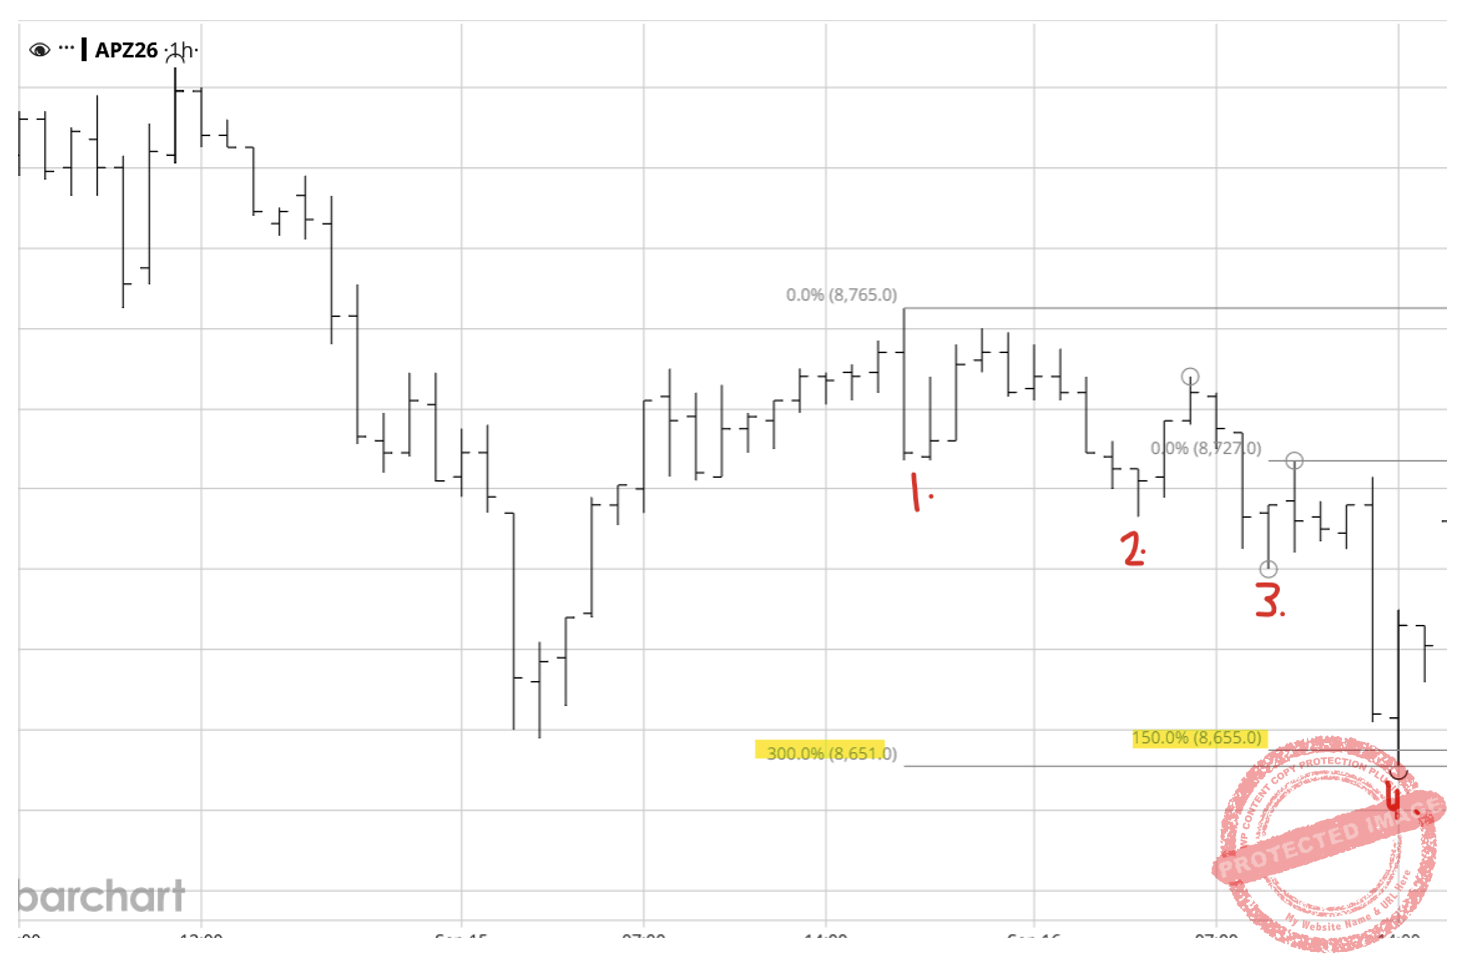
Chart 7
Unfortunately, the market made a low in the early hours of the morning and then opened up with a big gap up on the day session.
A Long the Openers was a good entry strategy, however it would have been the initial stop loss placement that was most critical, depending on how long you anticipate staying in the trade for.
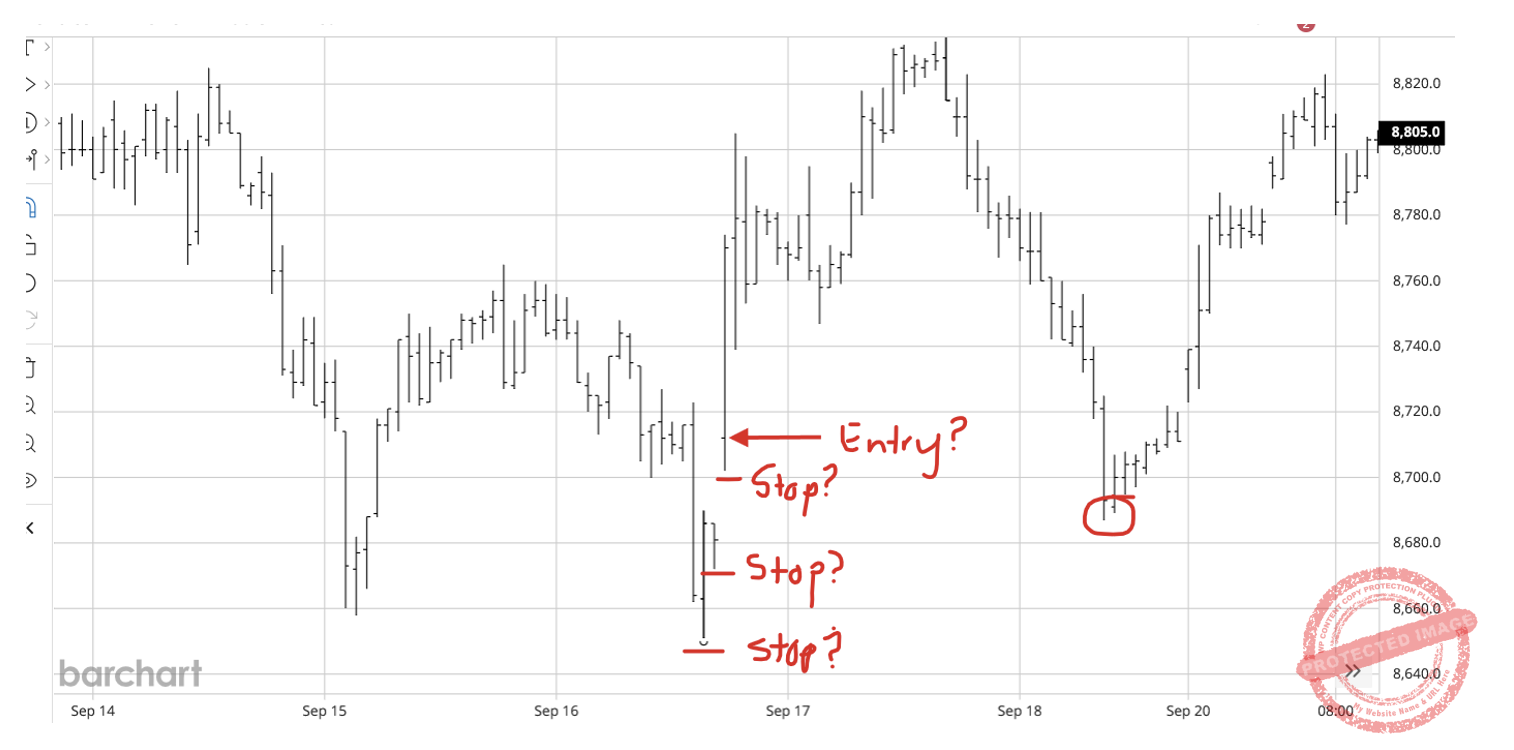
Chart 8
The current move up hasn’t filled me with high confidence that it’s the start of a bull market. In fact, it’s looking to me more like a retracement against the trend into the September seasonal date.
If I apply a Speed Angle from the last weekly swing up, you can see the current weekly run up has done less in price and time, while the daily swing is also a contracting swing range up, all under fairly low volume of about 32,000 contracts per day for the first three trading days of this week.
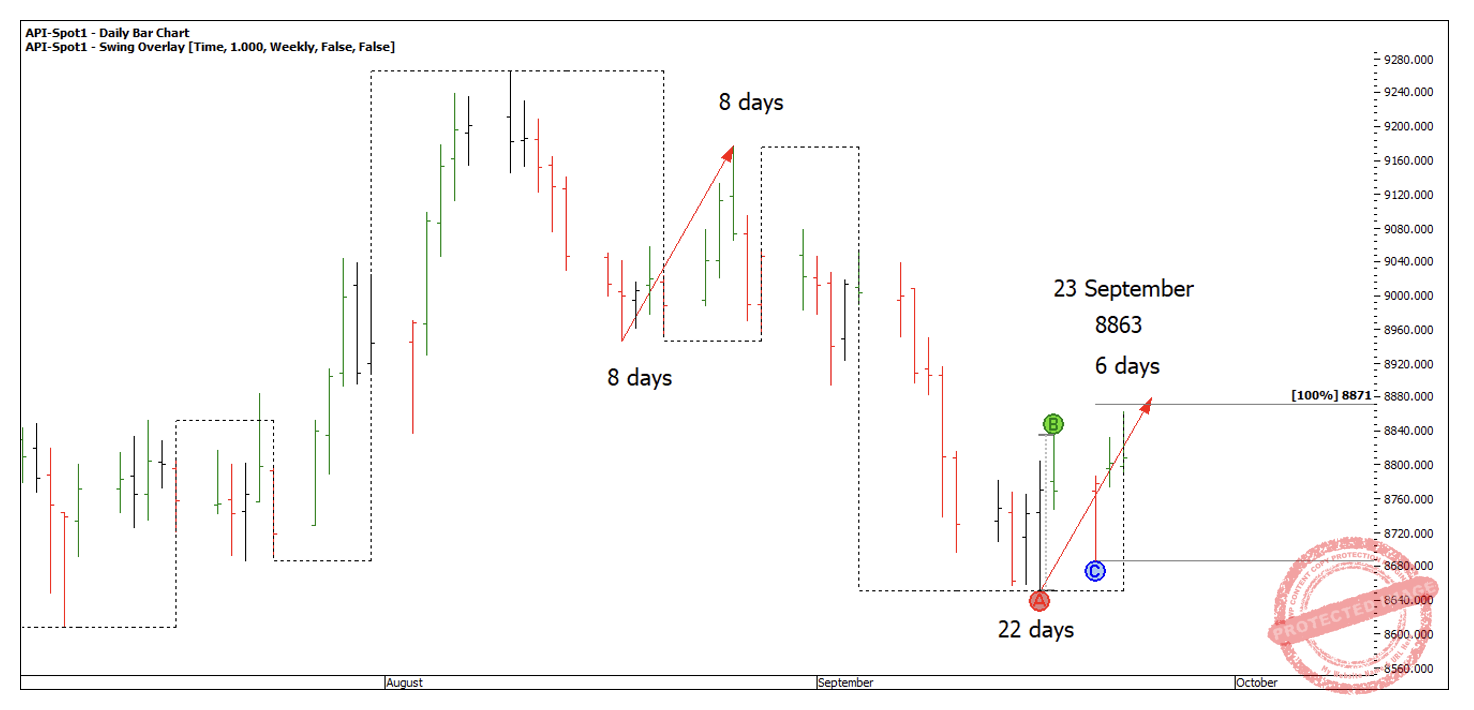
Chart 9
There are always plenty of trading opportunities if you are setup to see them!
Happy trading,
Gus