
Wheels within Wheels
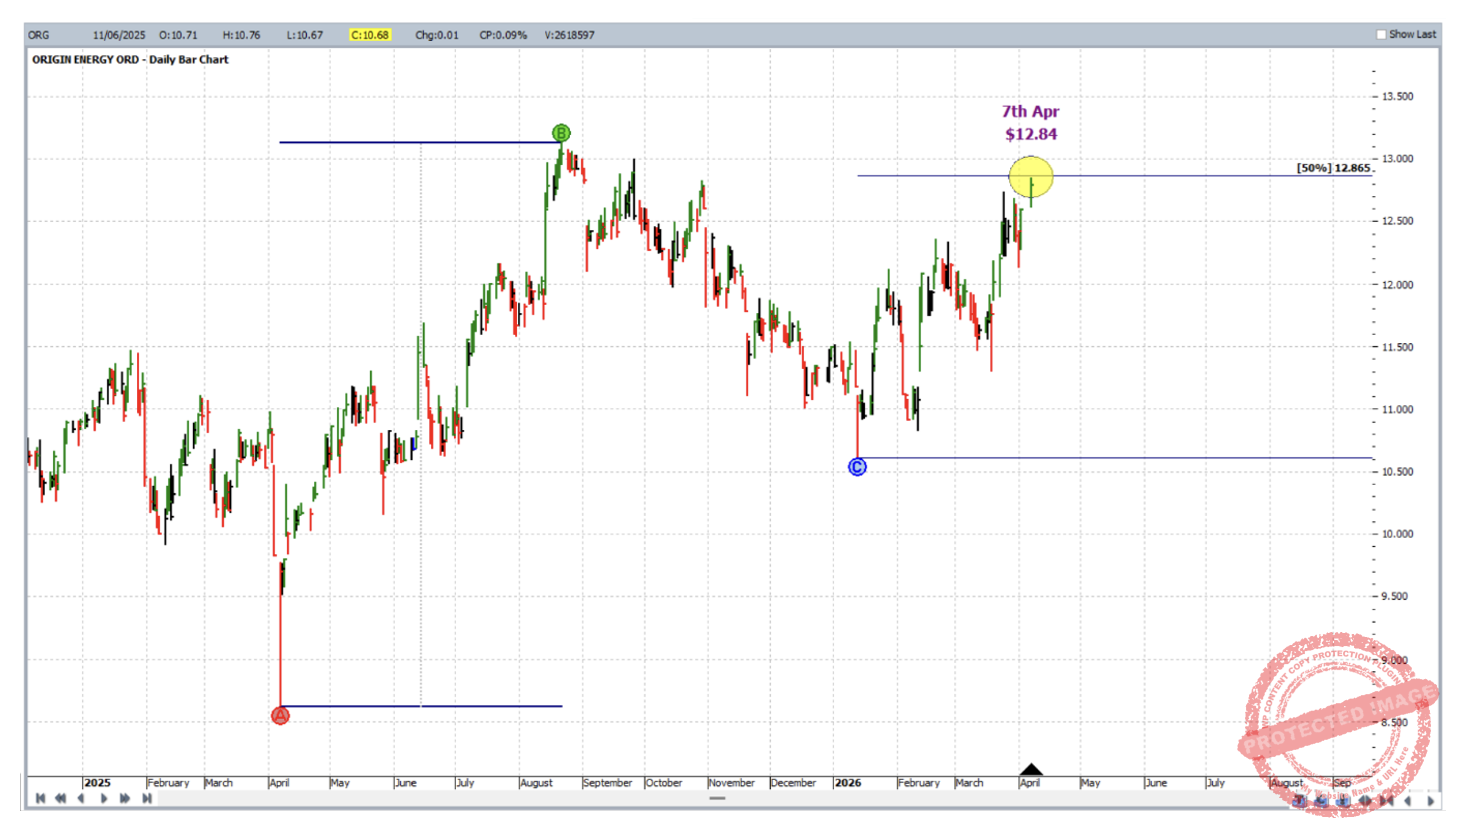
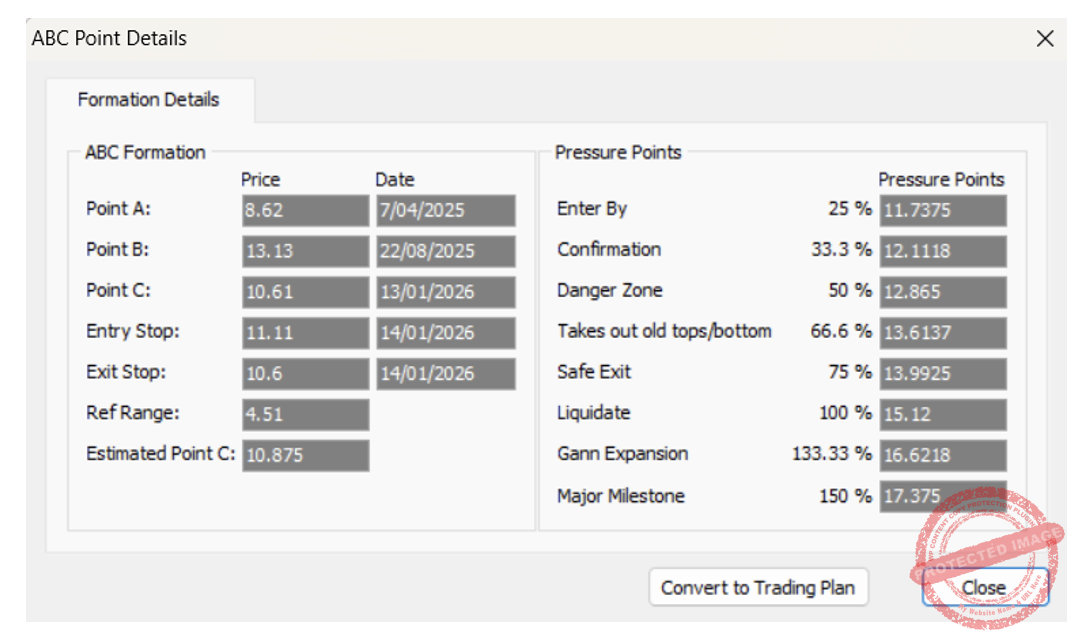
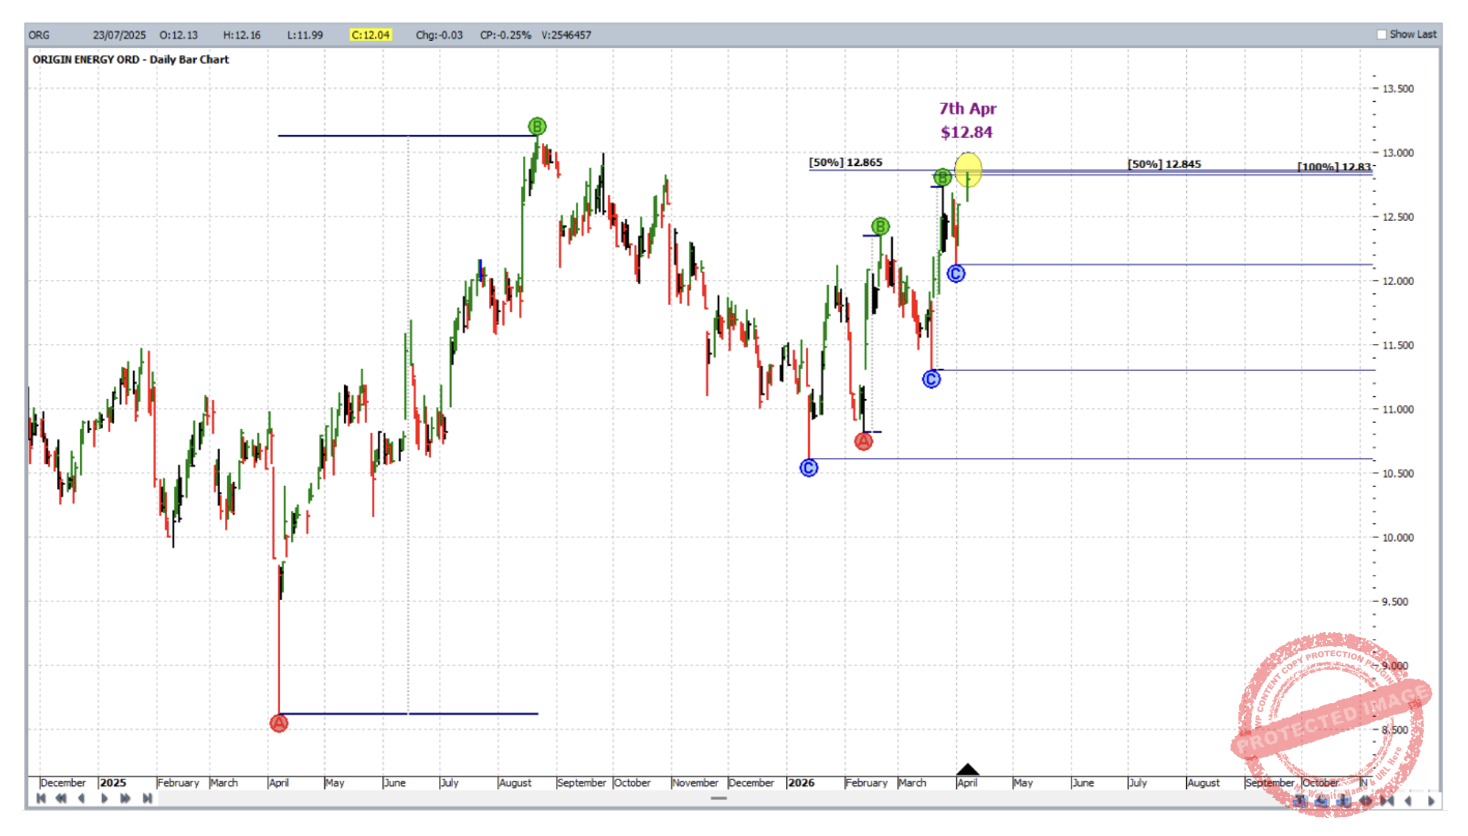
Back to the stock market this month and a classic example of a Wheels within Wheels trade. Those trained at Active Trader Program Online Training (ATPOT) level will be familiar with the Wheels within Wheels spreadsheet and how it can be used to log projected milestones and resistance levels and consequently become aware, in advance, of a looming price cluster. The stock of this case study is Origin Energy (ORG:ASX), and as at 7 April 2026 the market had reached a high of $12.84, only 2 cents away from $12.86 which was the 50% milestone of a big picture application of the ABC Pressure Points Tool (quarterly chart turning points). This is shown in the ProfitSource chart below in Walk Thru mode. It is followed by the details window of the ABC.
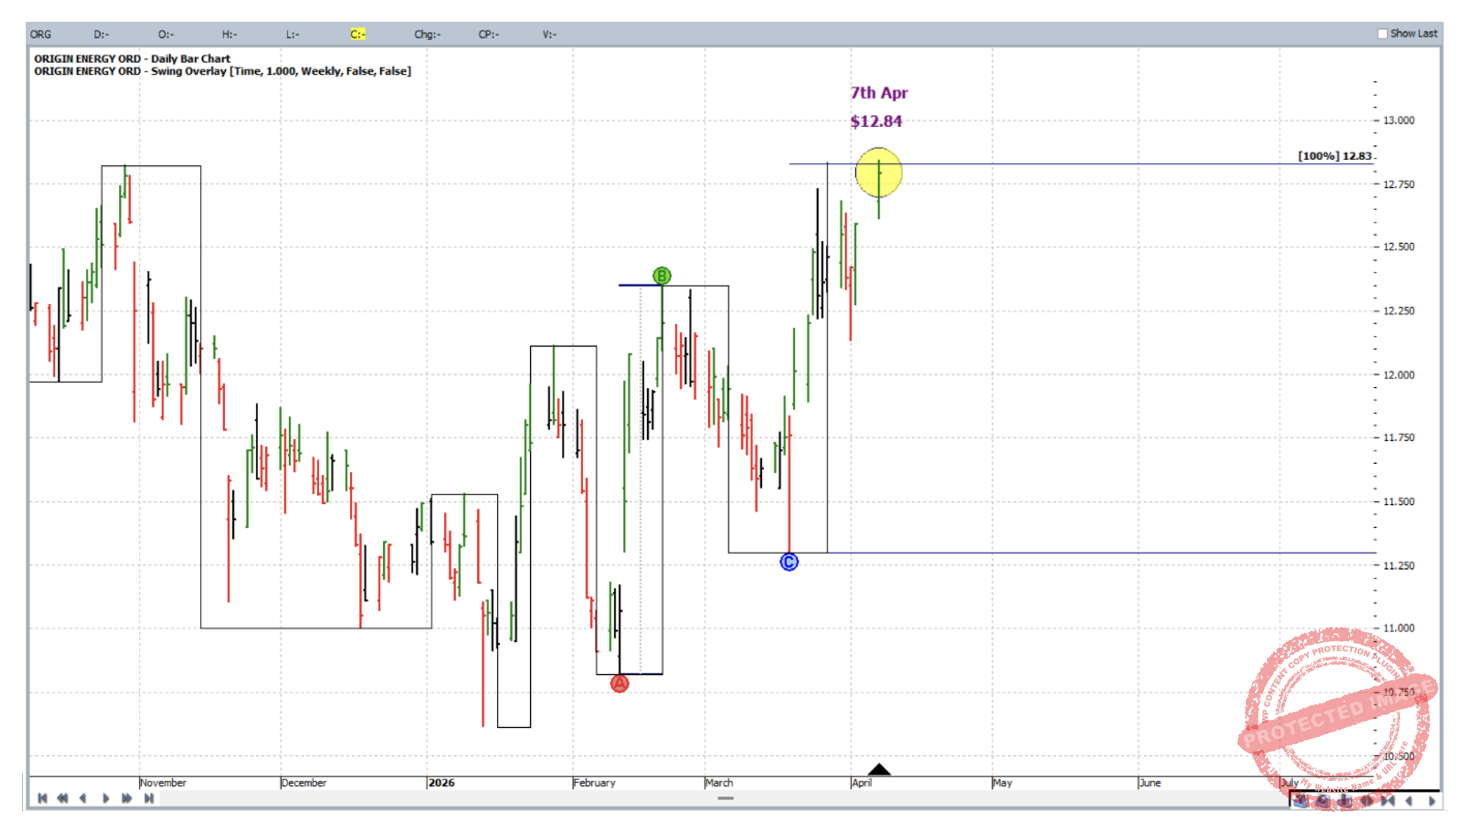
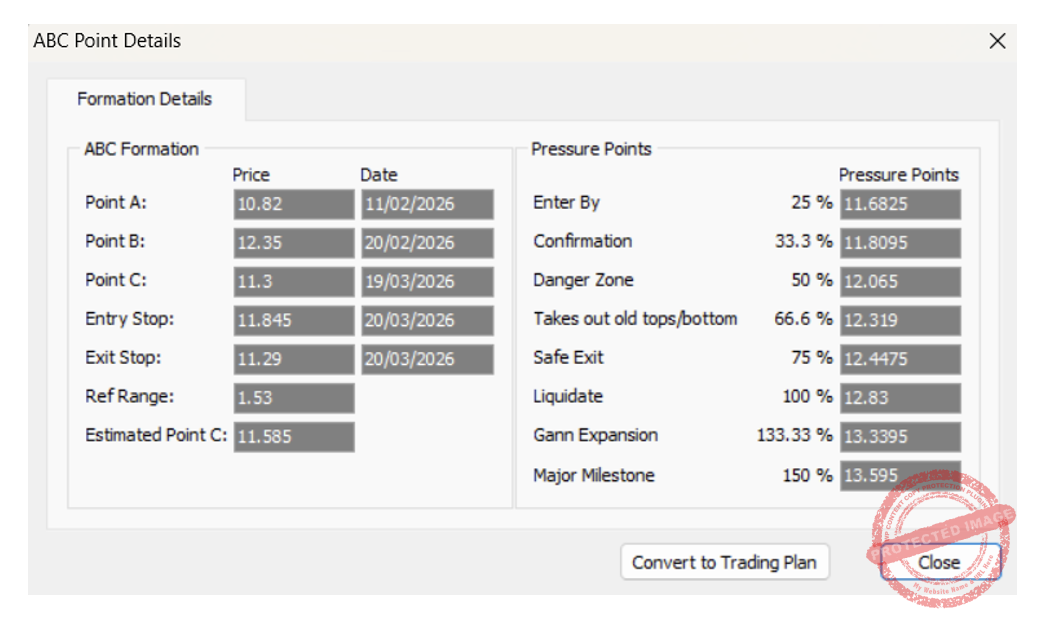
Zooming in we see that by 7 April 2026 this market had also reached the 100% milestone of the most recent application of the weekly chart ABC; this is shown below with the aid of the weekly swing overlay.
Zooming in further still, a smaller picture ABC application (based on swings which would appear on the 2-day swing chart) had its 50% milestone at $12.84 – right at the top of 7 April 2026.
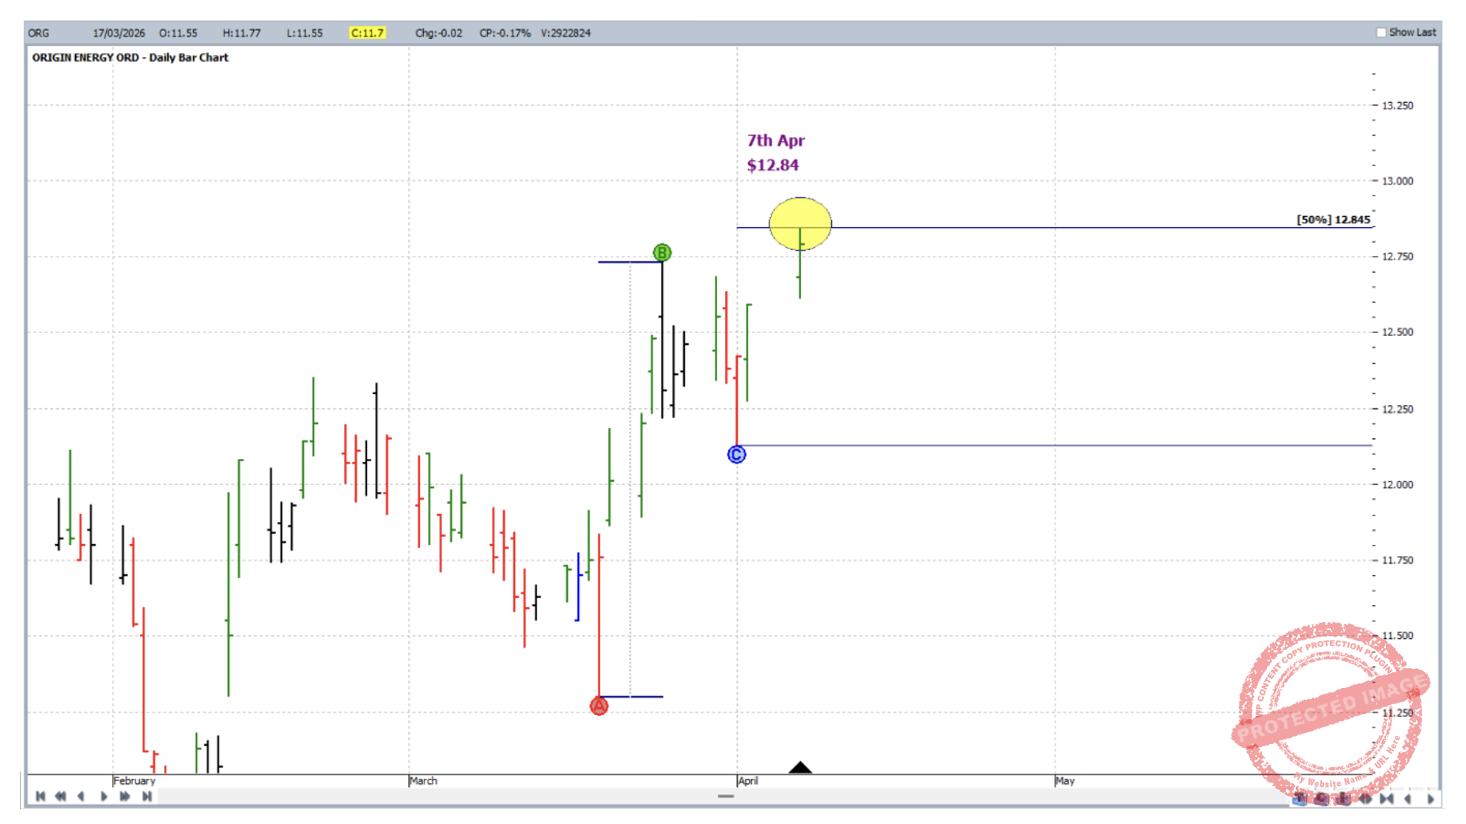
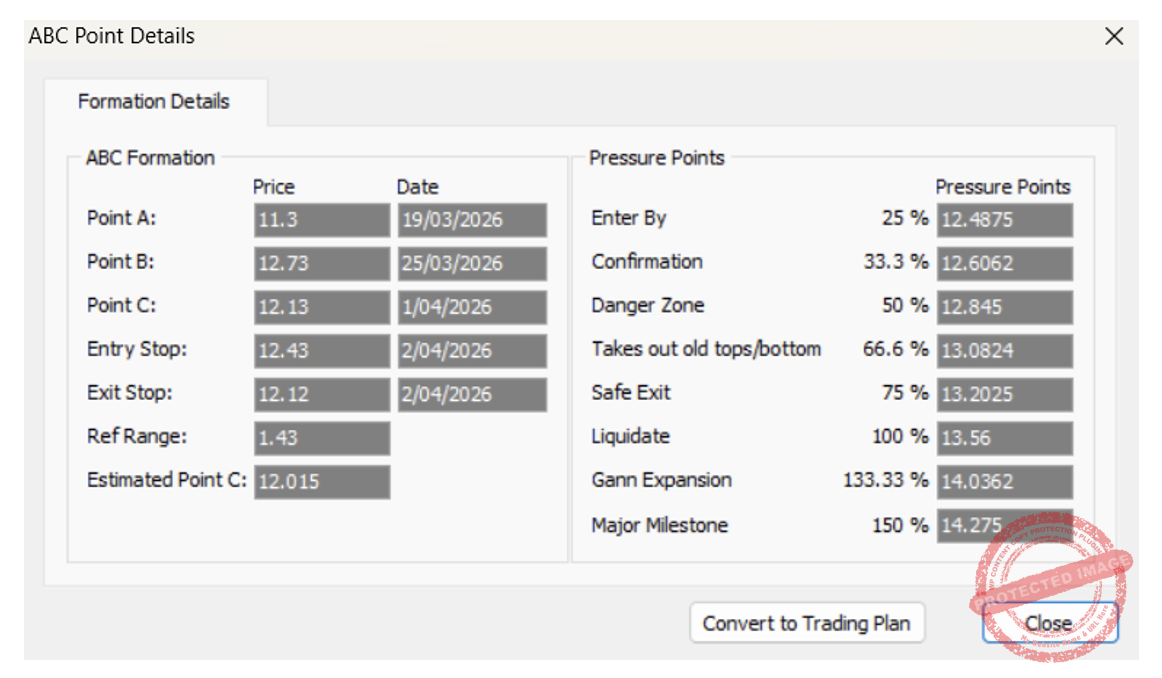
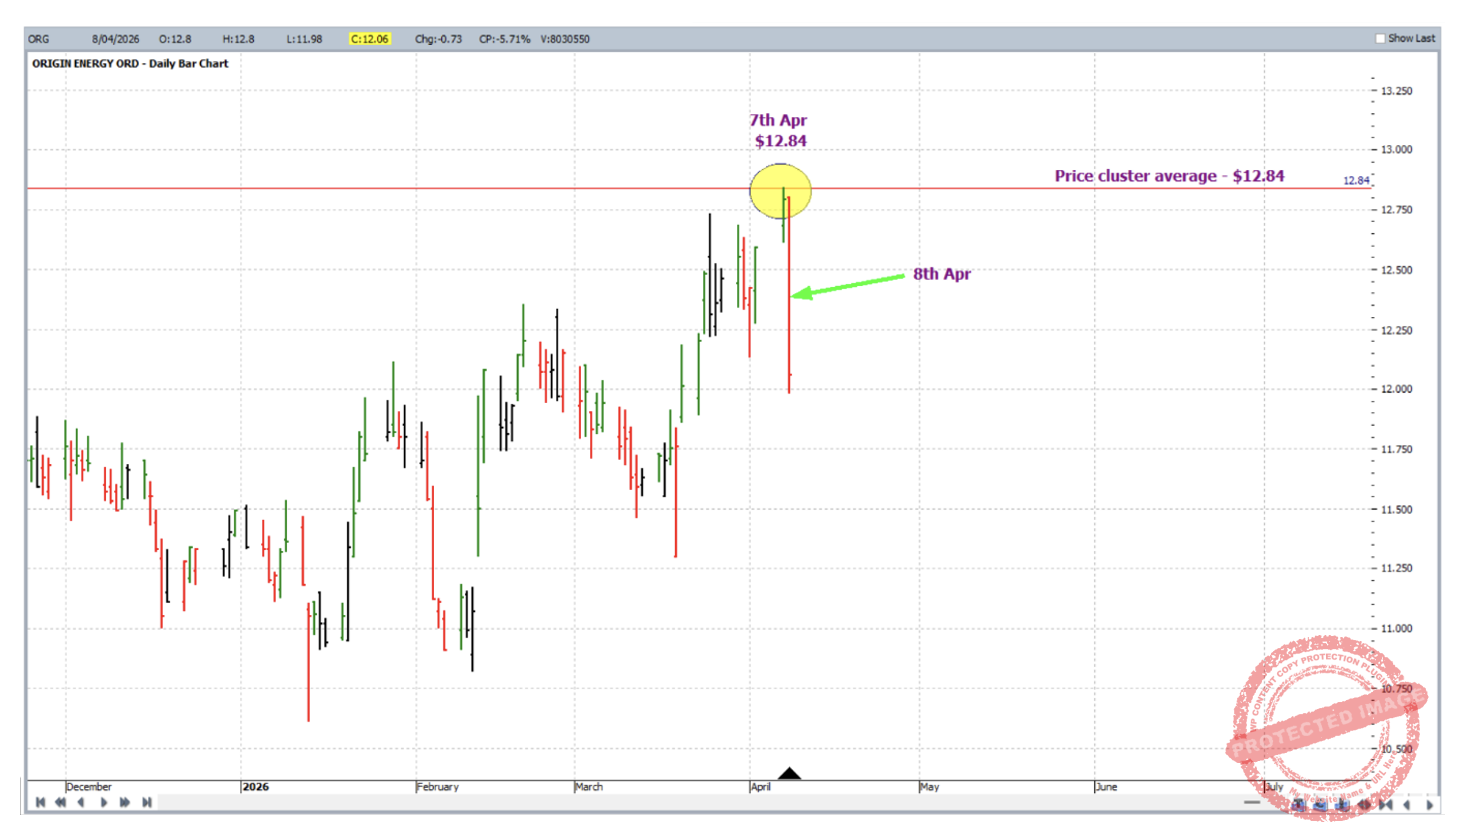
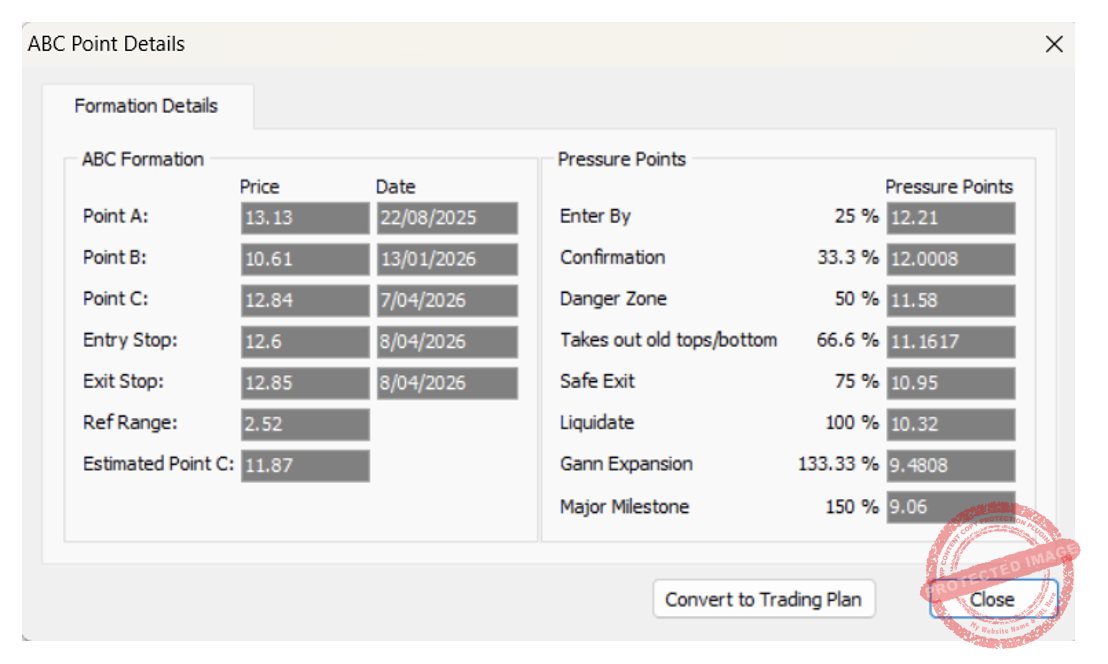
So far, a nice tight price cluster, with three inputs averaging out at $12.84; subsequently the down turning of the daily swing chart on 8 April 2026 had you short ORG at $12.60 with an initial exit stop loss at $12.85.
With a strong setup and the goal of a high reward to risk ratio, we zoom back out and chose a big reference range for the trade. In this case opting for the last monthly swing down as the AB range, and Point C of course our potential high of 7 April 2026. This is shown below with the aid of the monthly swing chart overlay.
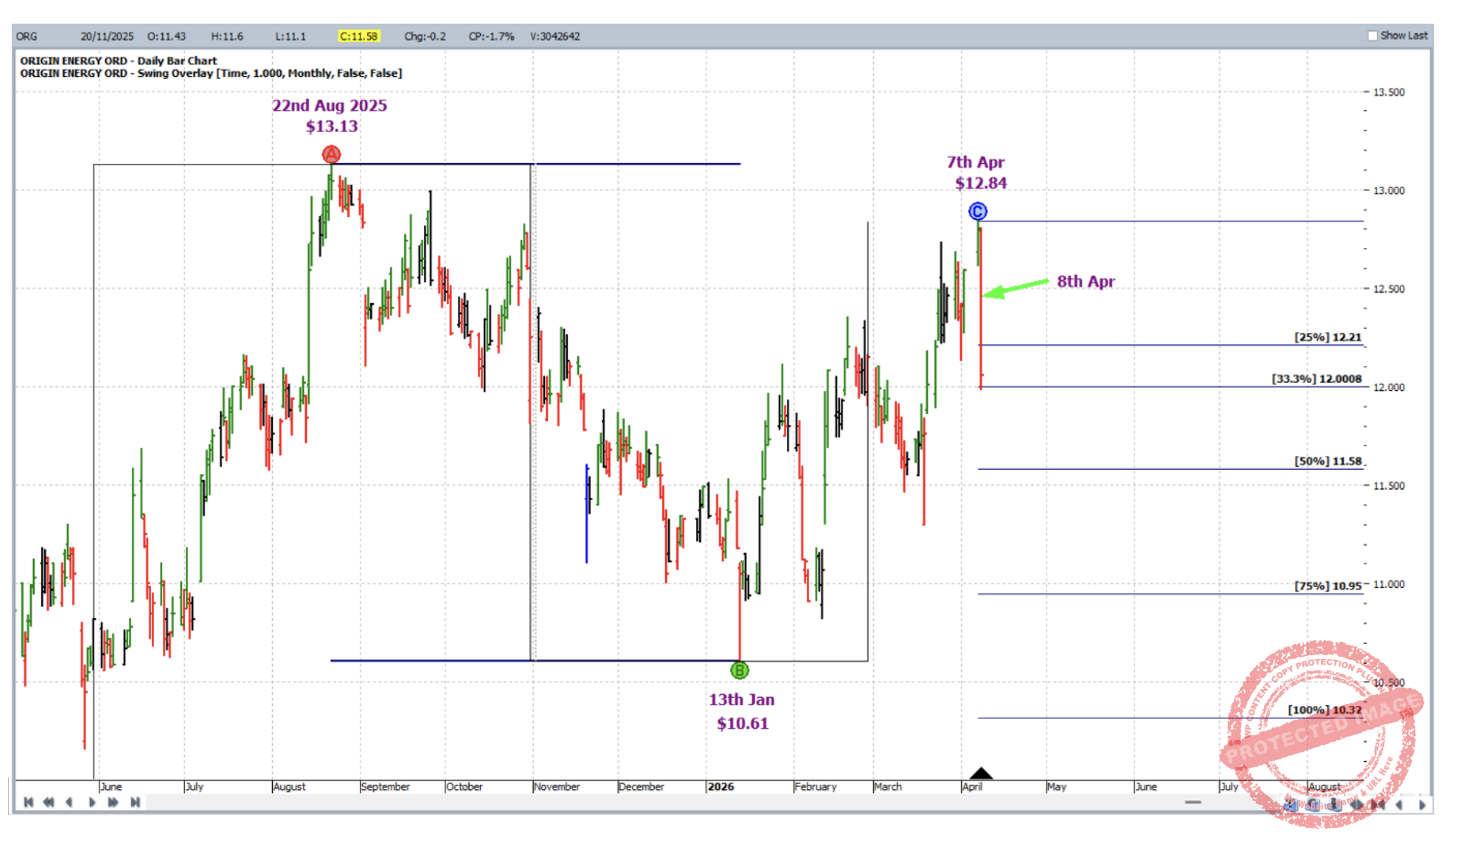
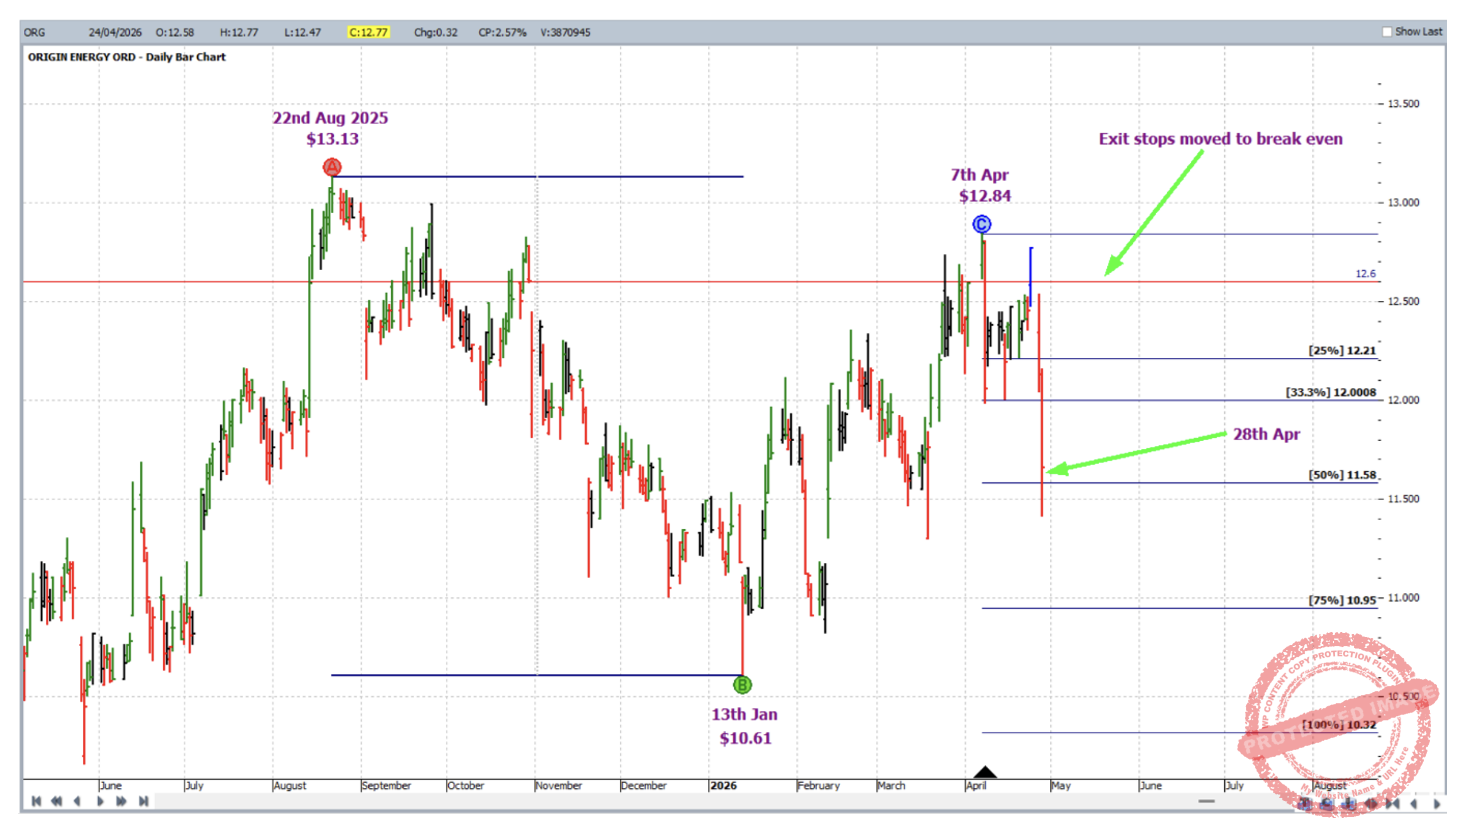
With the trade to be managed as though a large ABC, on 28 April 2026 the market reached the 50% milestone and exit stops were moved to break even.
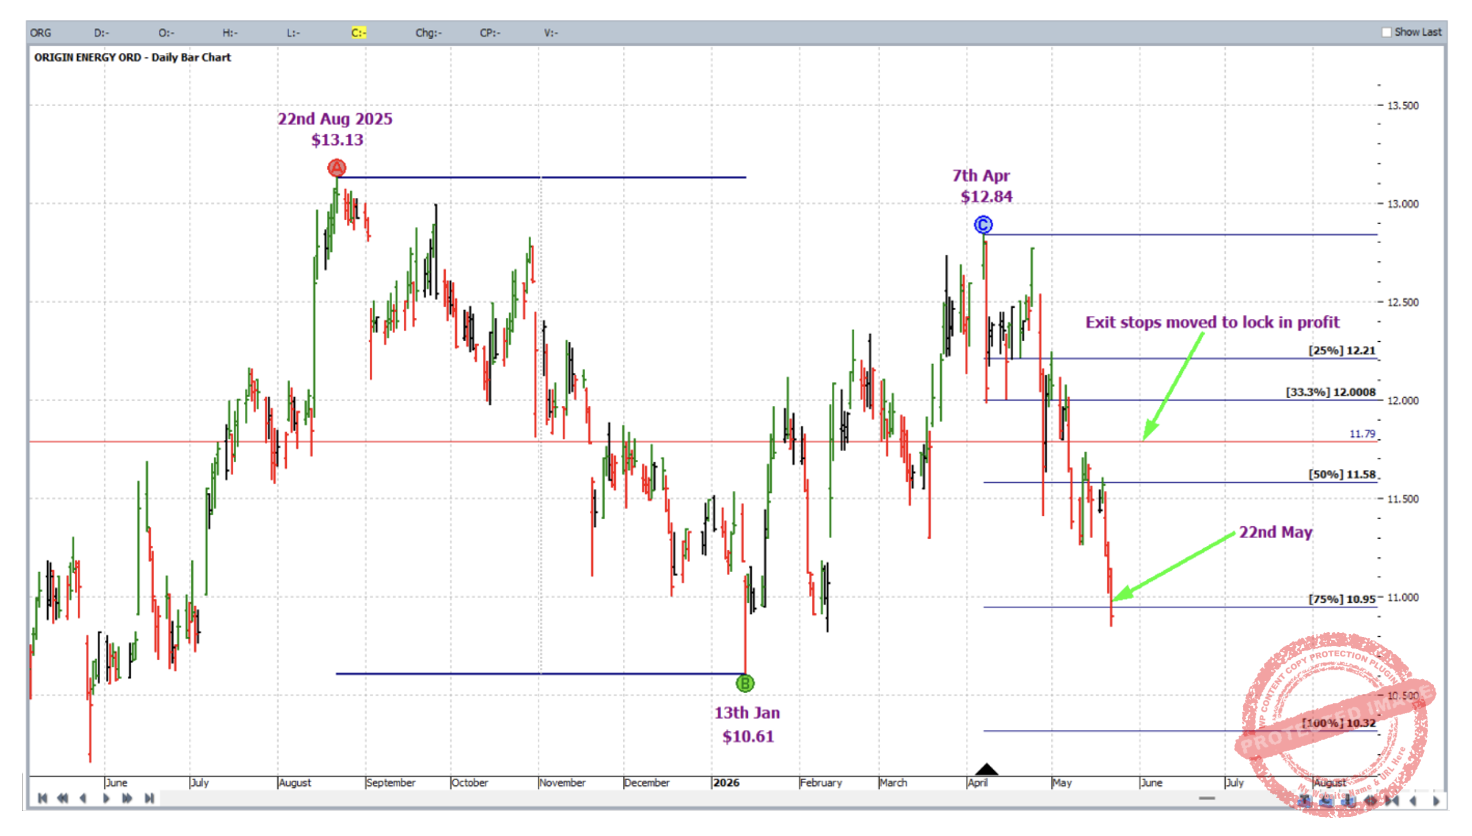
On 22 May 2026 the 75% milestone was reached and exit stops were moved to one third of the average weekly range (around 21 cents at the time) above the 50% milestone to lock in profit.
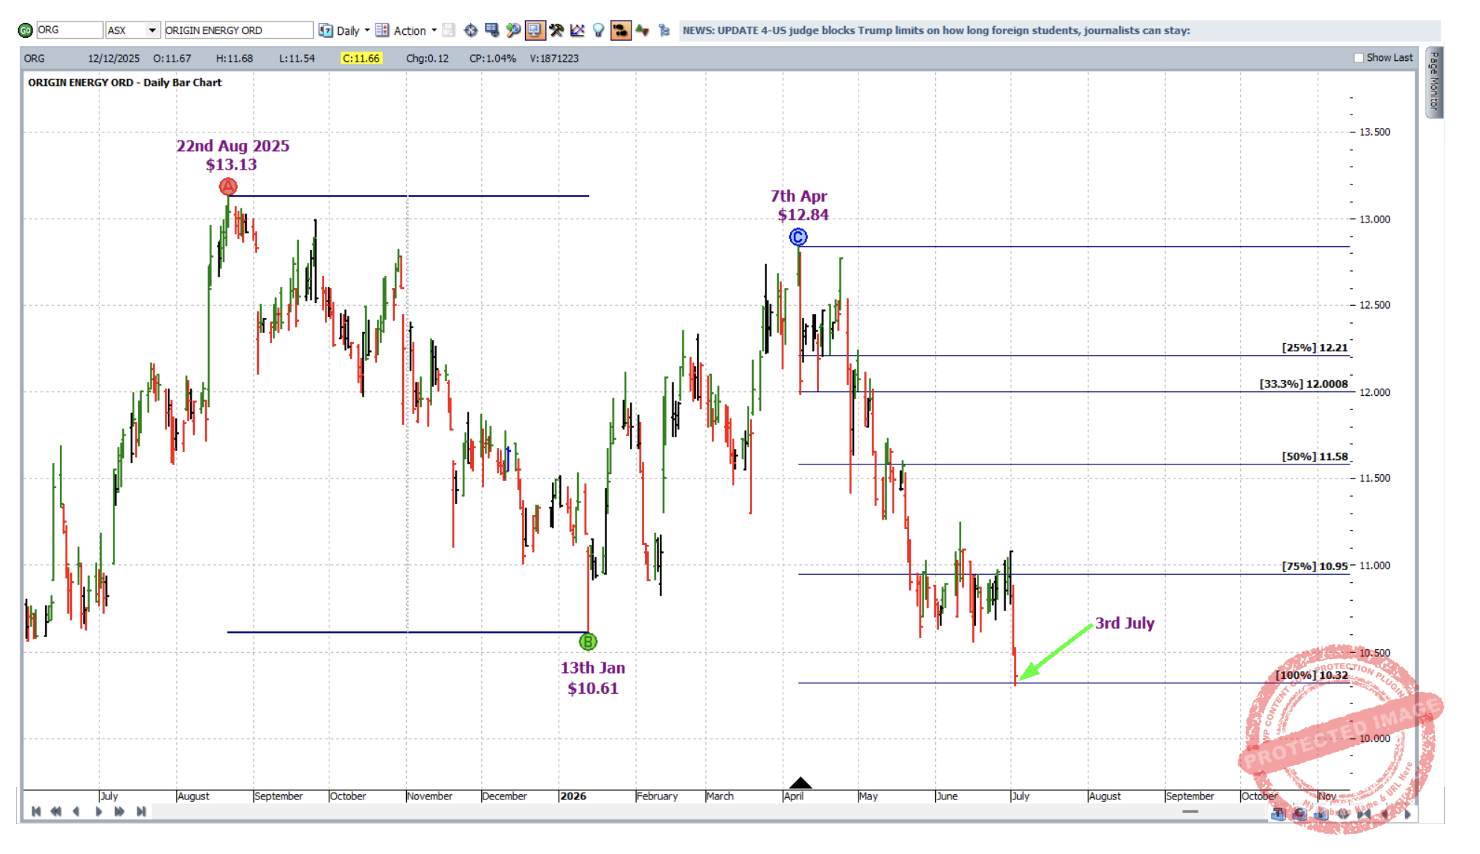
On 3 July 2026, the market reached the 100% milestone where the position was bought back to close the short trade at $10.32.
Now for a breakdown of the rewards. In terms of the reward to risk ratio:
Initial Risk: 12.85 – 12.60 = $0.25 = 25 points (point size is 0.01)
Reward: 12.60 – 10.32 = 2.28 = 228 points
Reward to Risk Ratio = 228/25 = approximately 9 to 1
If 5% of the account size was risked at entry the percentage gain in account size would be as follows:
9 x 5% = 45%
If 5% of a $10,000 account was risked, i.e. $500, the reward would be:
9 x $500 = $4,500
Below is a single chart containing all three analysis inputs. As an exercise, see if you can reproduce it exactly as it is!
It’s no fluke. This stock behaves in a way according to how David taught and how Gann taught. Below are two more recent pieces of analysis.
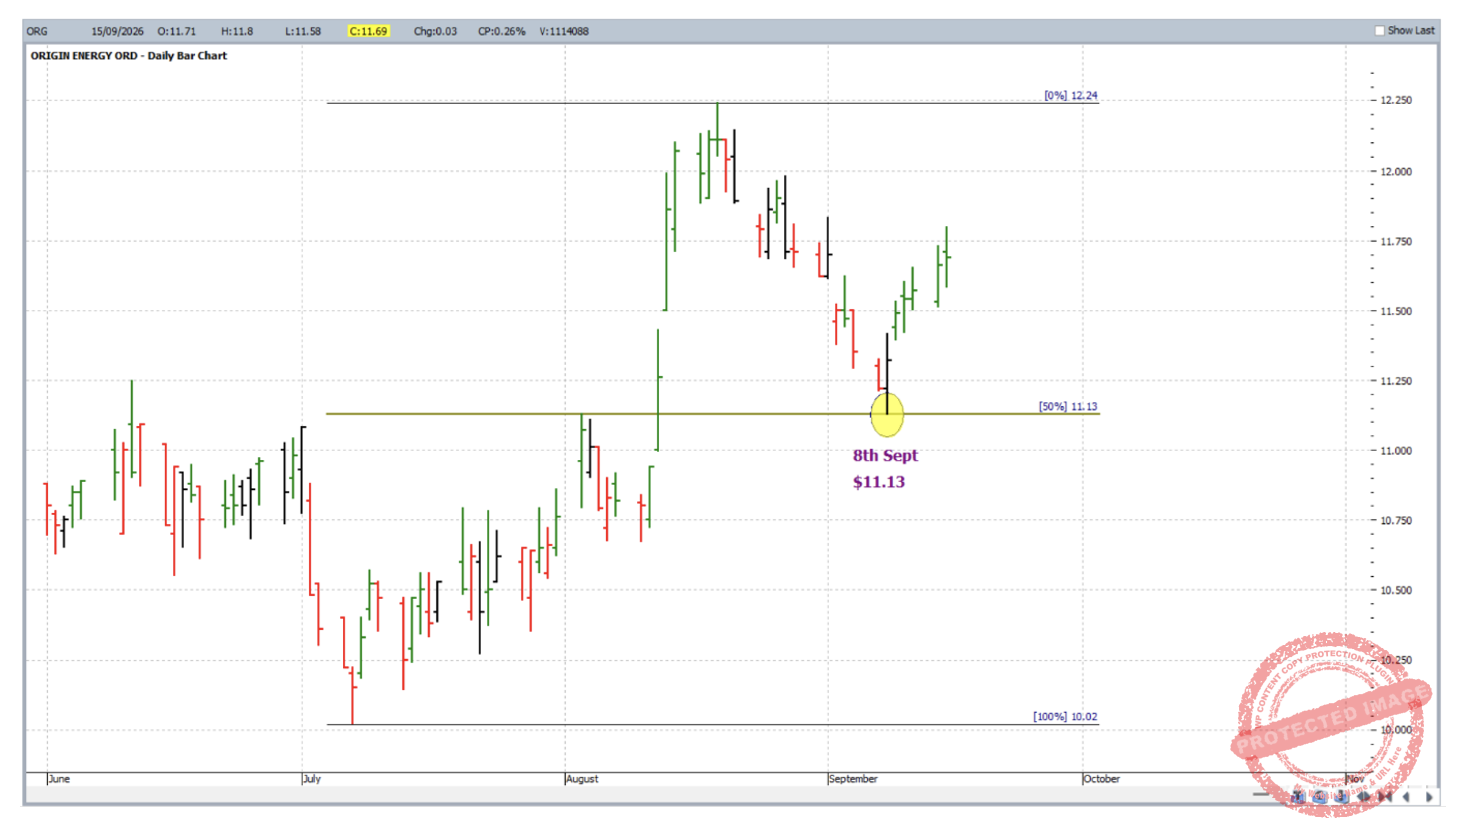
An exact 50% retracement of its July-August 2026 range into the low of $11.13 on 8 September 2026, as illustrated with ProfitSource’s Gann Retracement Tool.
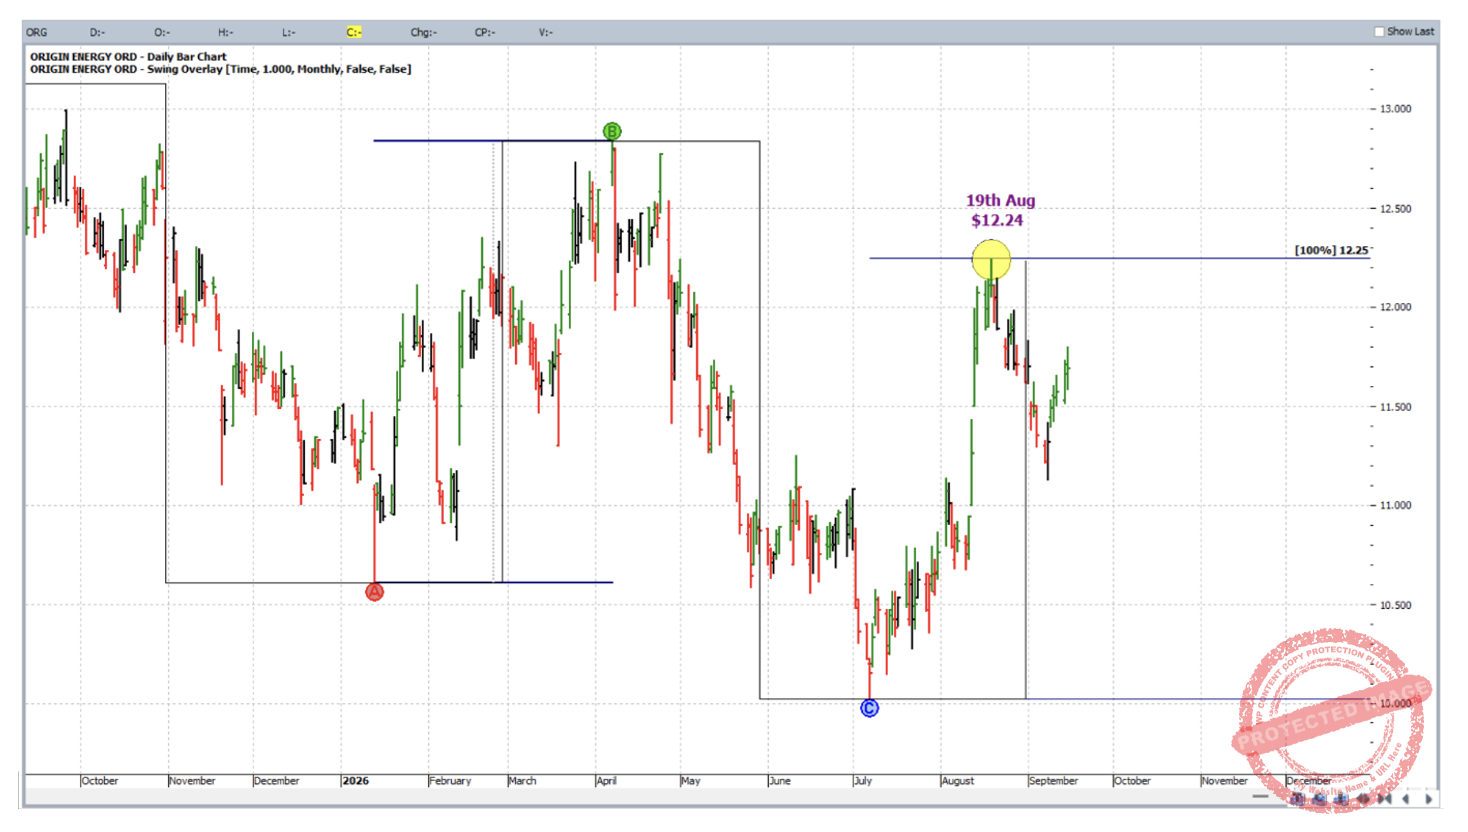
The 19 August 2026 high was but a point shy of the 100% milestone of the ABC applied as below to the turning points from the monthly swing chart.
Even more similar analysis on ORG can be found in our monthly newsletter from December 2022.
On a final note, our Ultimate Gann Course students might notice that the weekly chart analysis of the case study trade was part of some price analysis taught only in the Ultimate Gann Course manual.
Work hard, work smart.
Andrew Baraniak