
The Value of a Single Chart
Doing the simple things well, is one of David’s more well-known quotes and in this month’s discussion I want to focus on the value of a single chart. The challenge will always be a single chart for one trader may have too little or too much information on it. So, I challenge you to create or recreate as many charts needed to layout the information in a way that suits your comprehension.
Our coaching program for the Ultimate Gann Course uses a mantra of Analysis, Interpretation and Execution. For me this is the clearest way I can explain how I see markets and the different phases or mindsets I undertake when assessing a setup. Analysis is the area we spend the most time in our growth phase as a trader, as we spend incredible amounts of time adding multiple layers of techniques over varying time frames to give us a suitable data set to make a decision.
I see traders getting this aspect right and wrong all the time, not having enough depth to make a decision, or so much that it makes decision making extremely difficult as there will always be some data that may not align. To quote David again, he said if he had a fault, it was, he made it look too easy, that is, we show the textbook examples a lot but not the more borderline or challenging decisions.
There are examples of where a market will provide a setup that just clicks, I think of Gus’s 14th February high or some of Darren’s work on the Yen. They are compelling, but sometimes there will not be the same level of analysis complementing each other so how does one tackle that?
A single chart can sometimes allow for clarity of the overall position of markets and help steer us further into the detail. We have been following Gold as a market, and it has been one that delivers some wonderful Classic Gann Setups. It’s also a market that will do enough to mug you!
Chart 1 is price based and uses the work of 50% retracement to define the recent market. I have circled the 3 relevant 50% levels in orange. You may also note I have based the range of a slightly lower top in March this year rather than January.
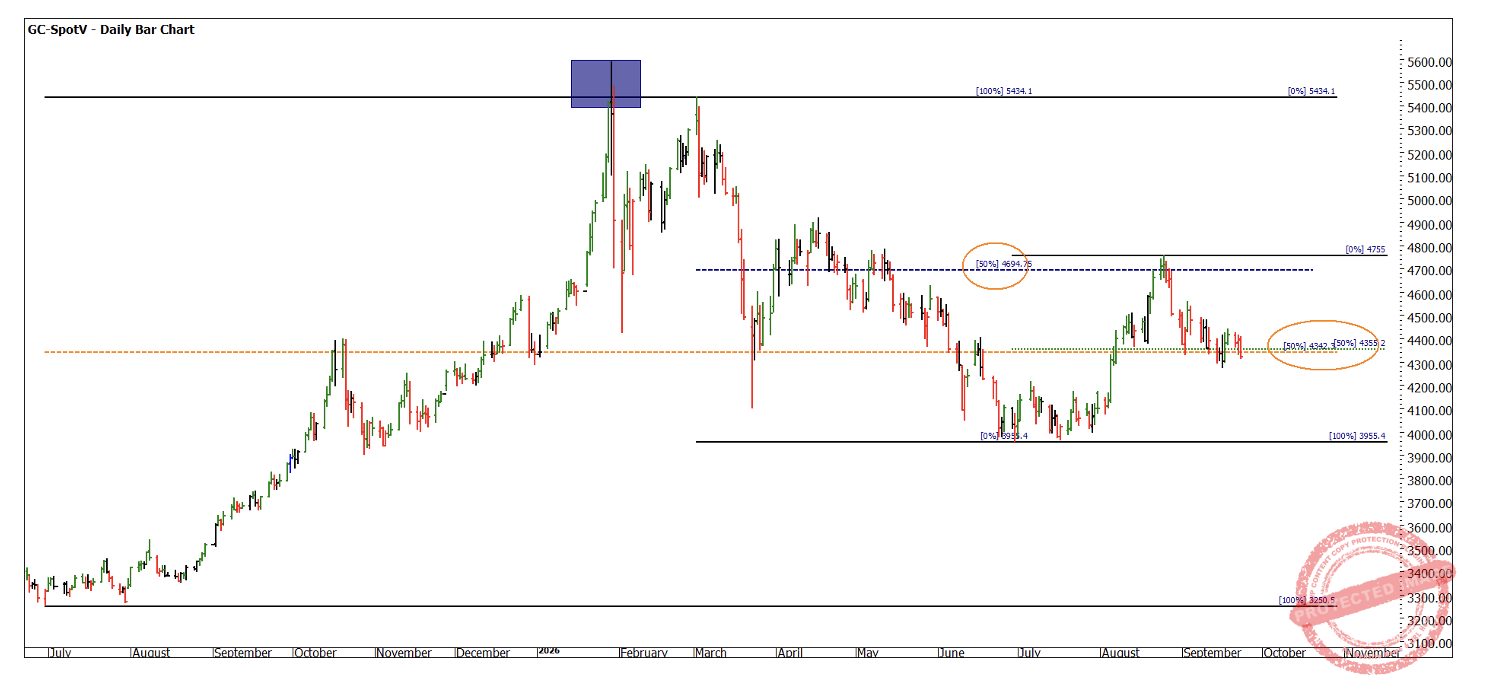
Chart 1 – Daily Bar Chart GC- SpotV
The main area to watch is the recent August top, this may have been a place to be short, and the current price action has two 50% levels clustering. The next leg in direction will likely be decided on what happens here.
Now that was not my one chart, I want to add the lens of Time to the equation, I would be happy to analyse the chart with Price and Time on it, but let’s keep it less cluttered for now.
Chart 2 is a basic time trend chart, days up and down. Then an added lens of days between bottoms to bottoms and tops to tops. I hope you can view this chart with a piece of paper and pen and record all the relevant analysis points and how you would use them to frame up your view on this market.
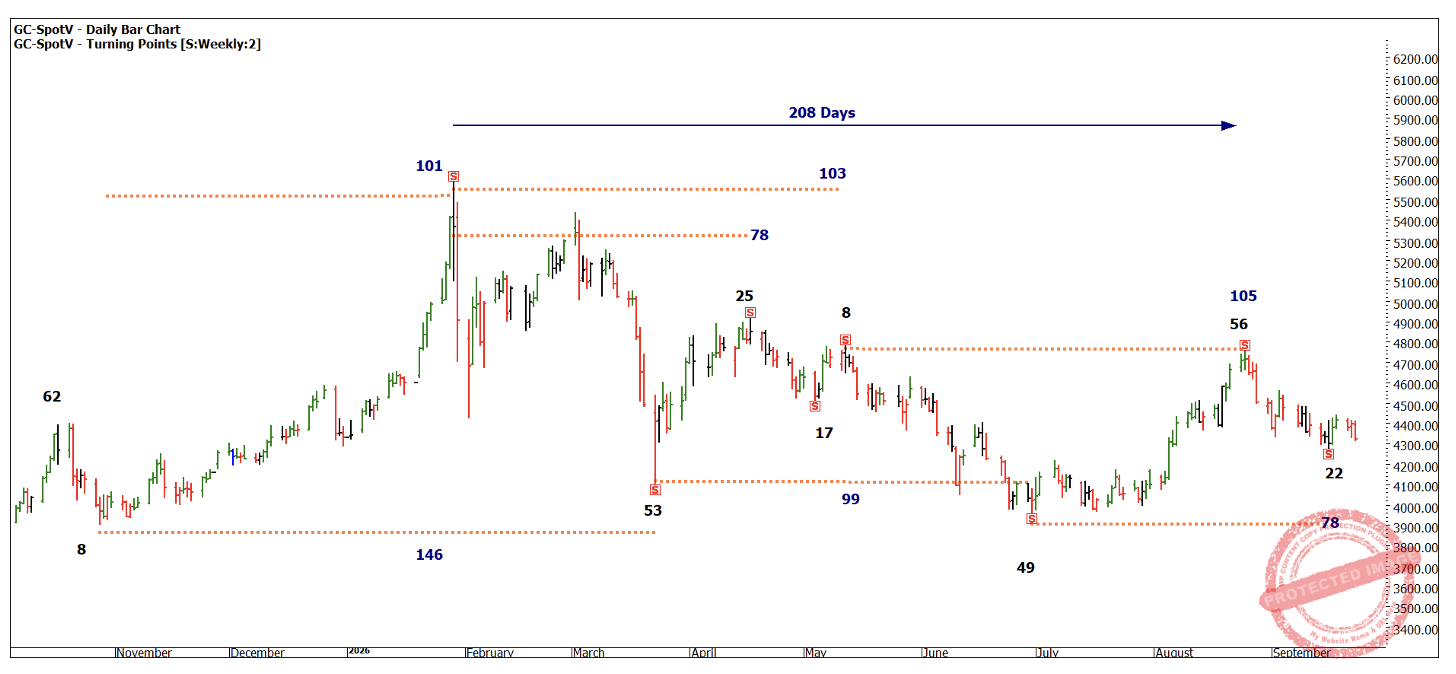
Chart 2 – Daily Bar Chart GC-SpotV
I use a 2-week swing chart to nominate my tuning points and the figures in black are the calendar days up and down.
I would encourage you to go back further than what this chart shows, as that will also expand your understanding.
The numbers we see are 53, 25,17,8, 49, 56 and 22.
The great news is many of the ranges in time are 50% of the previous or multiples like 300%. They are also close enough to repeats in some cases.
If I was to construct a swing chart in time, the current swing up is 56 days, greater than 8 and 25. The 22-day run down is approximately 50% of the 49-day run down. So, could we be about to see a higher bottom in time? However, we would need to see several days up, and this is a lagging indicator.
To me of greater value is the repeating variable of approx. 50 days, we see this with the counts from 99, 101, 103,105 and 208 days. The repeat into the August 25th high may have combined with the 50% in price for a short position, or at least to close out any long positions.
We have seen a 78-day repeat into the 16th of September, this could have been a signpost to consider the long side, we have not seen a strong push to the upside, if this pattern was to hold, we should see this area hold.
The challenge will be from here, a push higher or lower will be guided by the swing chart. There is enough information here to project a time frame forward to an area we could watch for a weekly swing turn. The 16th of October and the November seasonal date could be areas to consider.
Good Trading
Aaron Lynch