Trading the June Seasonal Date
By the time this article goes to air, the June seasonal date will have come and gone. In Sydney, Australia, the exact timing this year is Saturday, 21 June at 12:42 pm.
Some years, the June seasonal date proves to be an excellent time to watch for a market turn. As we move into the date window, it’s a good opportunity to tighten our focus and have our trading plans ready.
David Bowden often spoke about volatility appearing in the lead-up to key seasonal dates – it gave him confidence that a meaningful reaction might follow. Right now, though, volatility is noticeably absent. The SPI200 seems fairly subdued, with small daily ranges, and over the past week and a half, it’s only moved about 166 points down from the 11 June high of 8651.
During the recent Ultimate Gann Course Coaching, Aaron mentioned waiting for an “event” to trigger volatility around the seasonal date. As I write this on Thursday, 19 June, perhaps we will see something over the next few days.
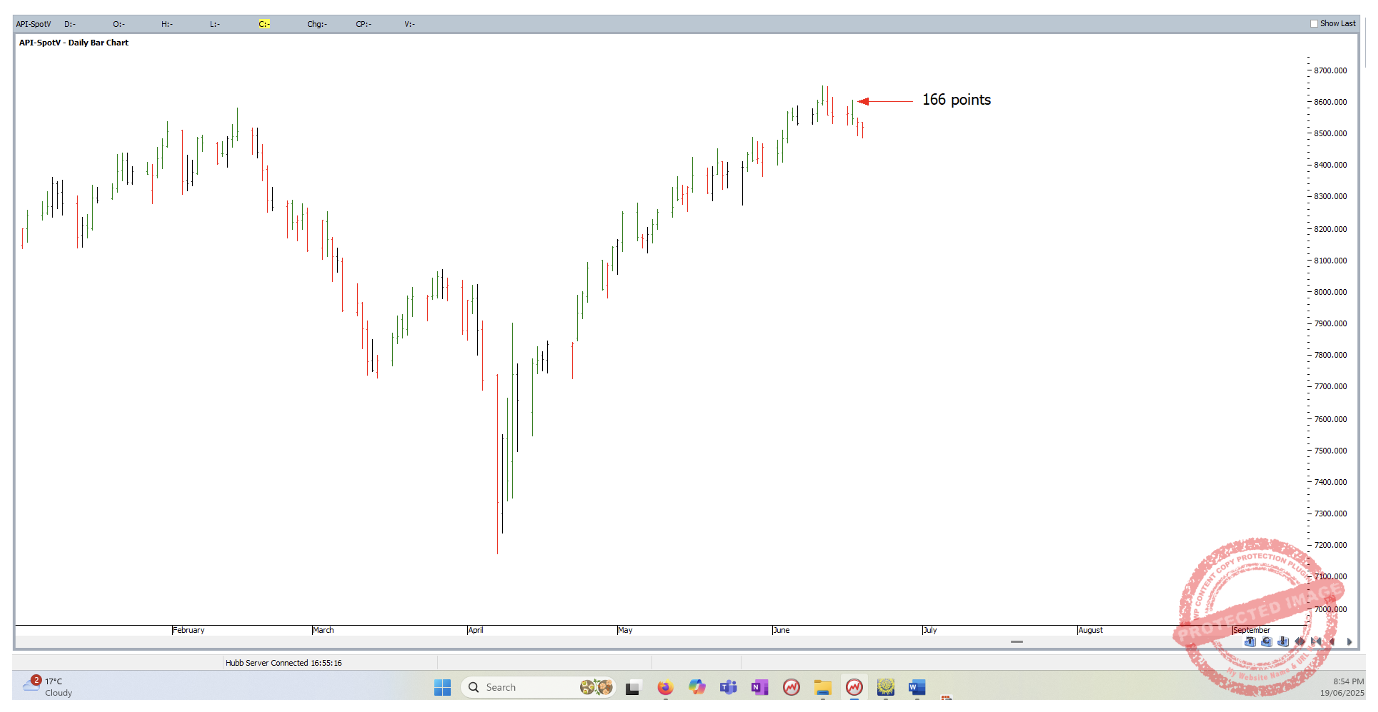
Chart 1
Referring to my Time by Degrees wall chart, I see that the change of signs at 00 degrees has already produced two weekly turns this year and two monthly turns last year.
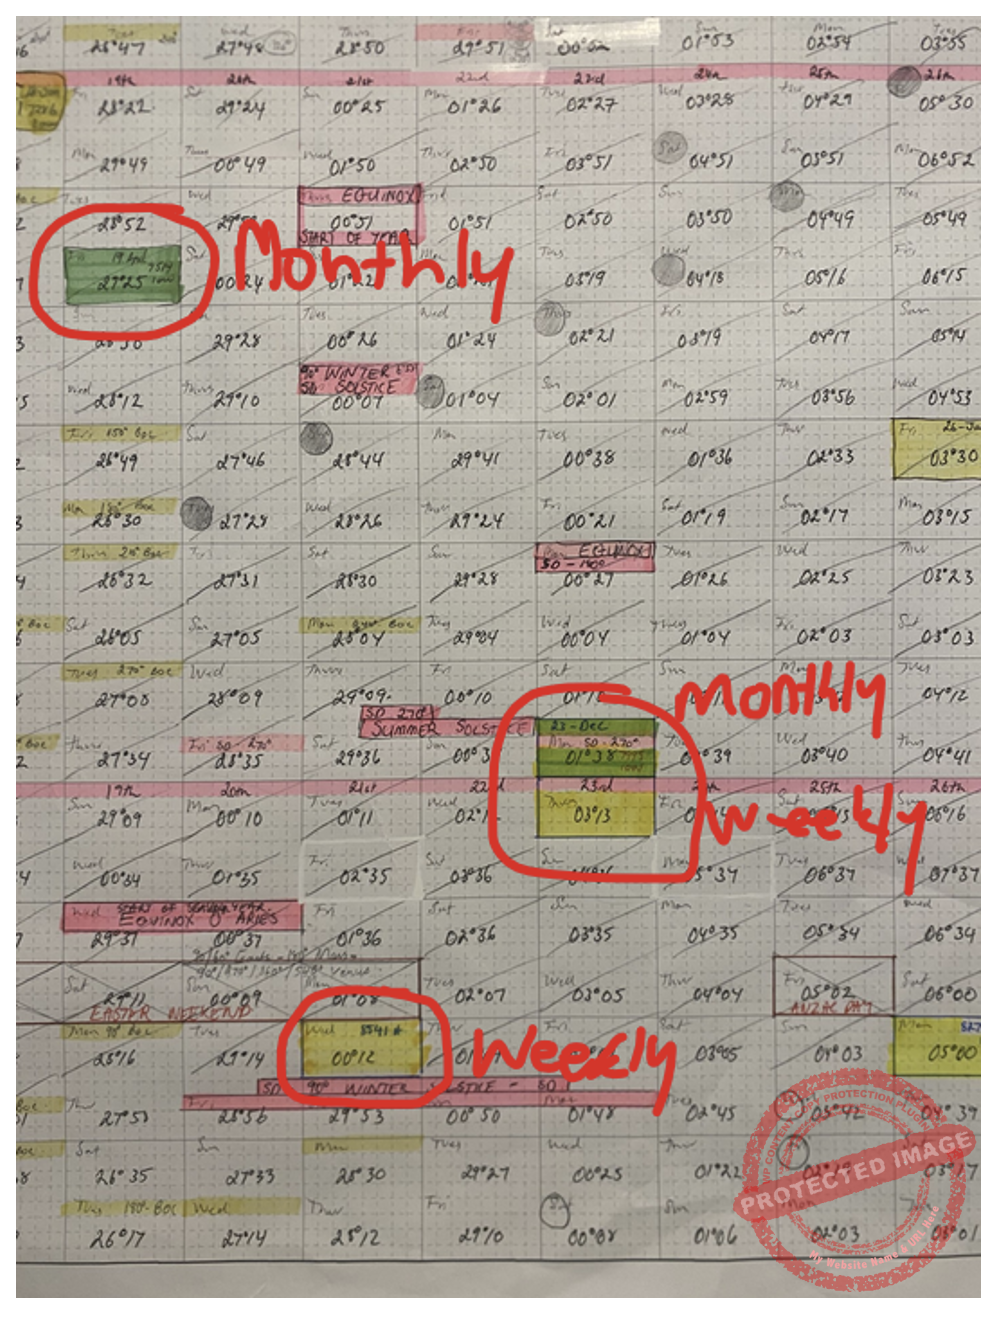
Chart 2
If we do get some volatility around Friday, 20 June or Monday, 23 June, it would be:
- 180 degrees from the December 2025 low at 1°38’
- 150 degrees from the January 2025 date at 3°13’
- 30 degrees from the 21 May high at 00°12’
This suggests we could still see a turn a day or two after the seasonal date – so don’t be surprised if it comes slightly late.
Another date worth keeping on the radar is the July seasonal date, which will be 90 degrees from the 7 April yearly low at 7172.
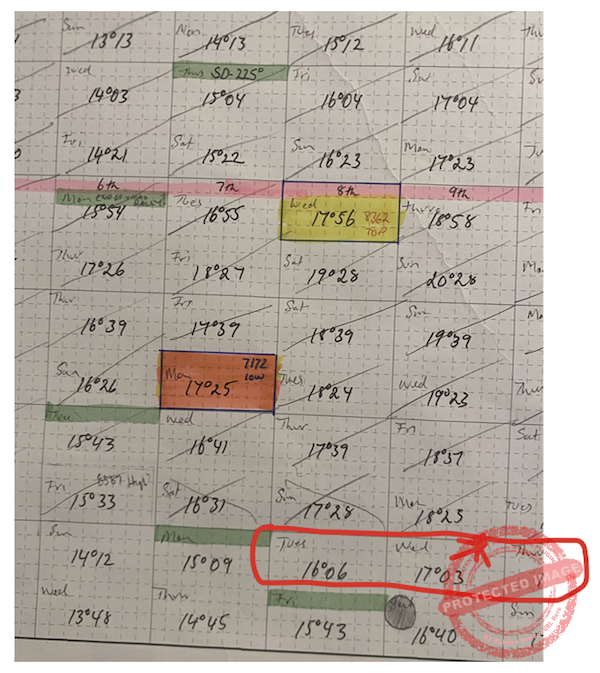
Chart 3
Looking back at recent price action, I can break down the last contracting weekly swing up:
- That swing was made up of three daily legs, with the third failing at the 50% level.
- A daily 200% Overbalance move of 124 points followed, then a contracting daily swing up of just 77 points.
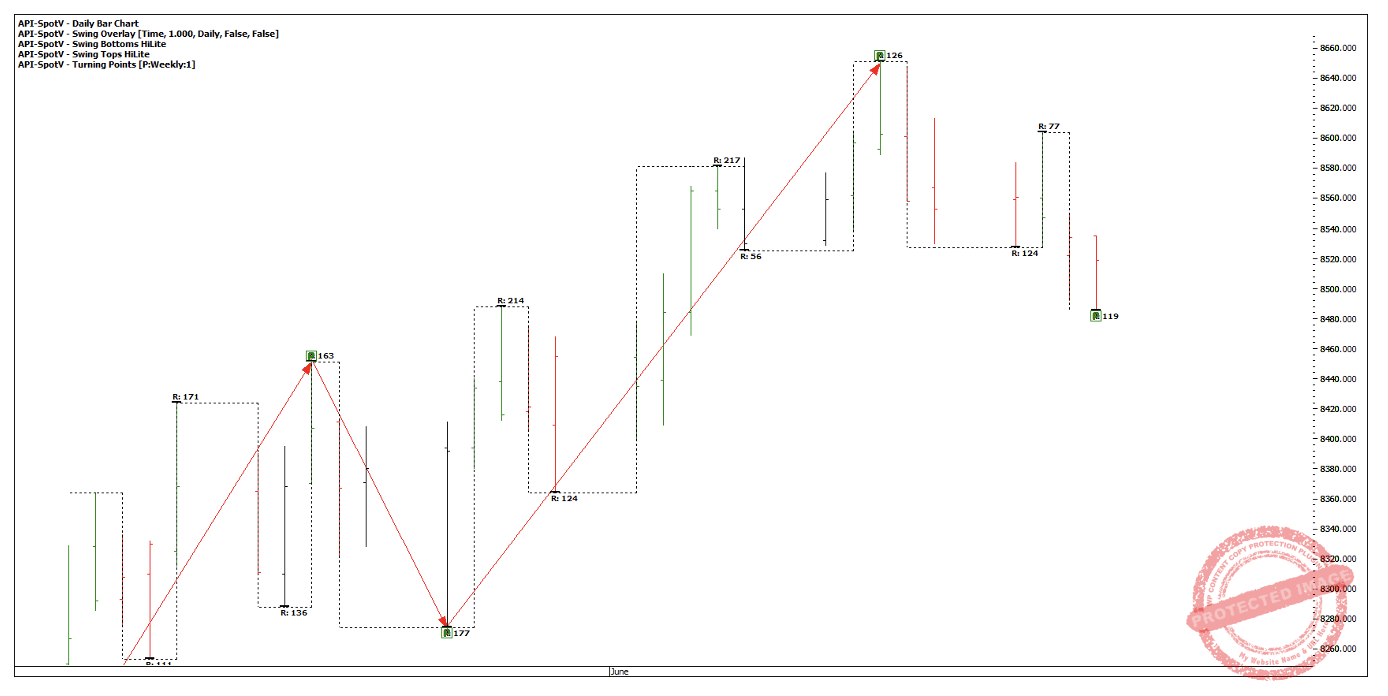
Chart 4
Revisiting my angle work from last month’s article, the 2×1 angle has done a good job of keeping me on the right side of the market. The recent daily lower swing top found resistance under the 2×1.
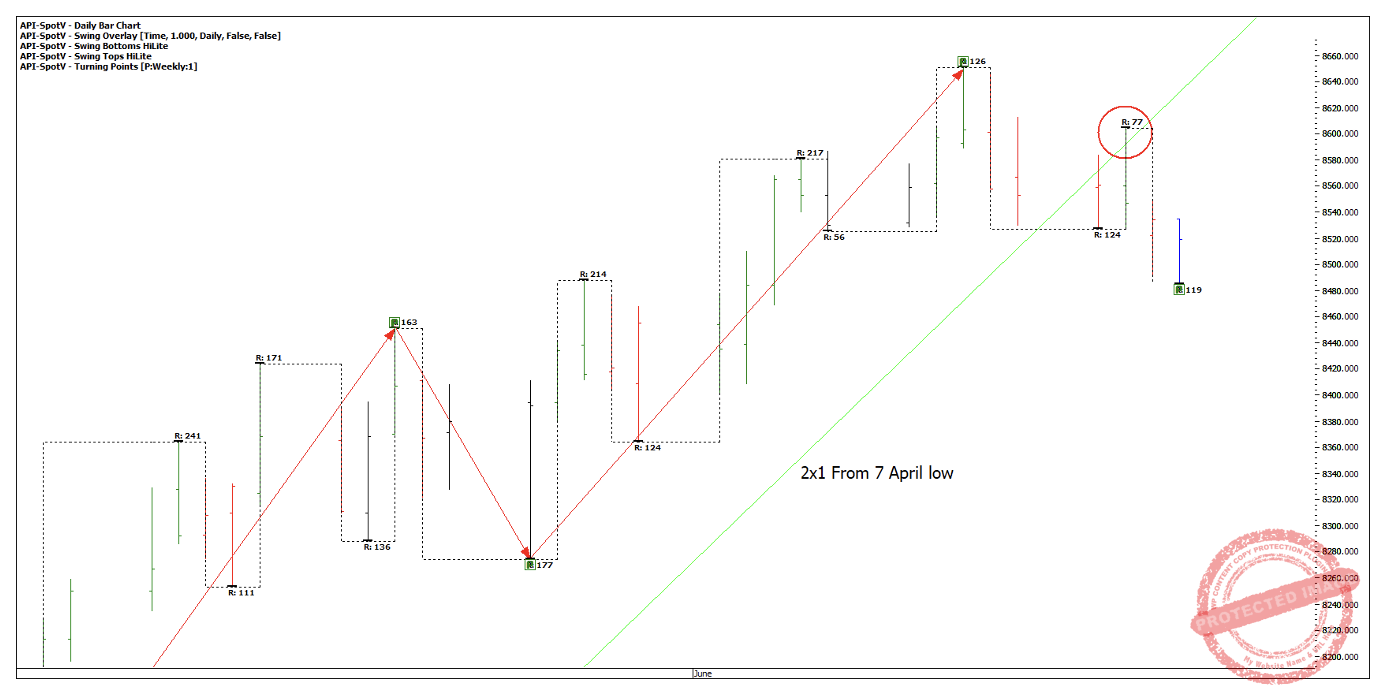
Chart 5
Applying the same angle theory from the 11 June high, the market is now finding resistance at the 1×1 and support from the 2×1. That helps rate the strength of this current move down and at this stage isn’t as strong to the downside as say the run up out of the 7 April low.
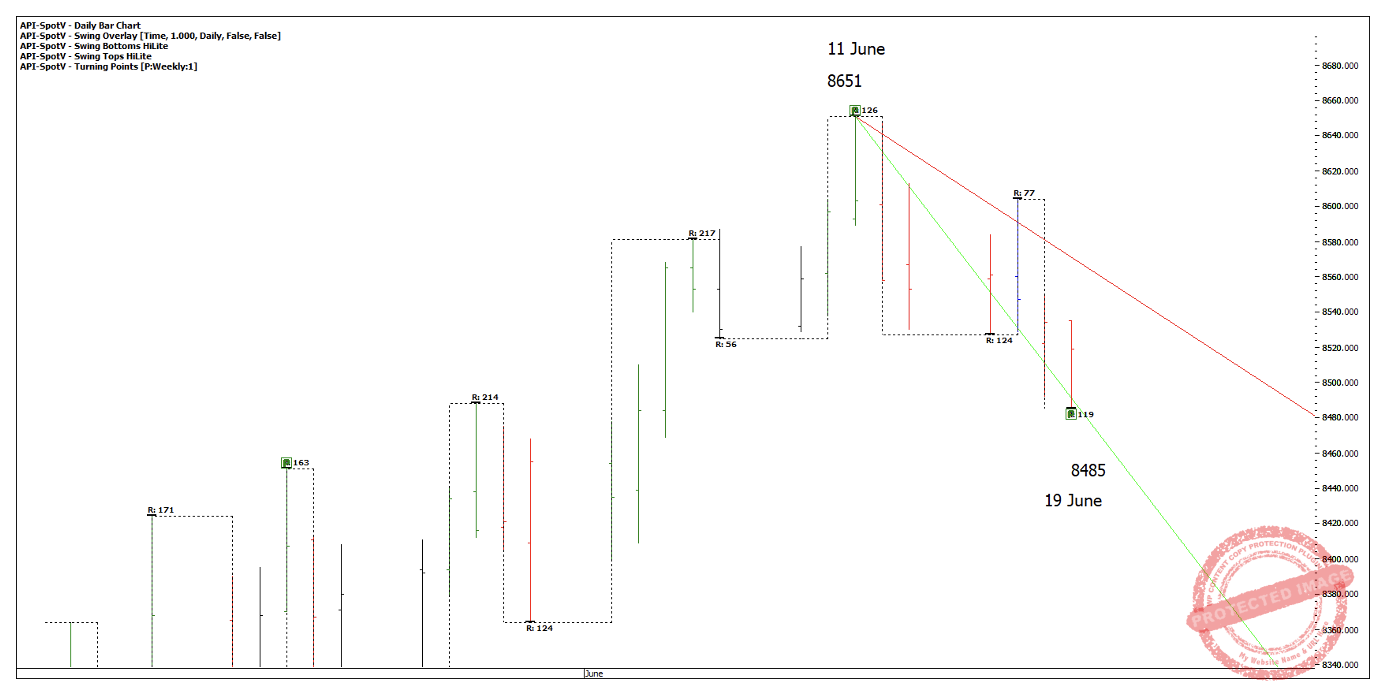
Chart 6
So now I’m watching all my price pressure milestones and Time by Degrees dates, waiting for a setup that aligns with my trading plan.
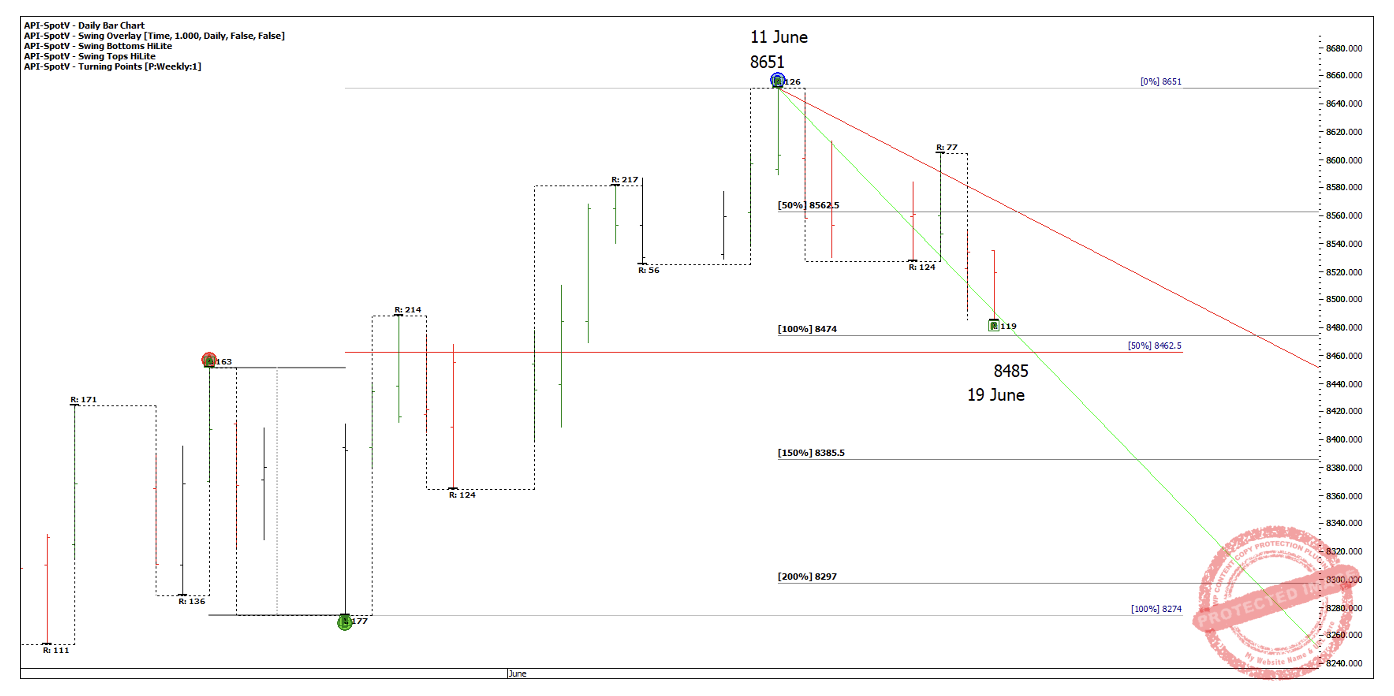
Chart 7
Using the road maps taught in the Master Forecasting Course, it suggests we might see a two-part pullback into late June or early July. Maybe it plays out, maybe it doesn’t – and that’s fine. What does matter is that I stick to my plan. The market will often surprise you with something you didn’t expect.
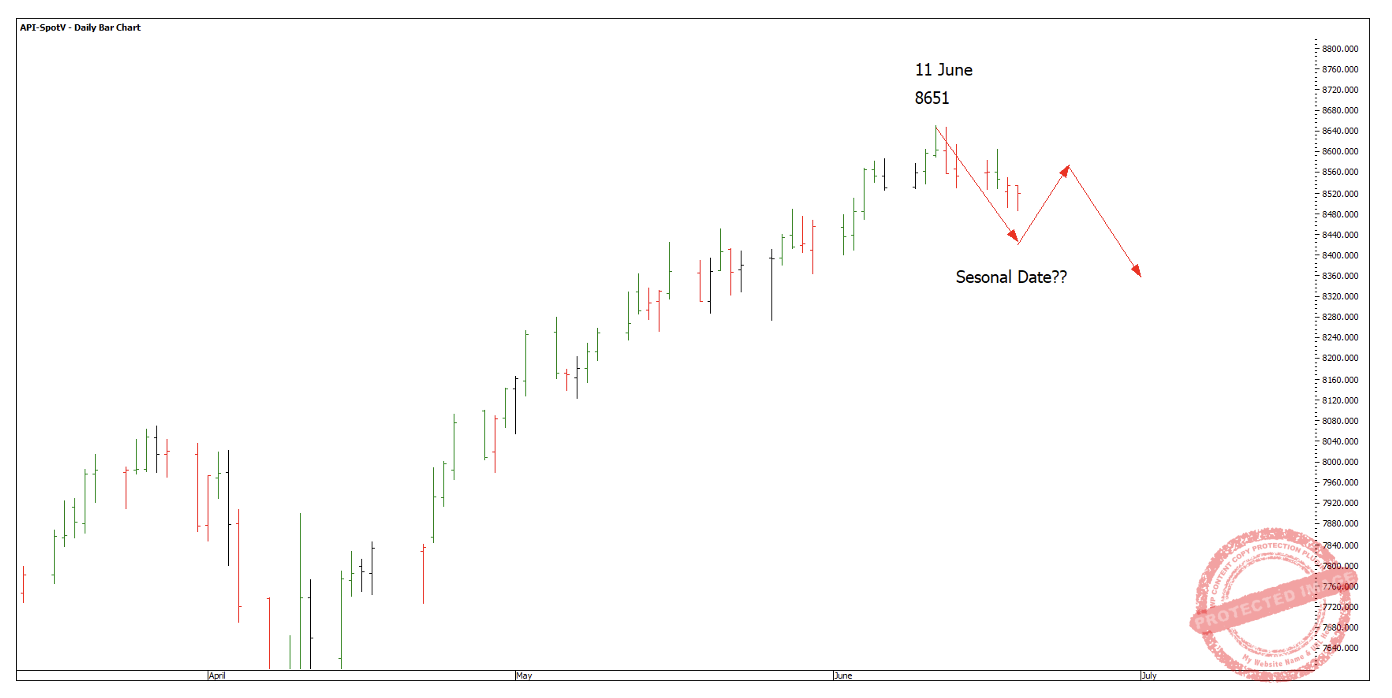
Chart 8
It’s also worth noting that the Nasdaq and S&P 500 haven’t had any meaningful pullbacks yet. That makes me wonder – did the Australian market just peak a little earlier?

Chart 9
Now that we’ve rolled into the September contract (API-2025.U), I’ll be watching both the contract month and continuous contract. I’ll continue to use my angles and swing chart ranges to assess the strength of any move and help guide me toward the right setup.
Happy Trading,
Gus