The Volume Indicator
For quite some time I used to hand chart volume on my daily bar chart. As a result of trying to simplify hand charting to a manageable level, I found It was one thing I was happy to read off the software.
Still, the benefit of hand charting is that you really get a feel for the technique and learn so much more about it. Actually, I will say that hand charting a technique is the best way to understand it!
Volume is an indicator that sometimes doesn’t give you too much insight but then at times when combined with Price Forecasting makes things very clear!
Let’s take a look at the recent months on the SPI200, as this has been a fantastic example of volume in action. Looking at the run up into the 2 March top of 9187, and picking a few random days to check volume, you can see there are a lot of days trading around the low 30,000 contracts. See Chart 1 below.
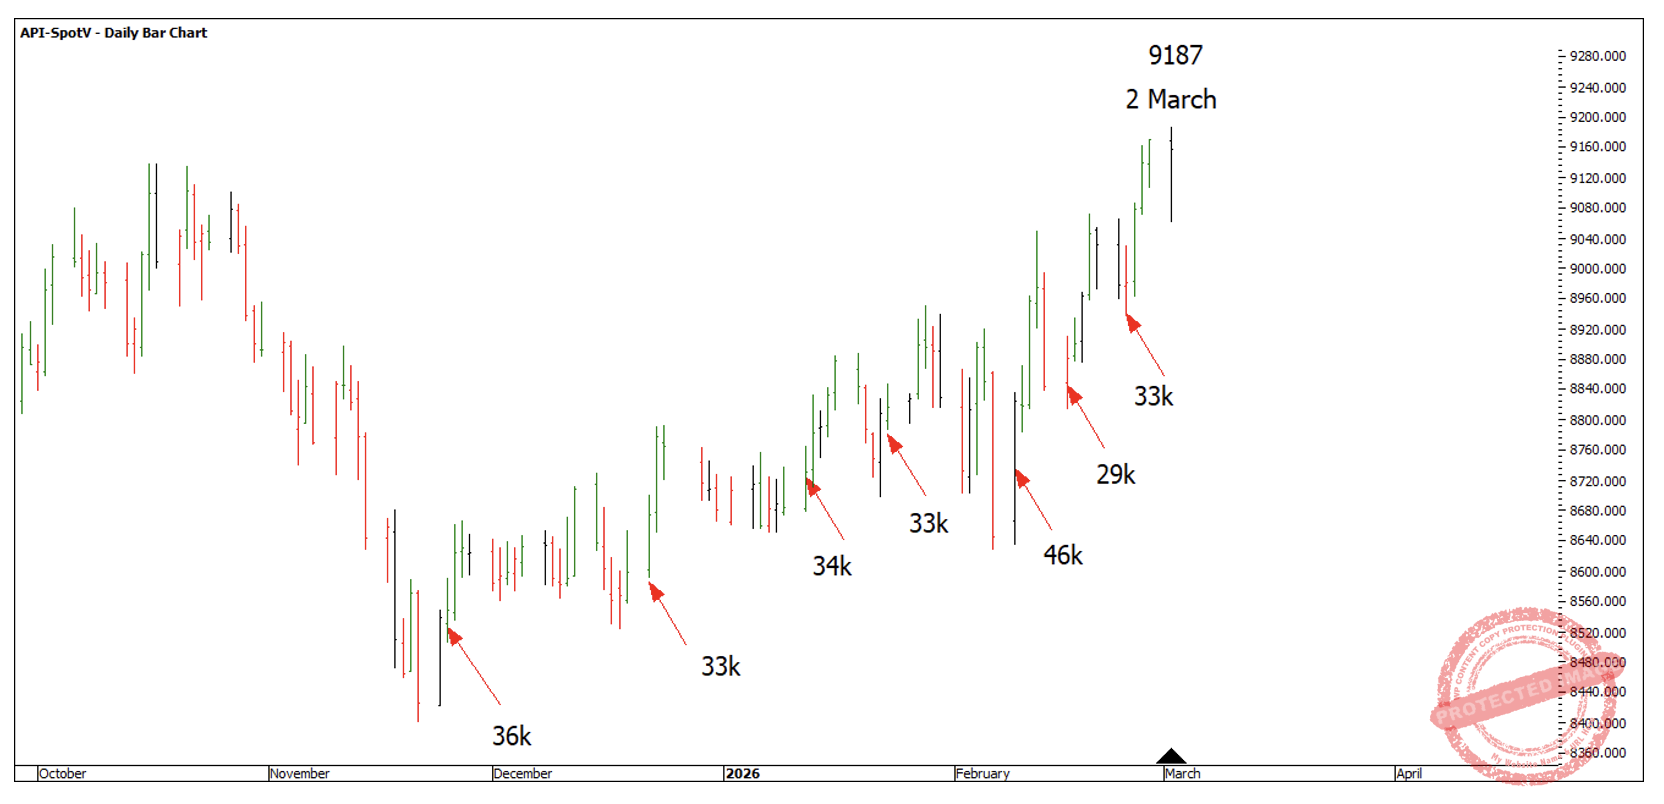
Chart 1
When I left you last month, we had just seen the SPI200 rocket down out of the 2 March high just touching the 100% milestone of the October/November run down.
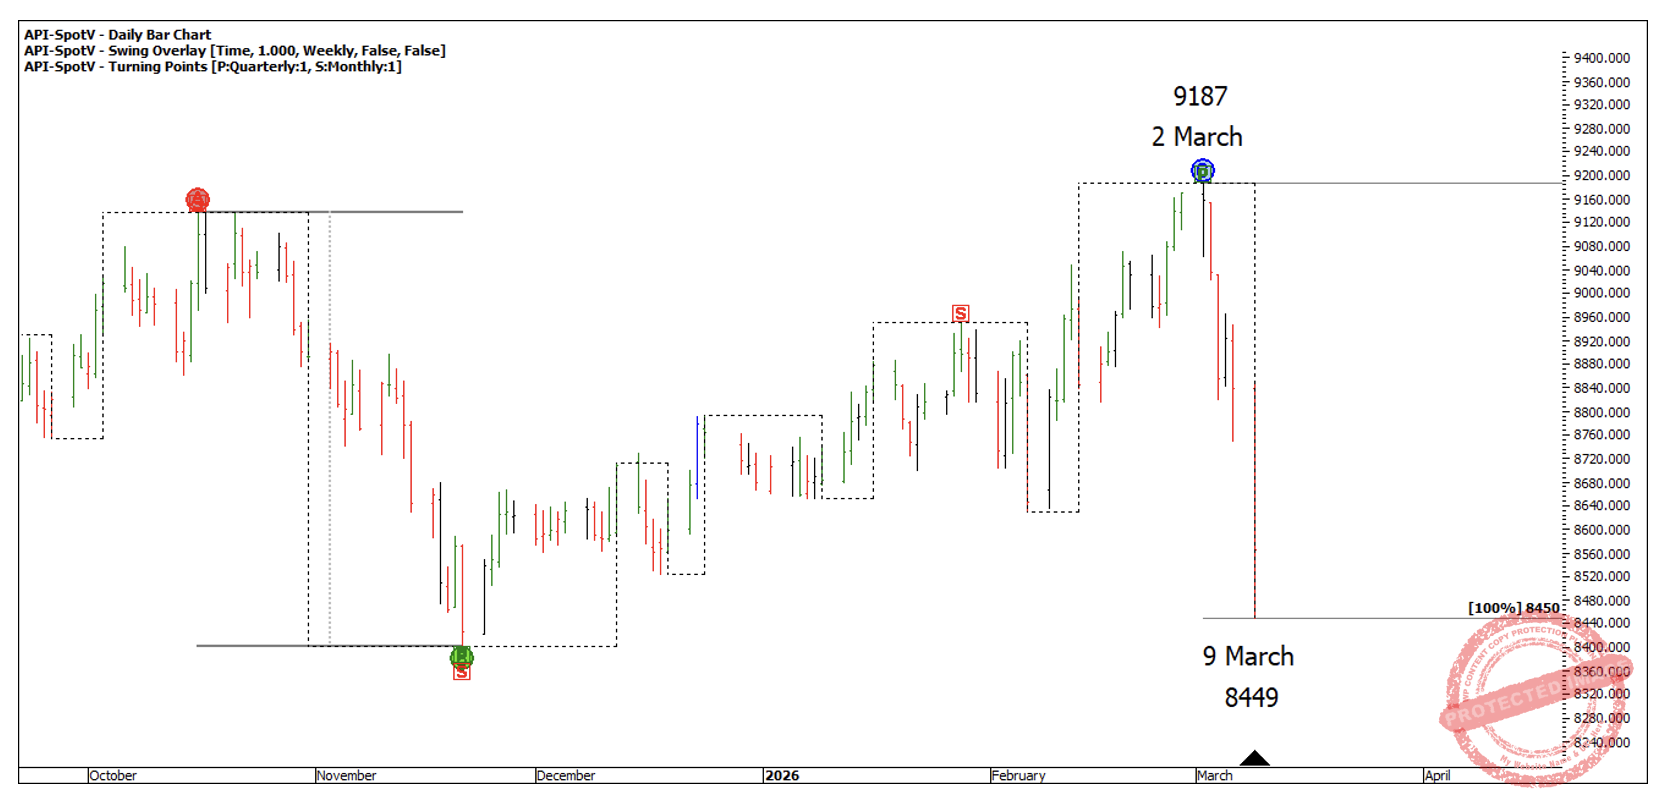
Chart 2
At this stage I thought we were probably going to see further downside. However, exactly 2 weeks later, the SPI hadn’t really managed to drop much further.
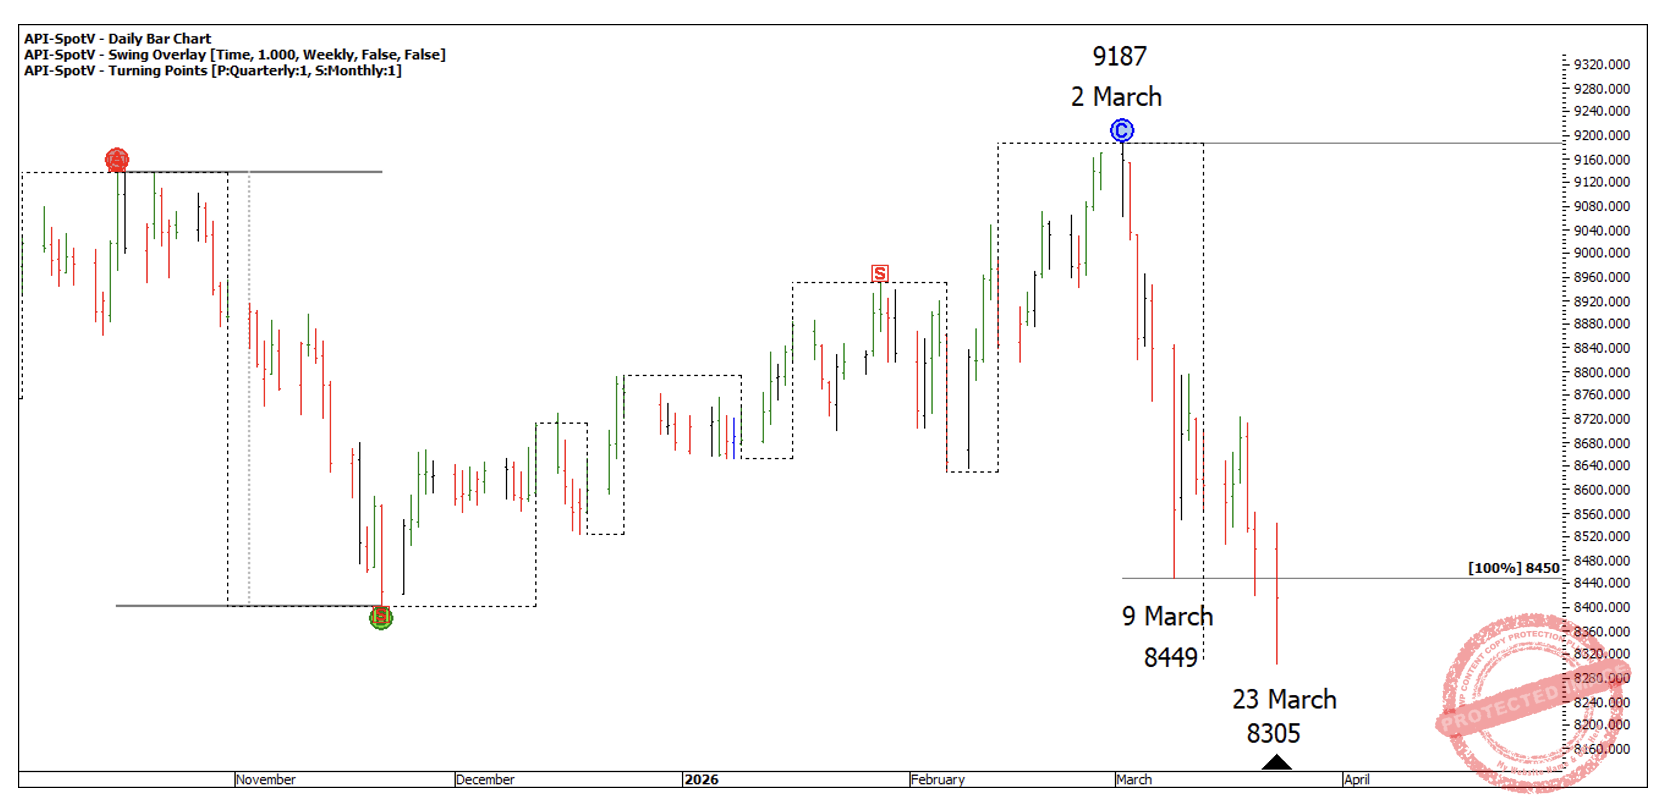
Chart 3
In fact, one week later on, 30 March, the SPI200 was looking like it was making a higher bottom on the 100% milestone of the previous reference range.
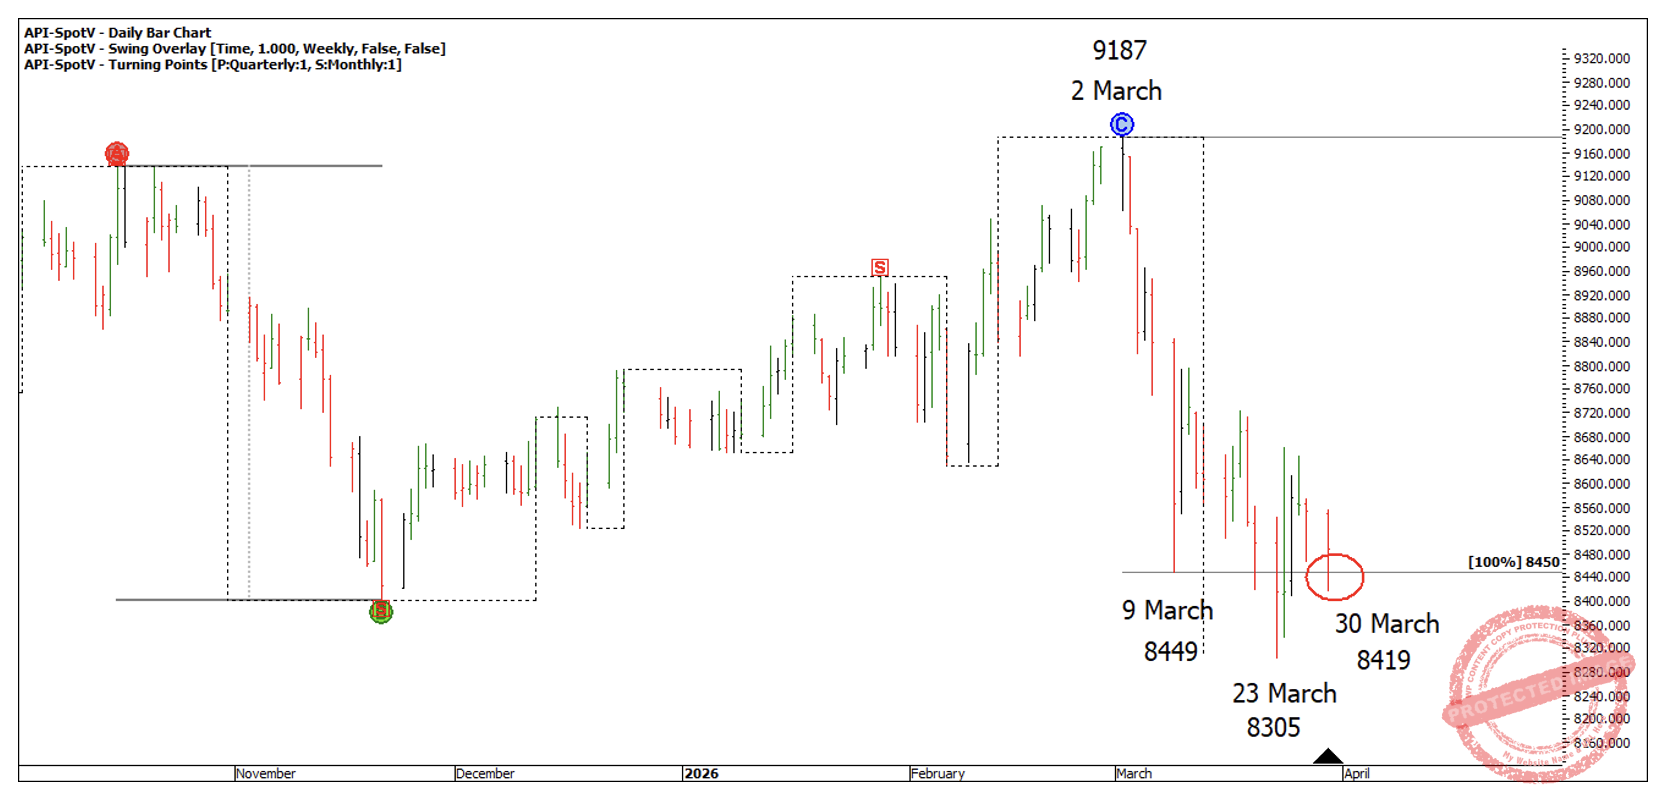
Chart 4
If we zoom in on this and look at Price Forecasting, we can see a price cluster forming, with the last daily swing down failing at the 50% milestone at 8452.
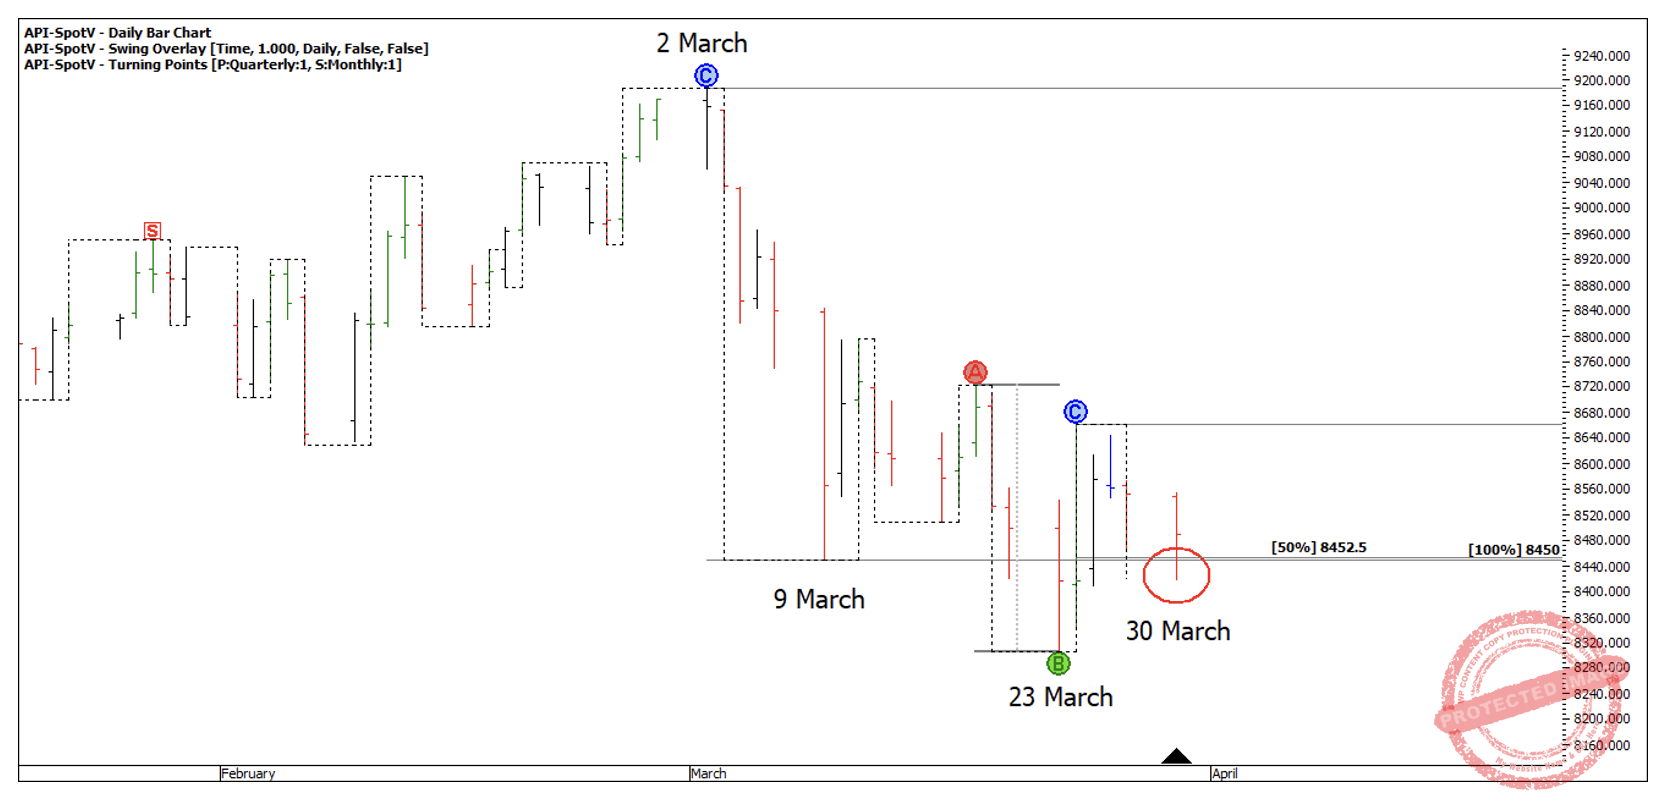
Chart 5
Form reading our daily swing ranges shows the A-B range is 356 points, which is the biggest daily swing range up since early February. Then the B-C range into 30 March was 242 points, and a contracting range down. So we had an expanding swing up and a contracting swing range down finding support on a two part price cluster.
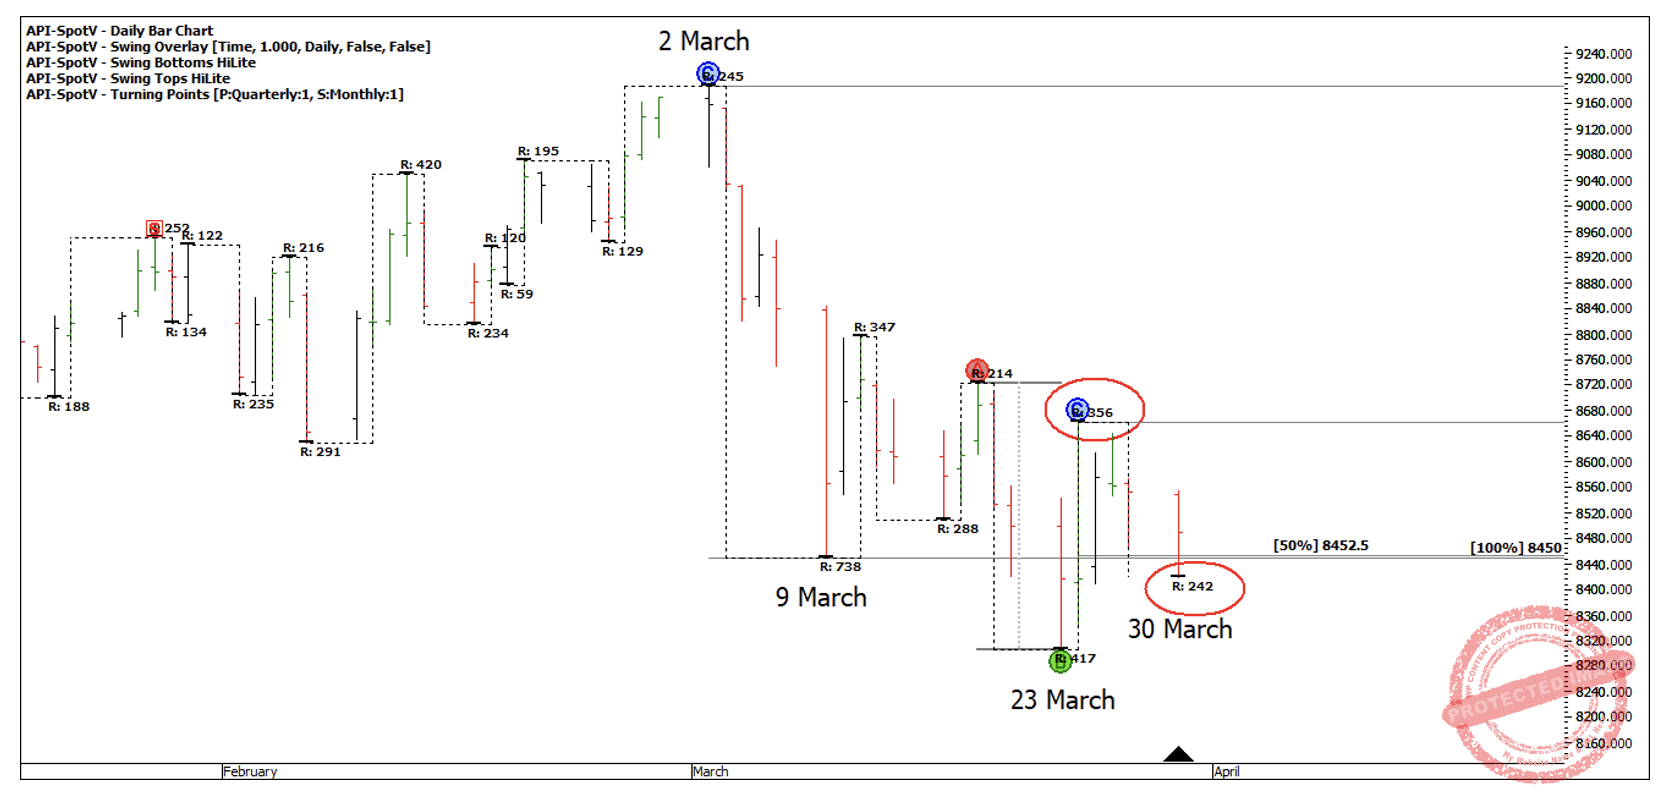
Chart 6
Now for the kicker! If you had been watching volume through this time you might have noticed an increase of contracts, suggesting the big/smart money is buying!
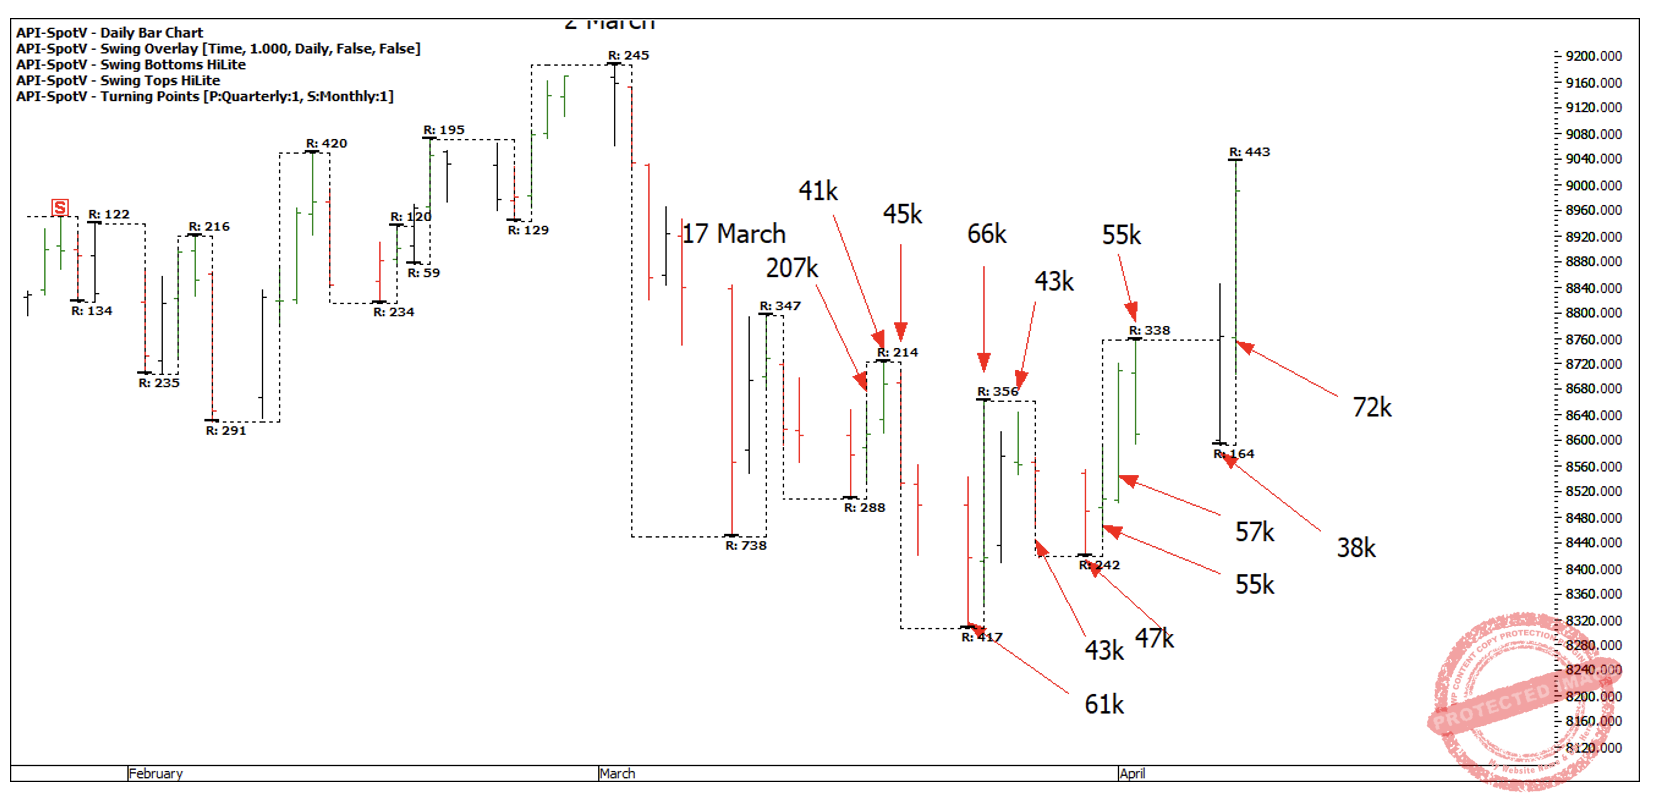
Chart 7
17 March shows volume of roughly 207,000 contracts due to contract roll over. Then as June contract kicks off, we saw a much higher volume of sales with some days showing around 60,000 contracts traded. This is a huge increase from the number of contracts sold shown in Chart 1!
So, for me we had a higher daily swing bottom finding support on a price cluster backed up by strong volume. This signals to me the strength is to the upside. If we zoom out to look at the big picture, we see the SPI200 March low is a bit more balanced and sits just above the 50% retracement, also showing signs of strength. David Bowden rates the strength of all his swing retracements or ABC’s relative to ‘Estimated Point C’.
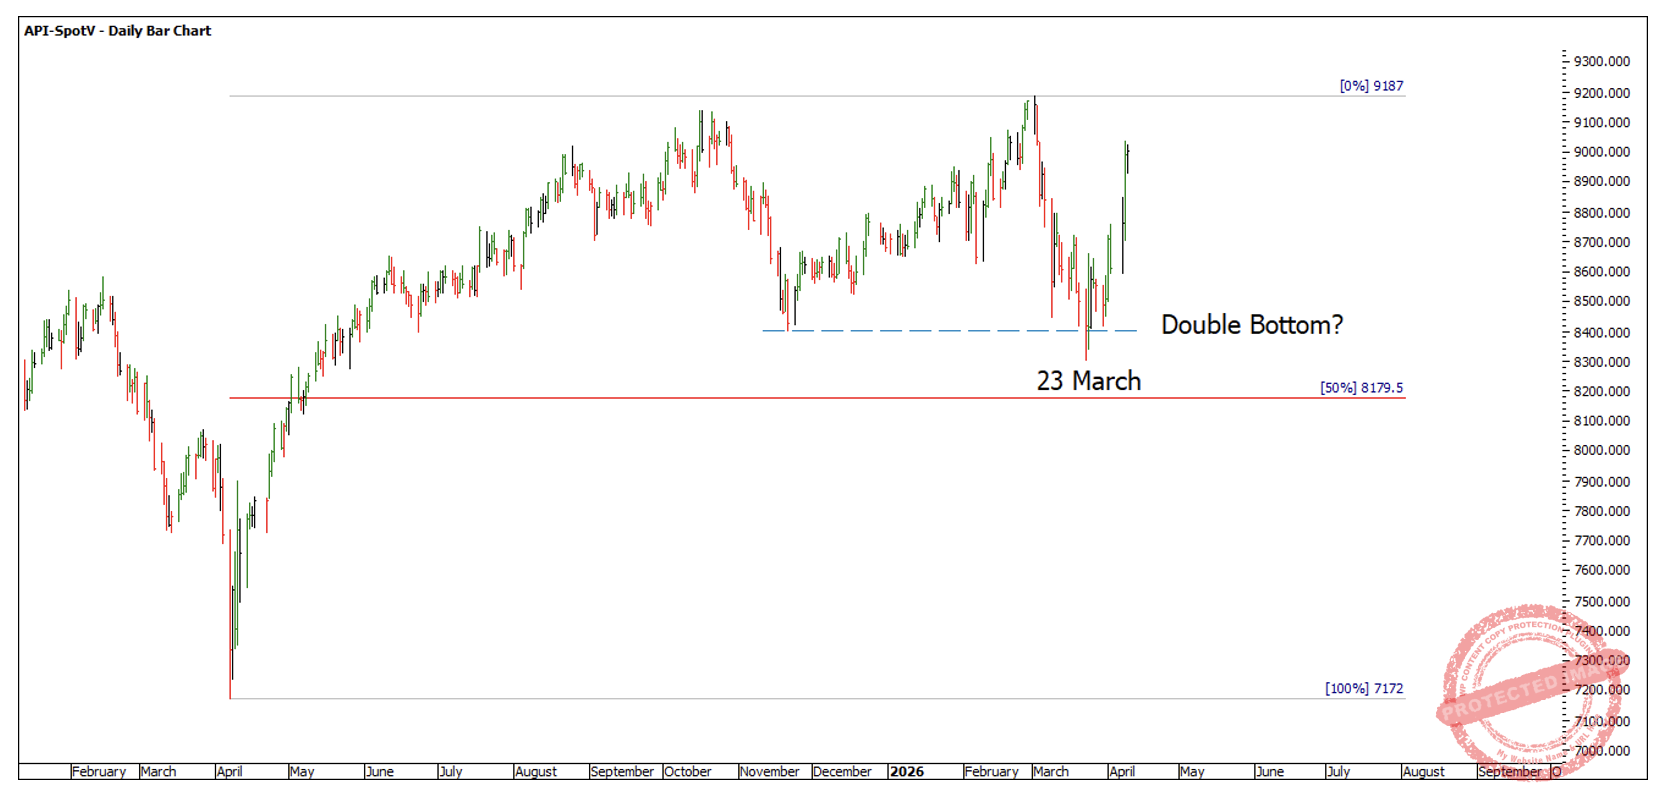
Chart 8
Are we looking at a double bottom holding above a 50% retracement?
In this month’s Platinum article, I will continue the discussion and show how Time and Squaring Time and Price could also have helped you to rate the strength of the 23 March low.
Happy Trading,
Gus