Golden Focus
Markets continue to deliver volatility across most of the different asset classes. The stock, commodity and currency universe are all open for business so to speak. For those in the 2025 and 2026 coaching program know that Gold futures have been a market I have been focused on and the reasons behind that are unsurprising given the rise we have seen over the last few years.
This current cyclical move has been less about using Gold as a hedge against inflation and a store of value against uncertain times, it has been a more broad-based movement. No doubt you have seen the news stories showing people lined up around the corner attempting to buy physical metals. This makes me think of stories of the 1929 crash and Livermore’s concern when the shoeshine boys were holding stocks in the market, and a more recent example is how collectable watches were traded during Covid.
I am not suggesting that Gold is about to crash, but I am tracking some road maps that suggest we are getting into the winter of this move. Again, I am happy to let the market tell the story.
When looking at Gold there is a multitude of ways to track and also execute, for many CFD’s are the most accessible option. There are futures as well and I note that there are some hurdles to master for Gold as there lots of different months for futures contracts, but the volume tells you which month should get your analysis and capital.
Table 1 below is a screenshot from the CME website that displays the level of volume and the logical focus on the June contract or GC-2026.m in ProfitSource. This is important to note as some CFD platforms are likely pulling data from the current month April and could skew your analysis.
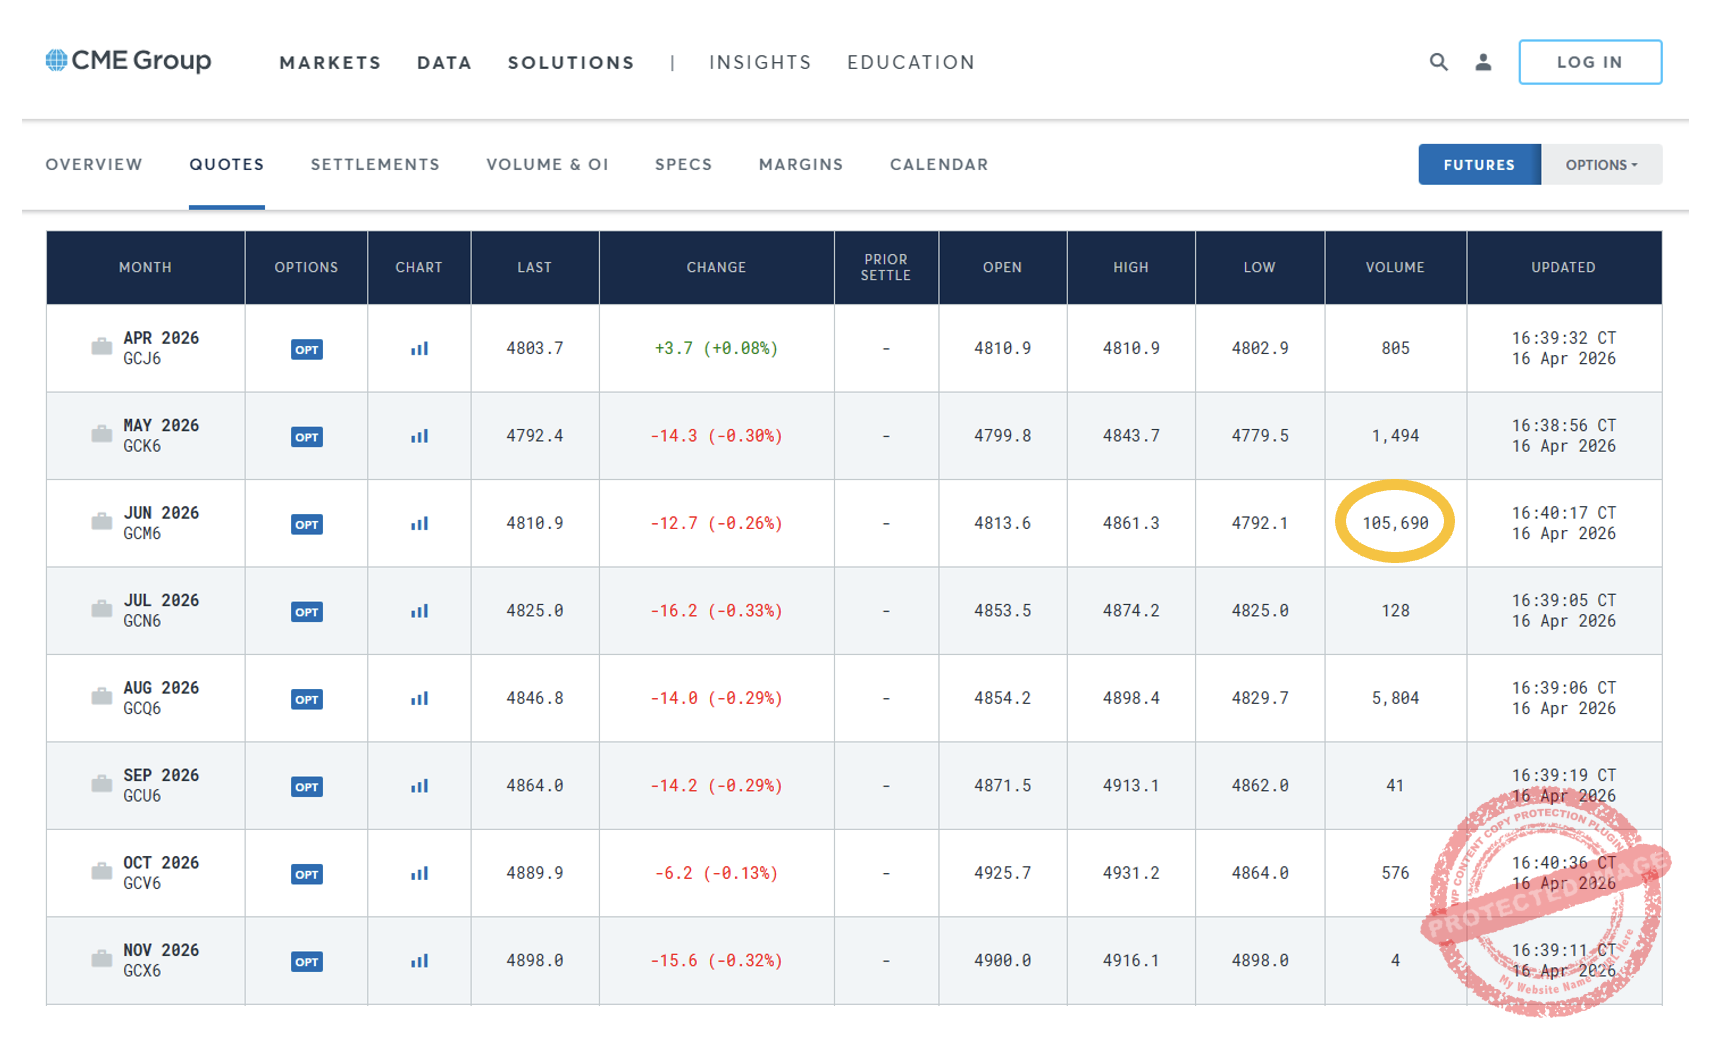
Volume Table from CMC Website
Chart 1 provides a number of techniques that I was watching on 16 April, Sydney time.
The road map as I suggested earlier told me that this week in April would be potentially significant. The pattern I was watching develop was the small picture double top of 8th and 15th April.
This sat at 50% of the range of February / March and was 75% of the previous October to February range up.
Of note was the 36 days down and 16 days up, which equates to a close but not exact 50% retracement in time (time trend analysis).
The third dimension is also covered with a 1 x 1 off the all-time high, using a calendar day angle at $10 per day as opposed to $0.01.
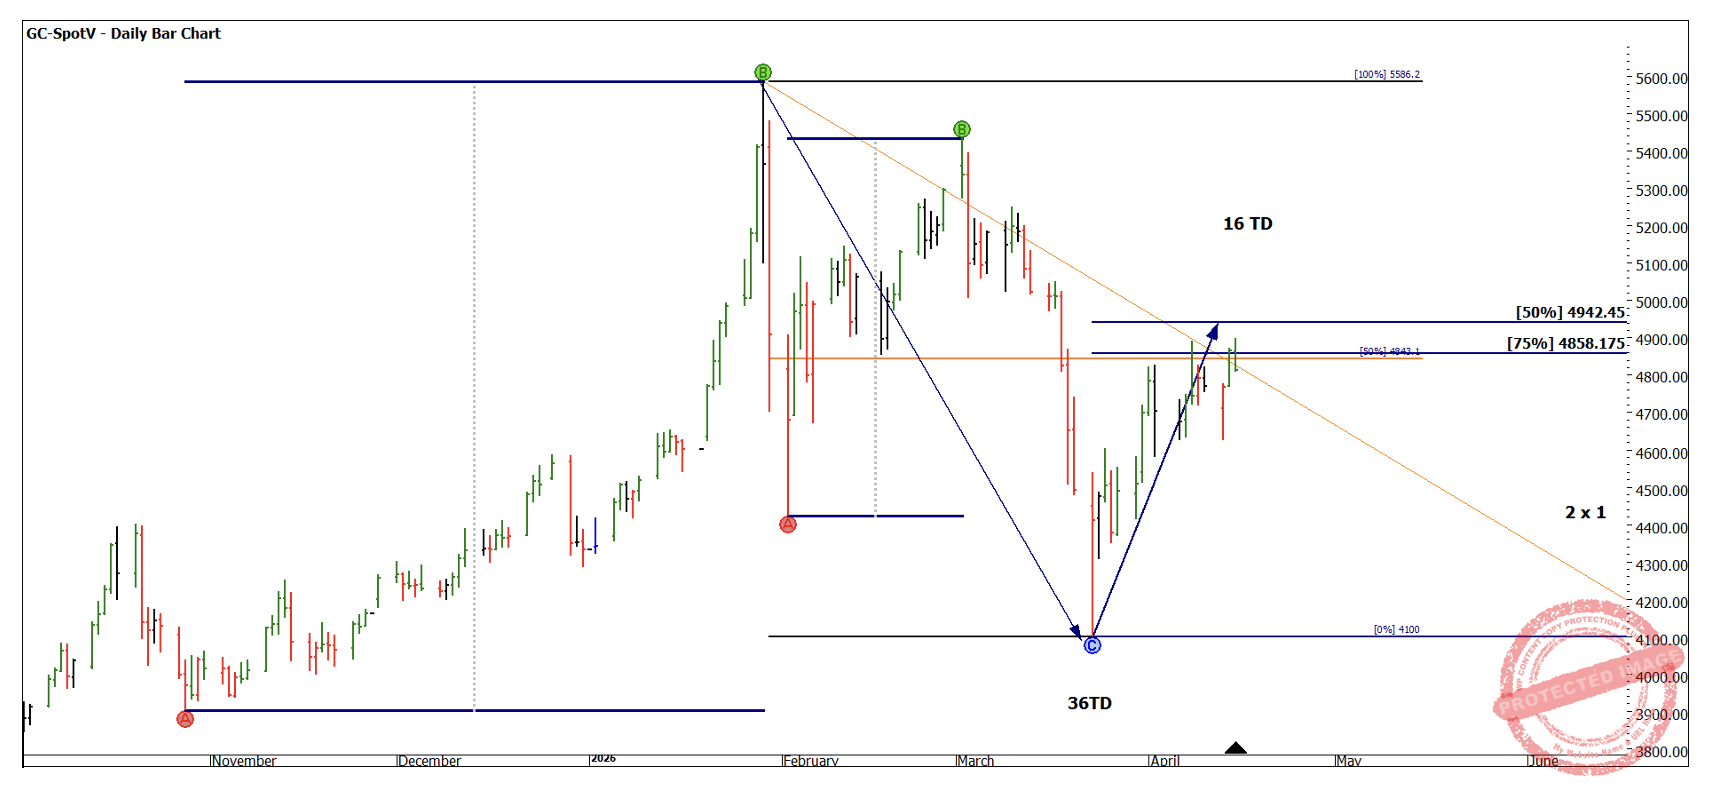
Chart 1 – Daily Bar Chart GC-Spotv
Chart 2 shows some basic Time by Degrees counts heading back from the 16th, the main harmonies we see are 45 degrees and 180 degrees. The all-time high was 76 degrees previously.
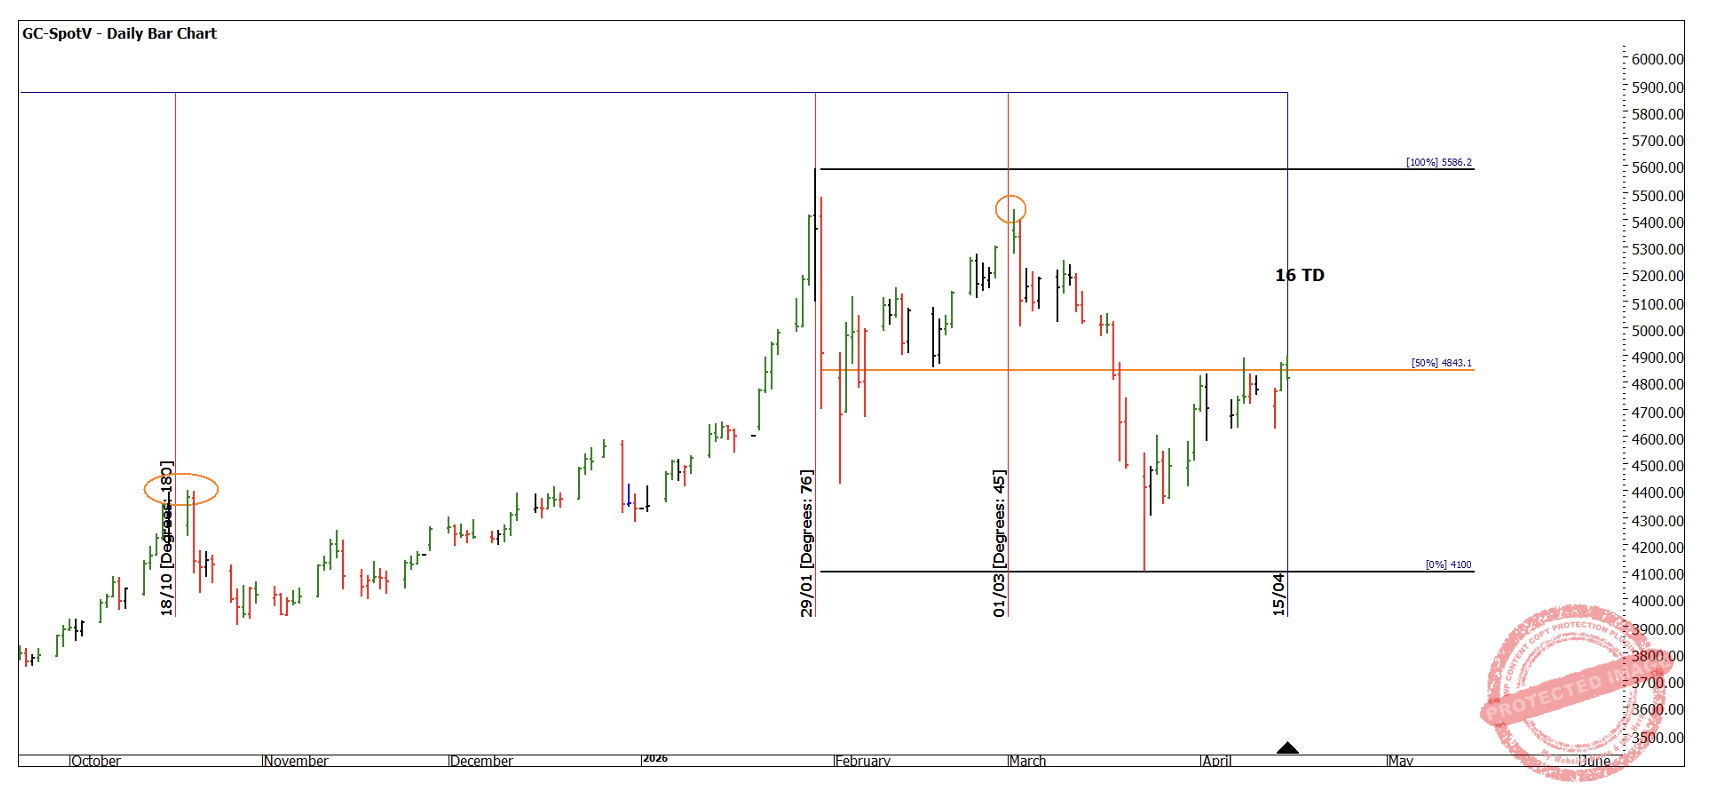
Chart 2 – Daily Bar Chart GC-Spotv
Price forecasting can be challenging; however, we can use a Highs Resistance Card as seen in Chart 3. This suggests some previous harmonies at 87.5% and 75% and aligns with the small double top pattern we are focused on.
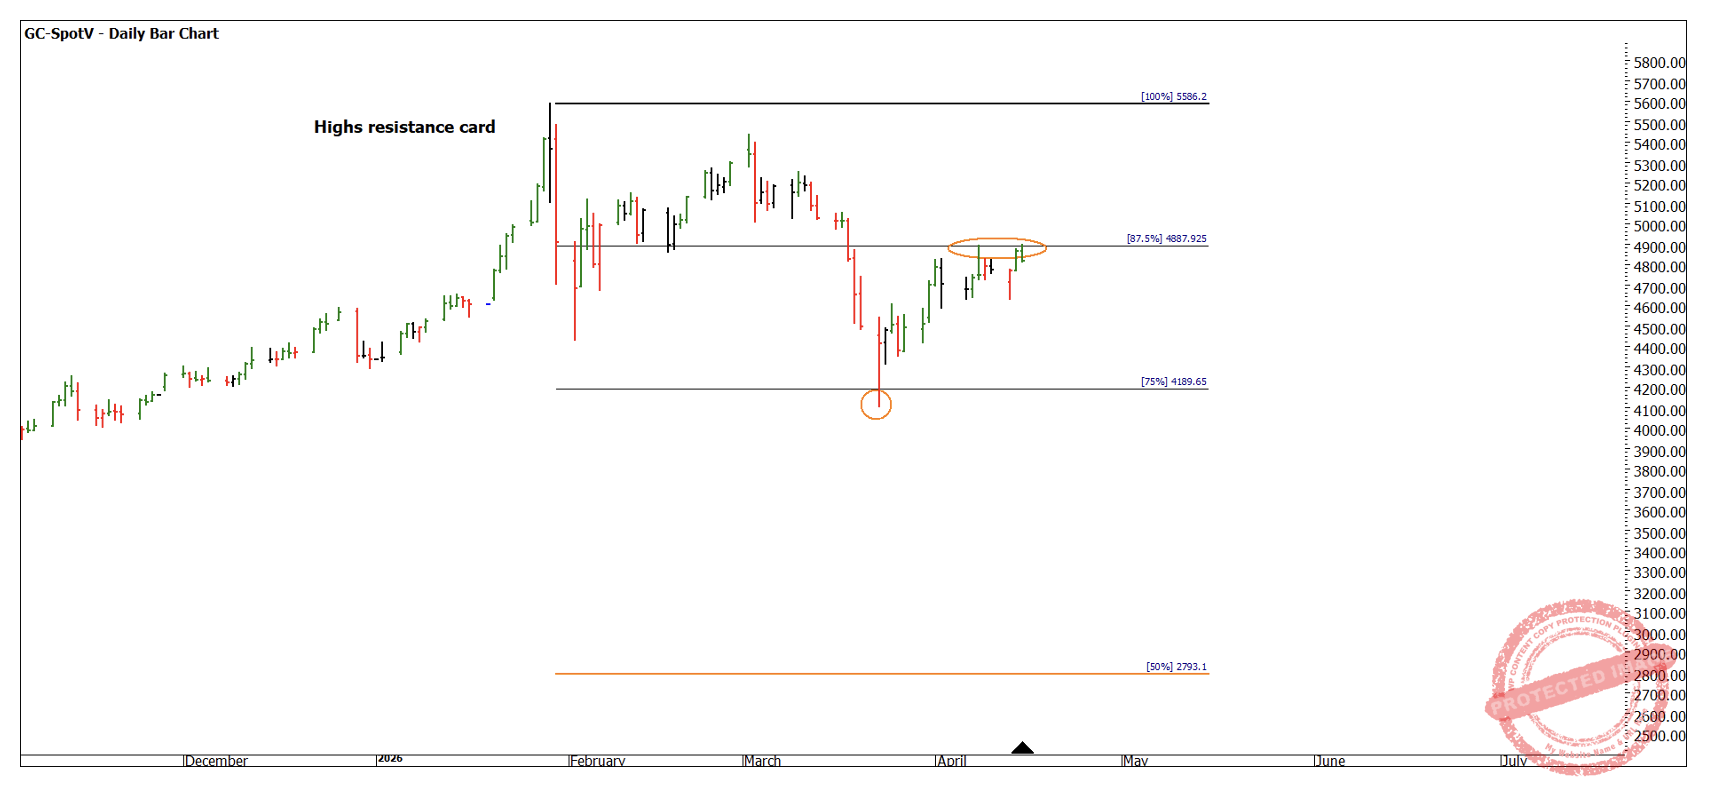
Chart 3 – Daily Bar Chart GC-Spotv
Tackling price from lows up, I have calculated a previous low ($1,618.30 November 2022) and in Chart 4 drawn a horizontal line where 3 multiples would be added to that low. We can see that price has just jumped across that multiple but been unable to close above, if we visualise a square of the low, we could confirm it’s in the weak part of the square and therefore a better place to find a high.
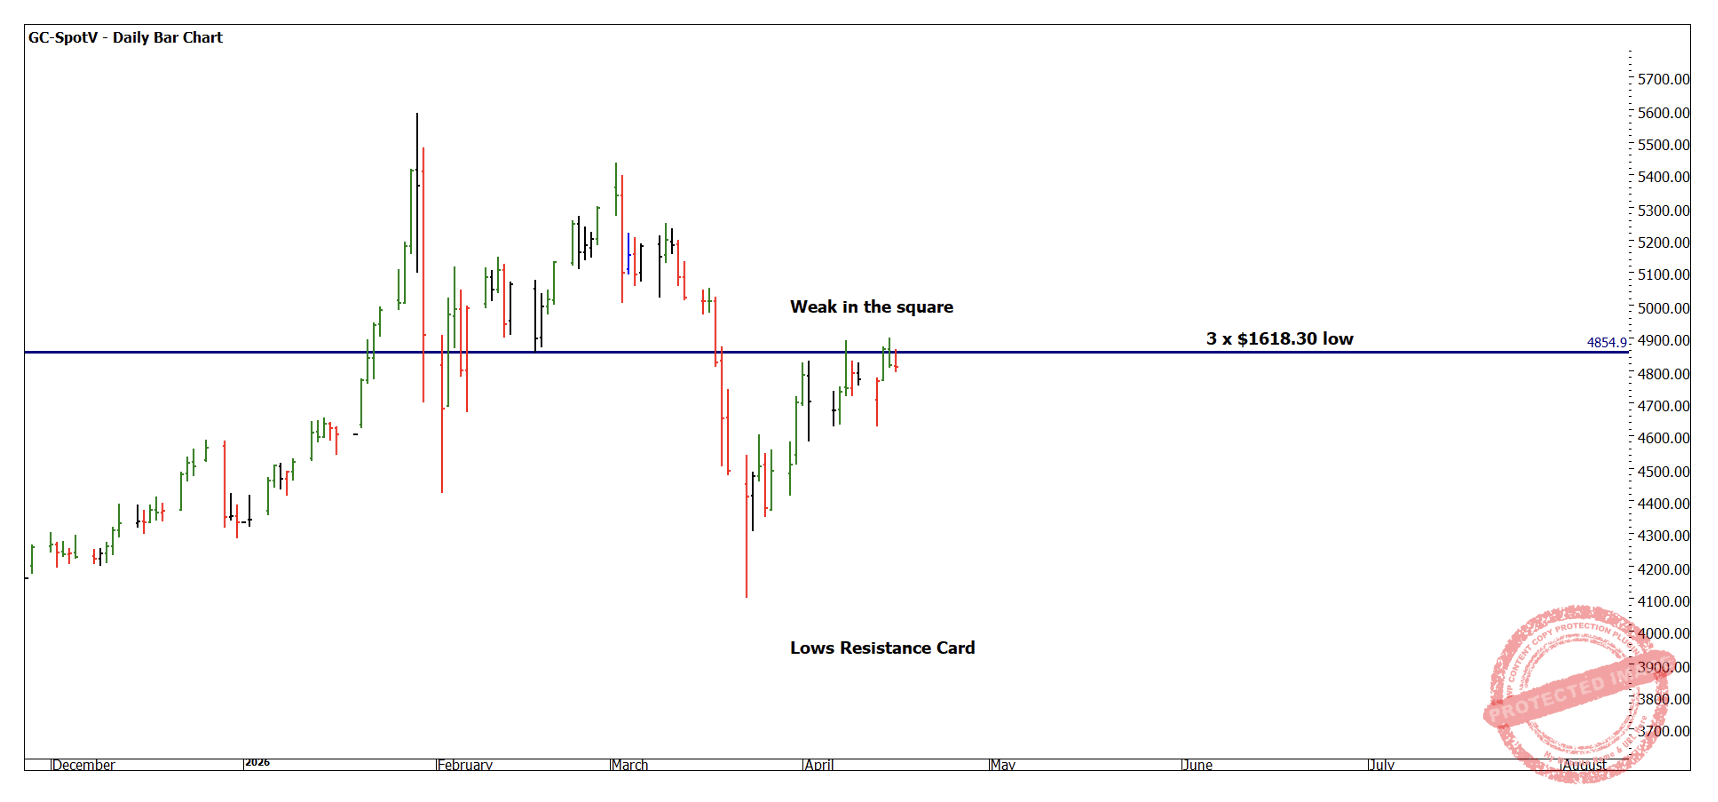
Chart 4 – Daily Bar Chart GC-Spotv
There are a number of other time and price components that we can add but I will leave that to you to undertake, the number 144 is a good start on this market, and I have found the number 72 has been useful in this most recent part of the market (50% of 144).
The next chart is presented as an idea for you to explore rather than a lesson per se, once I have an intraday pattern of price and time ie a double top, I will be using intraday counts in the same way we do daily counts to identify if there is any harmony. Chart 5 shows the second leg of the double top anchored to turns on a 4-hour bar chart. In essence if I can see 90 bars back being a turn (that is 90 4-hour bars) then this flows into my Wheels within Wheels concept.
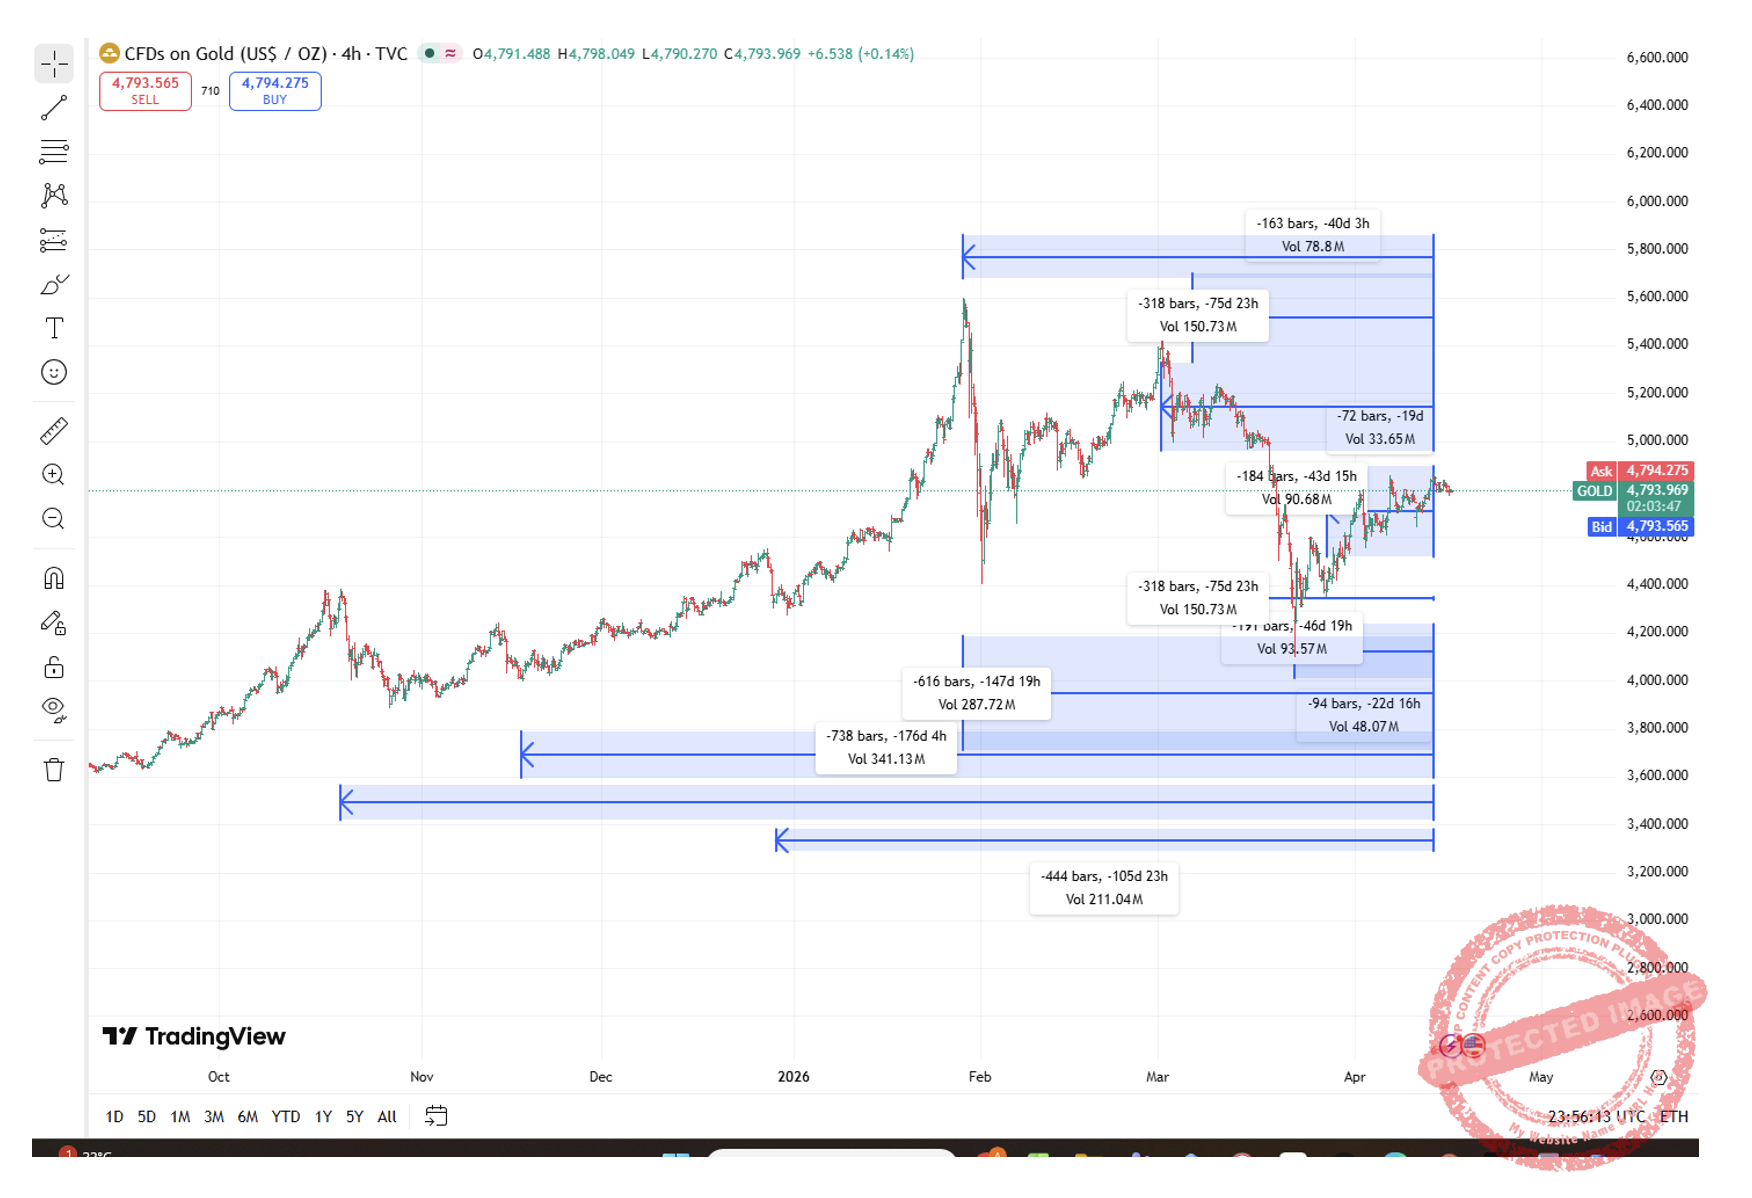
Chart 5 – 4 Hour Bar Chart Gold CFD’s
To bring this picture together, the final chart shows on a 4hour chart the double top and the subsequent first lower top on the 4-hour basis. An entry was possible on the short side with an approximate $27 dollar risk per contract.
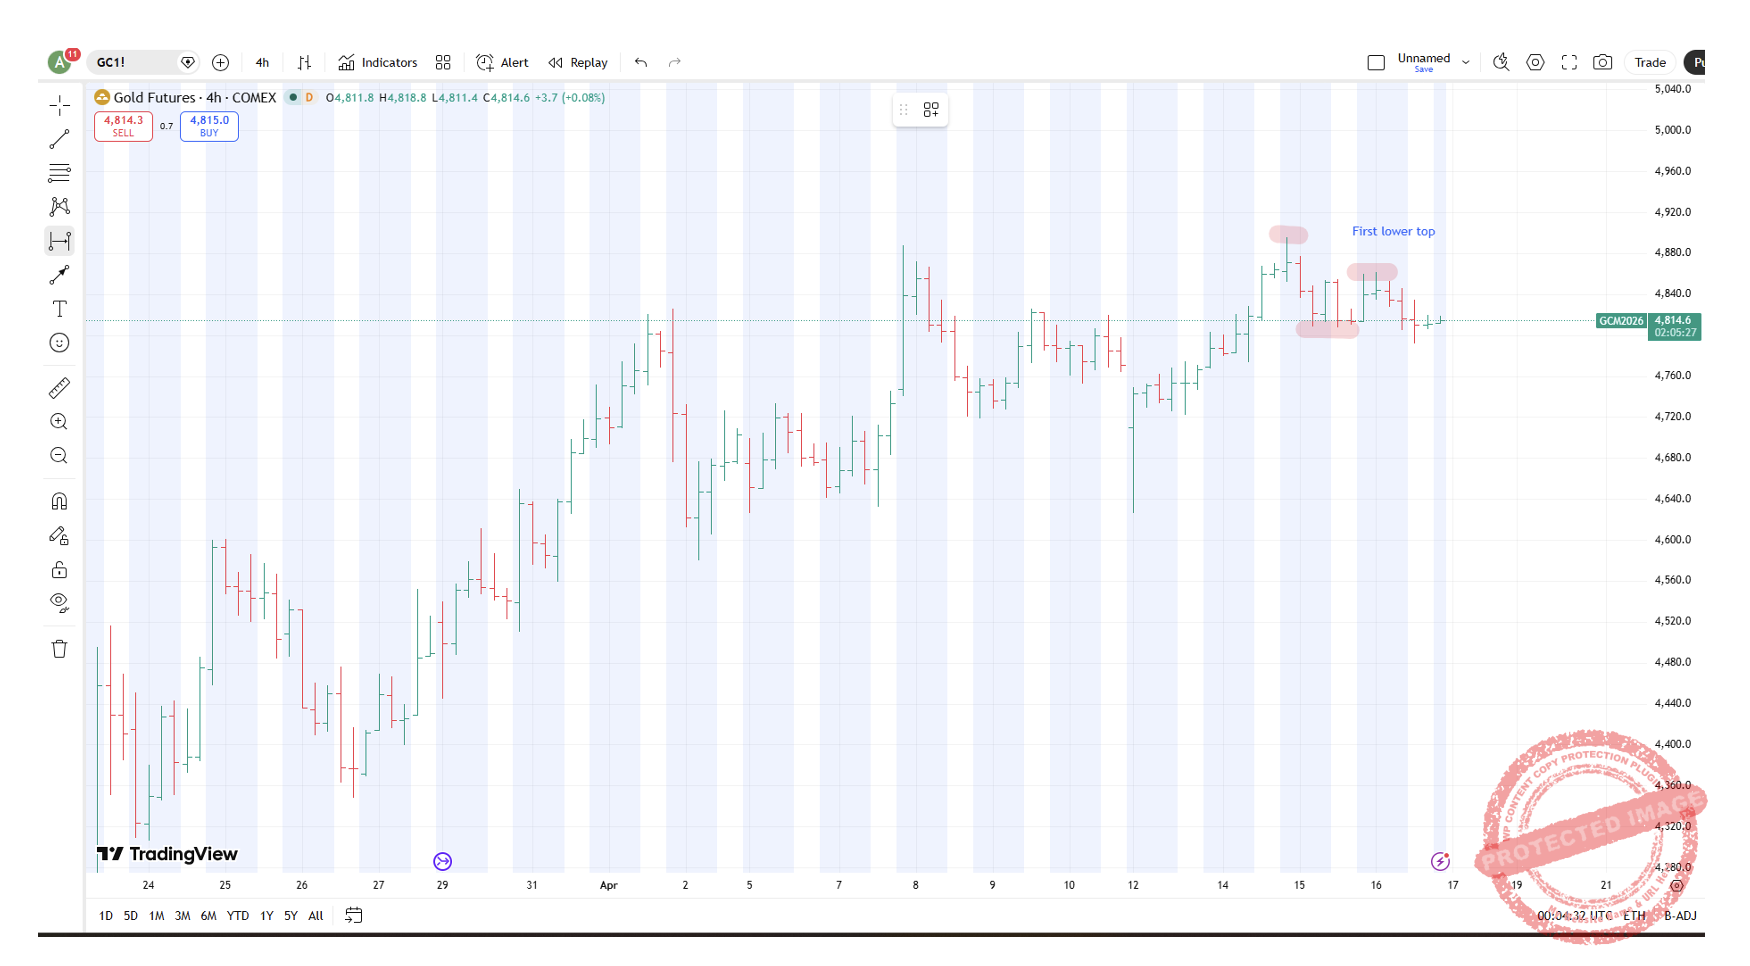
Chart 6 – 4-Hour Bar Chart Gold Futures
Trade management is now the activity; a stop and reverse strategy is one I have also decided to implement here. There has not been an immediate move away which always places us in two minds in terms of our analysis. Hence if the market cannot accelerate away, a stop and reverse may allow for us to manage an initial losing position into something different.
Good Trading
Aaron Lynch