Struggling to Get Above 50%
Sideways markets are tough for directional traders, and as I write this month’s Platinum newsletter, patience is no doubt being tested in your war room as it is in mine. There can be a need to be in the market, but rest assured this sideways malaise will pass as in previous times just like this. The markets I normally follow have proven to be hard to generate signals to enter, as in most cases there is no discernible trend, or risk and reward ratios are not in keeping with what my trading plan requires, so we are somewhat left to analyse as to when the right time might be to resume trading.
Our best defence is being out of the market in times like this and can be an important circuit breaker. It always good to have some time away as well so if you are doing that now you will likely not feel too concerned about what you are missing.
To that end I am happy to continue discussing the stock Macquarie Group from the earlier newsletter from this month. A quick revision showed us some price work that has been working on that stock, and this article will combine some time analysis over the top.
Earlier in the month there were some projections for prices rising and the possible retest of some recent resistance. If we jump into the current data, we see a small picture double top with a further lower top forming on the 18th of July. Of interest is the expanding swing of $10.68 after the double top, however, the market was able to rally again and test the $230 price level.
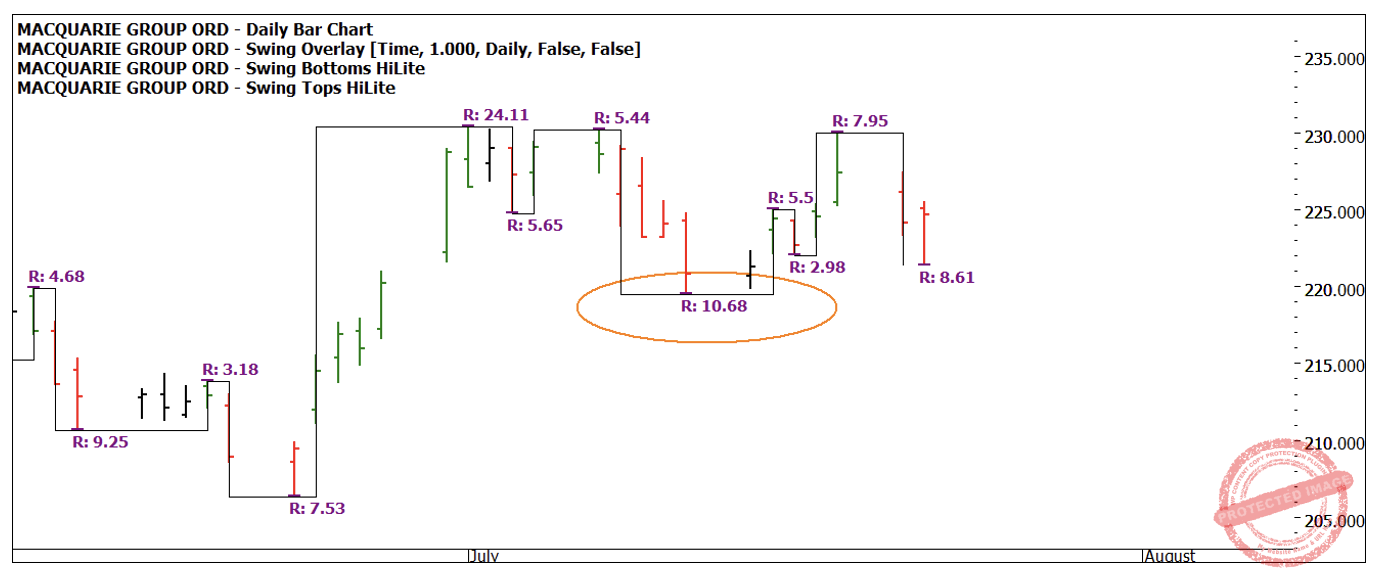
Chart 1 – Daily Bar Chart MQG
We are in a unique position in price as we could either expect a retest of the highs and a possible break through (4th time) or if lower tops can be found under the $220 level, then we may say that short term resistance has been broken.
Chart 2 gives us some simple time counts between tops and bottoms. The value of keeping a chart like this updated cannot be overstated. Things can get a little messy to interpret as we have some counts repeating into the three most recent tops. This could be suggesting a high may be in and we are waiting for a reaction. We must wear some of the counts a bit loosely, it’s important for you to recreate this for yourself to see how it hangs together. Some of the counts are natural numbers and others market numbers. We also see some repetition into seasonal time over the last 12-18 months.
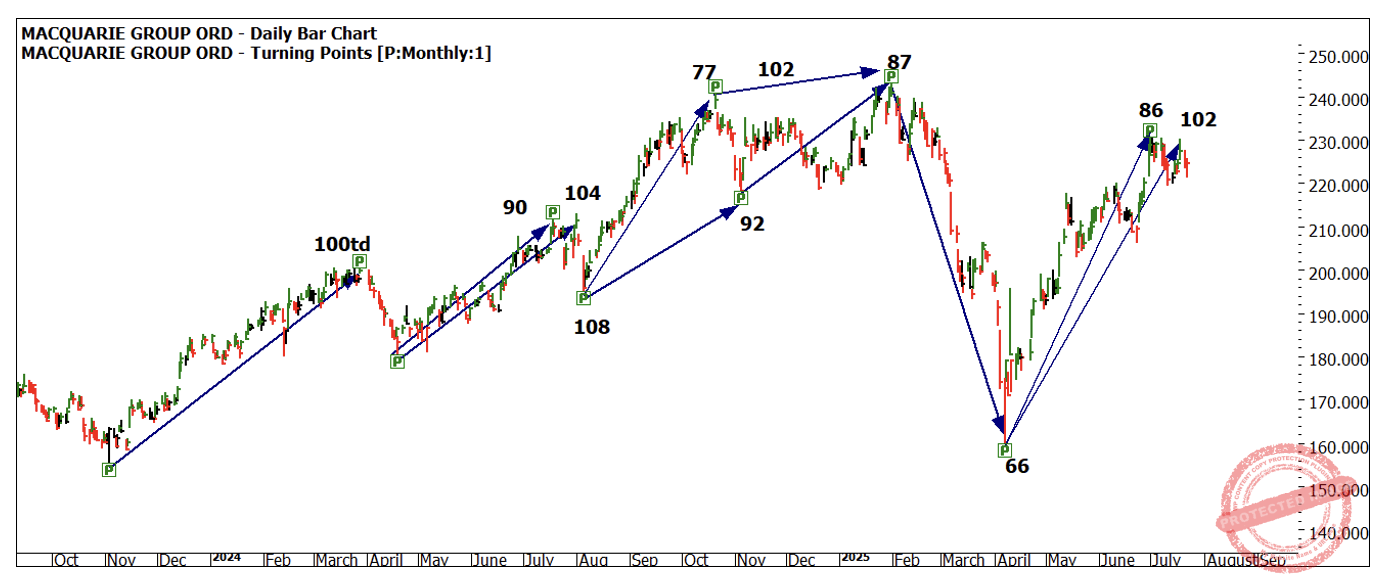
Chart 2 – Daily Bar Chart MQG
Using some angles and price projections in Chart 3 gives us the 50% level at $231.62 as an area of resistance that this market must break if it wants to move higher. Adding an angle from the April 2025 low and we have some 3rd dimension symmetry.
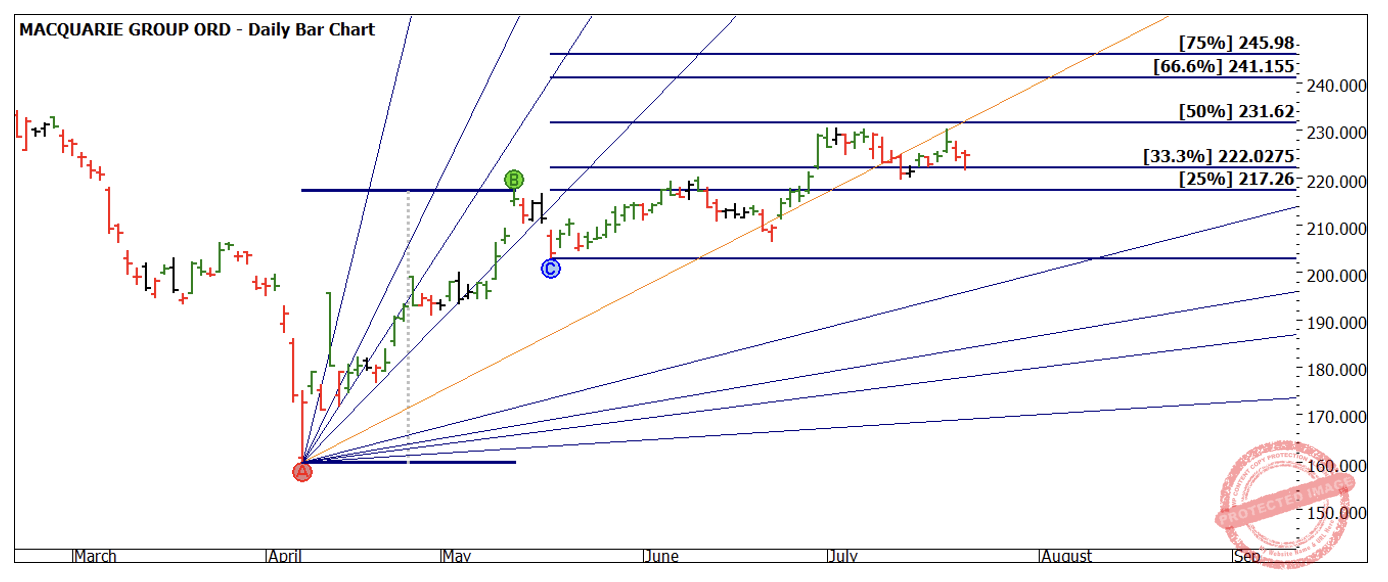
Chart 3 – Daily Bar Chart MQG
Chart 4 allows us to use the 7th of July seasonal time as an anchor for running Time by Degrees backwards and again suggests some possible harmony.
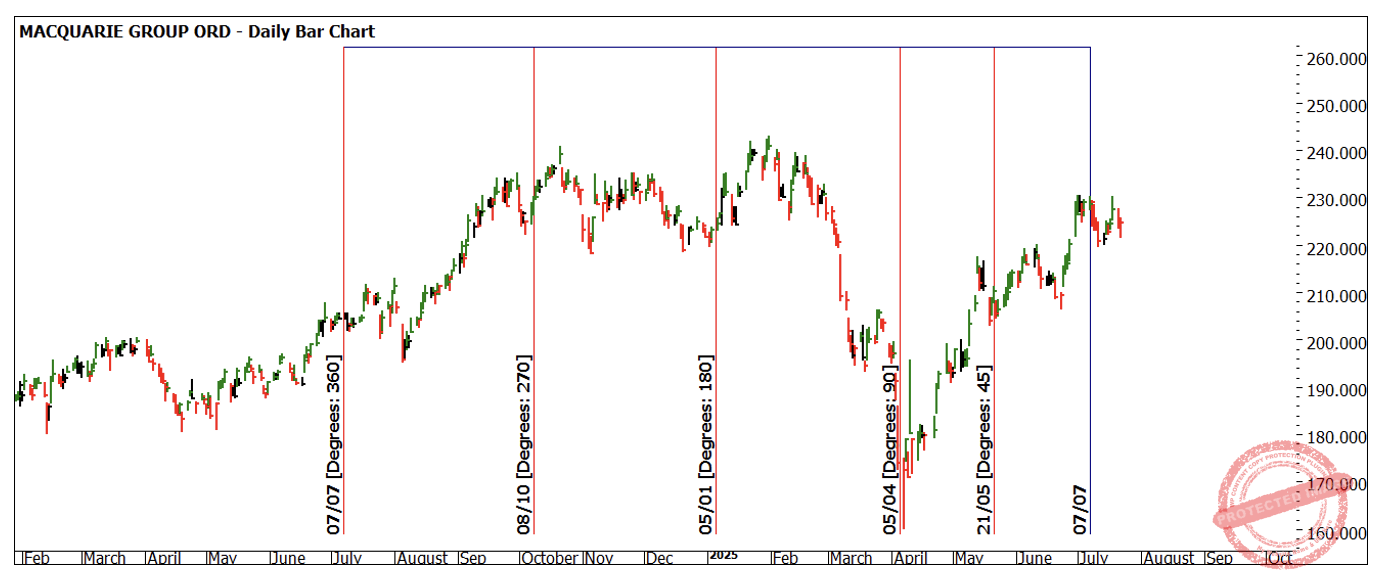
Chart 4 – Daily Bar Chart MQG
The longer this market and the broader index continue to move sideways will continue to coil the market for a move (one way or another). This could be good market to watch for a breakout (either way) over the coming period.
There is more analysis that could be overlayed, but I will leave that to you to pick up and run with.
Good Trading
Aaron Lynch