What’s the Plan?
W.D. Gann said you can beat the market with the 50% rule alone! It’s a fascinating statement – and it makes me wonder: if that were the only technique you’d ever been shown, and you knew nothing else about technical analysis, could you build an entire trading plan around it?
Fortunately for us, we’ve inherited access to more market smarts from legends like W.D. Gann and David Bowden.
I’ve also had the privilege of being taught by some outstanding Safety in the Market presenters over the years – Aaron and Noel, Tim Walker, and Mat Barnes – all of whom have generously shared insights into their personal setups, how they dissect a market, and the trades they look for.
Over time, I’ve taken a little from each of them and created my own recipe for success. As David would say, “Make it your own.”
One concept I personally love is the 200% milestone. Whether it’s 200% of the First Range Out or two multiples of the First Range Out, it provides a strong foundation for a trading plan. If I can then see 3–4 sections of the market pushing into a Ranges Resistance level, combined with a Time by Degrees date, that’s about as complex as the setup needs to be.
The time frame will always determine the strength of the setup and how long I might look to stay in a trade. As I continue refining my trading plans and decision-making process, I try to remove noise and increase clarity. One tool that’s helped me is a workflow diagram that supports cleaner decision-making.
In Chart 1 below, I’ve made a distinction between a ‘Setup’ and an ‘Entry’ – based on time frames.
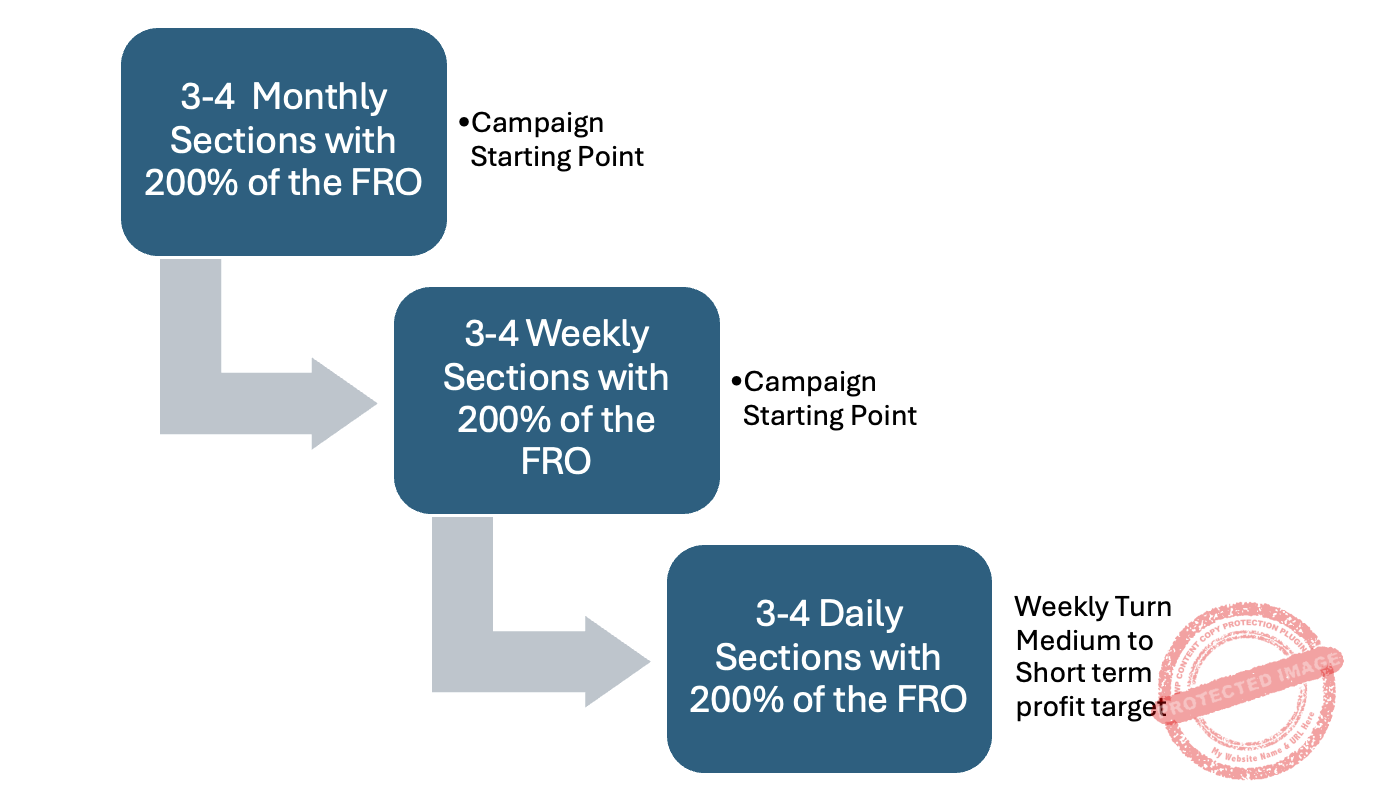
Chart 1
If I see 3–4 monthly sections pushing into 200% of the Monthly First Range Out, this could signal a quarterly turning point. That gives me the confidence to start a campaign-style trade, adding to the position over the following weeks or months.
On the other hand, 3–4 daily swings into 200% of the daily First Range Out may signal a weekly turning point – a shorter-term trading opportunity.
And if I see 3–4 15-minute swings into 200% of the 15-minute First Range Out, that’s not a trade setup on its own – it’s simply an entry strategy based on a bigger-picture setup.
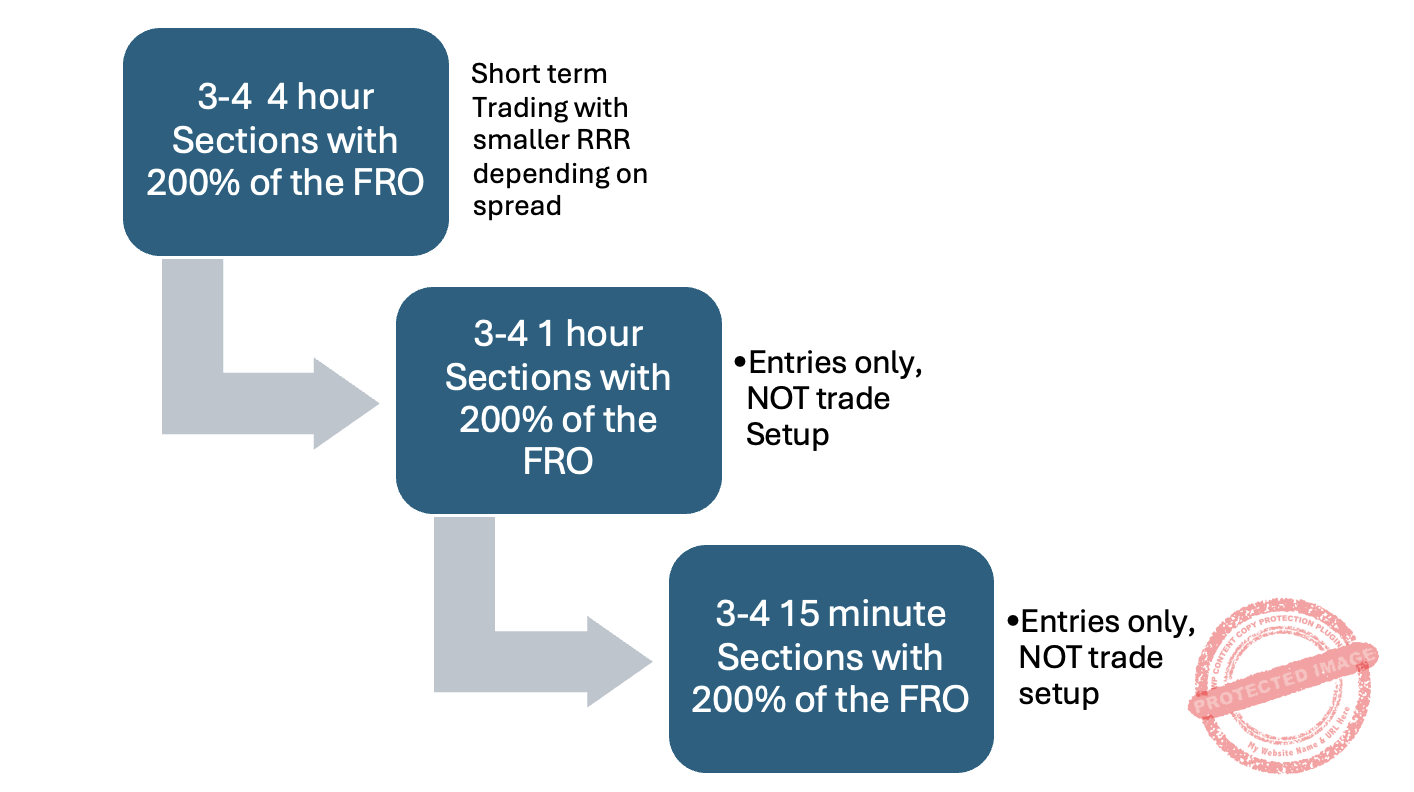
Chart 2
Looking at a recent example on Crude Oil, I spotted 3–4 daily swings into 200% of the daily First Range Out. Referring back to Chart 1, this tells me to treat it as a weekly turning point – a short- to medium-term profit taking opportunity.
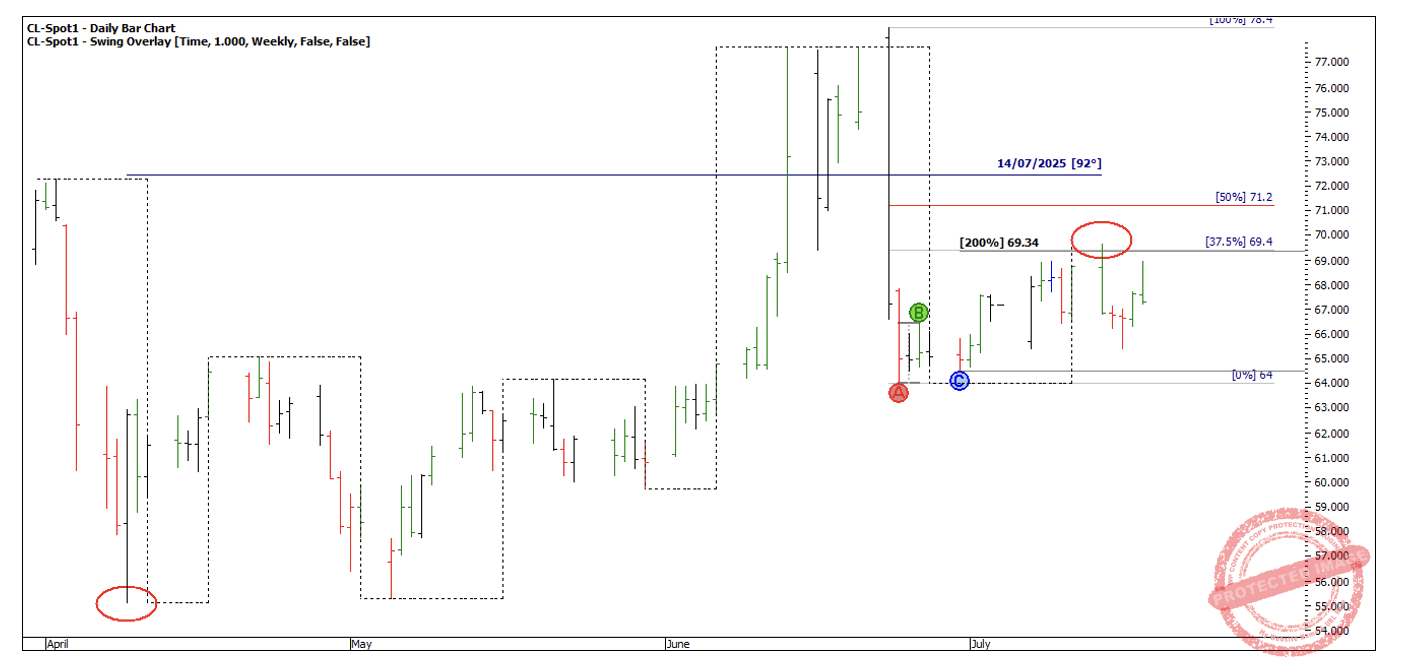
Chart 3
The fourth daily swing into 14 July formed a contracting range. The final 4-hour swing into the high failed at 50%, at 69.63.
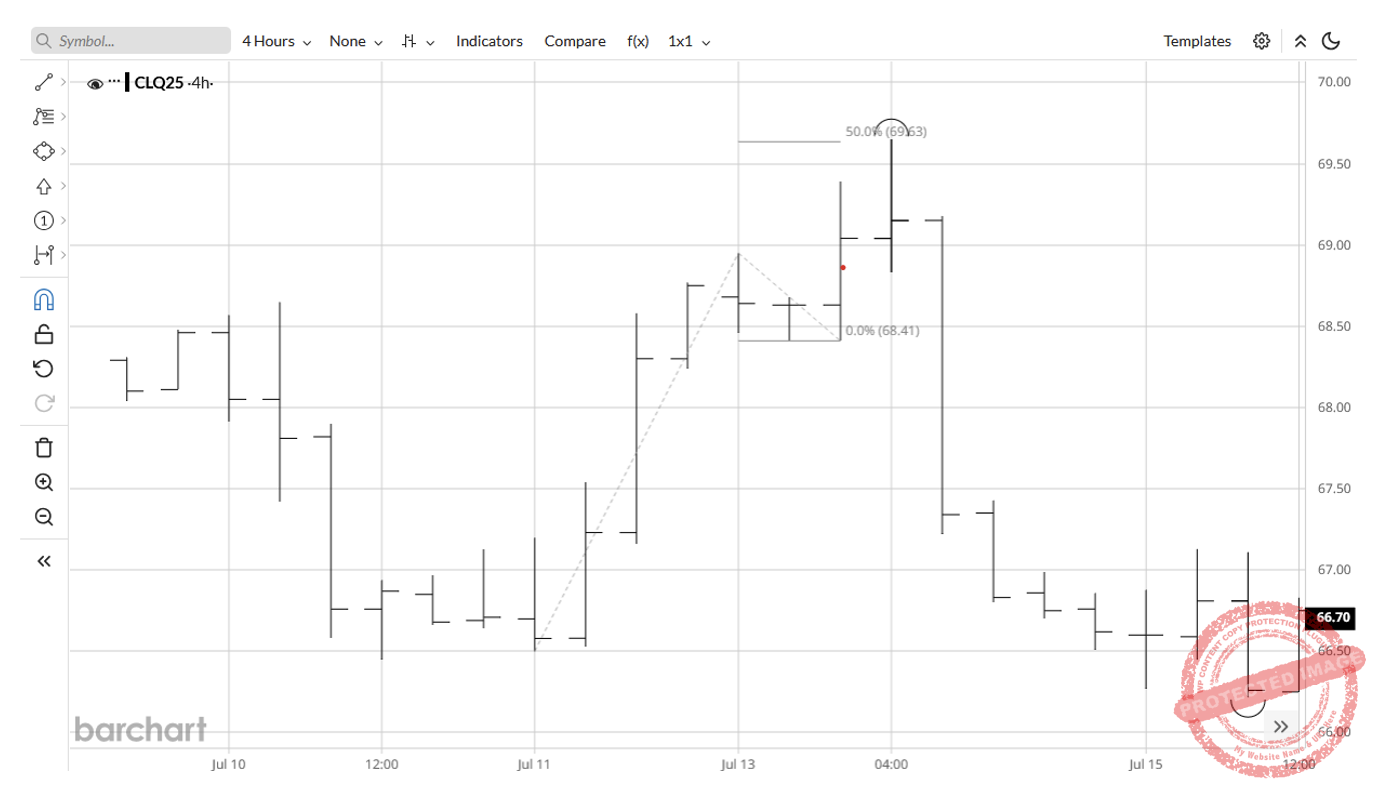
Chart 4
That last 4-hour swing can be broken down into three 1-hour swing ranges.
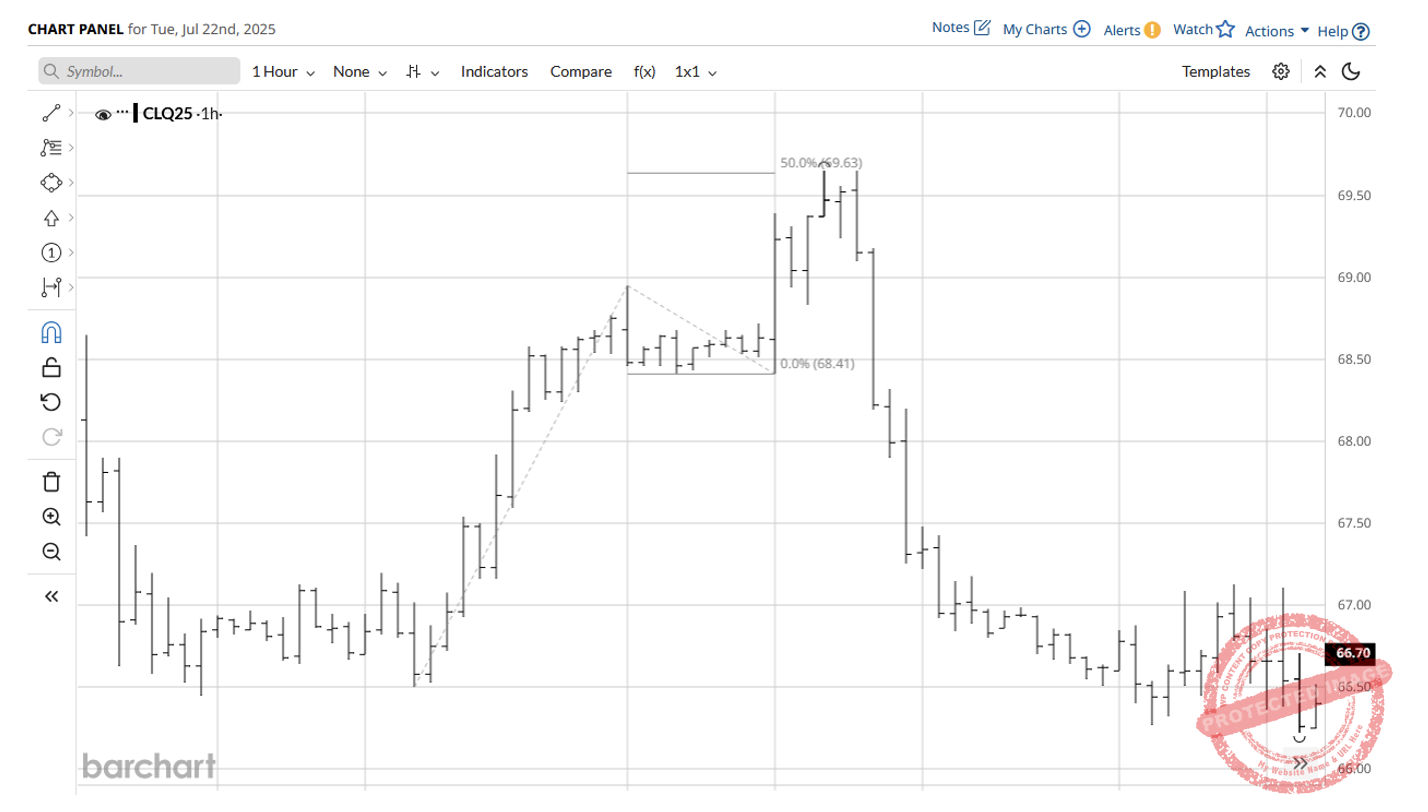
Chart 5
If you had entered the trade as the 1-hour swing turned down, you could’ve taken the trade with just 30 points of risk.
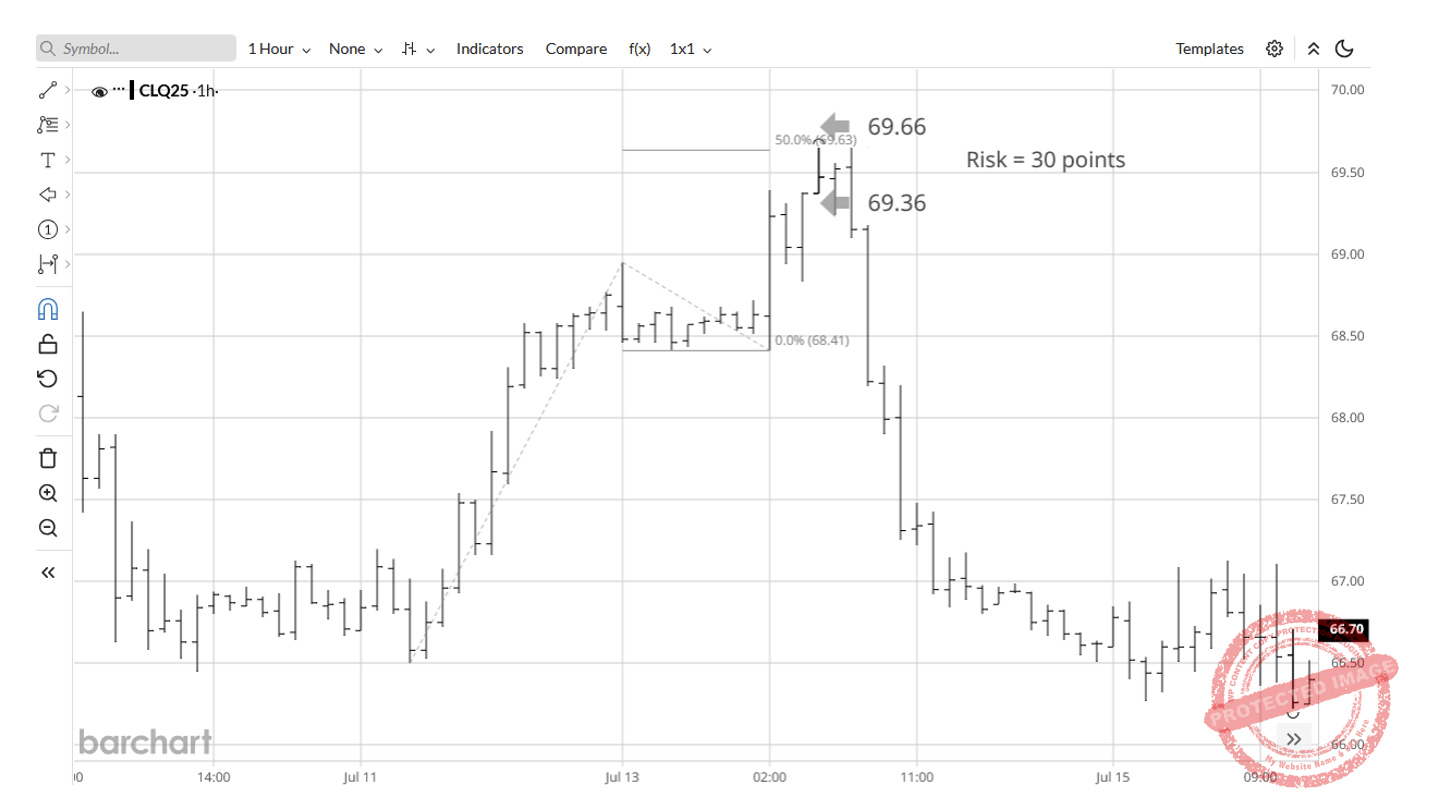
Chart 6
The daily swing trade into 16 July delivered just over a 10:1 Reward-to-Risk return in a couple of days. If 10 to 1 is your goal you could bank profits and move on. Although there are so many combinations of trailing stops to let the trade play out.
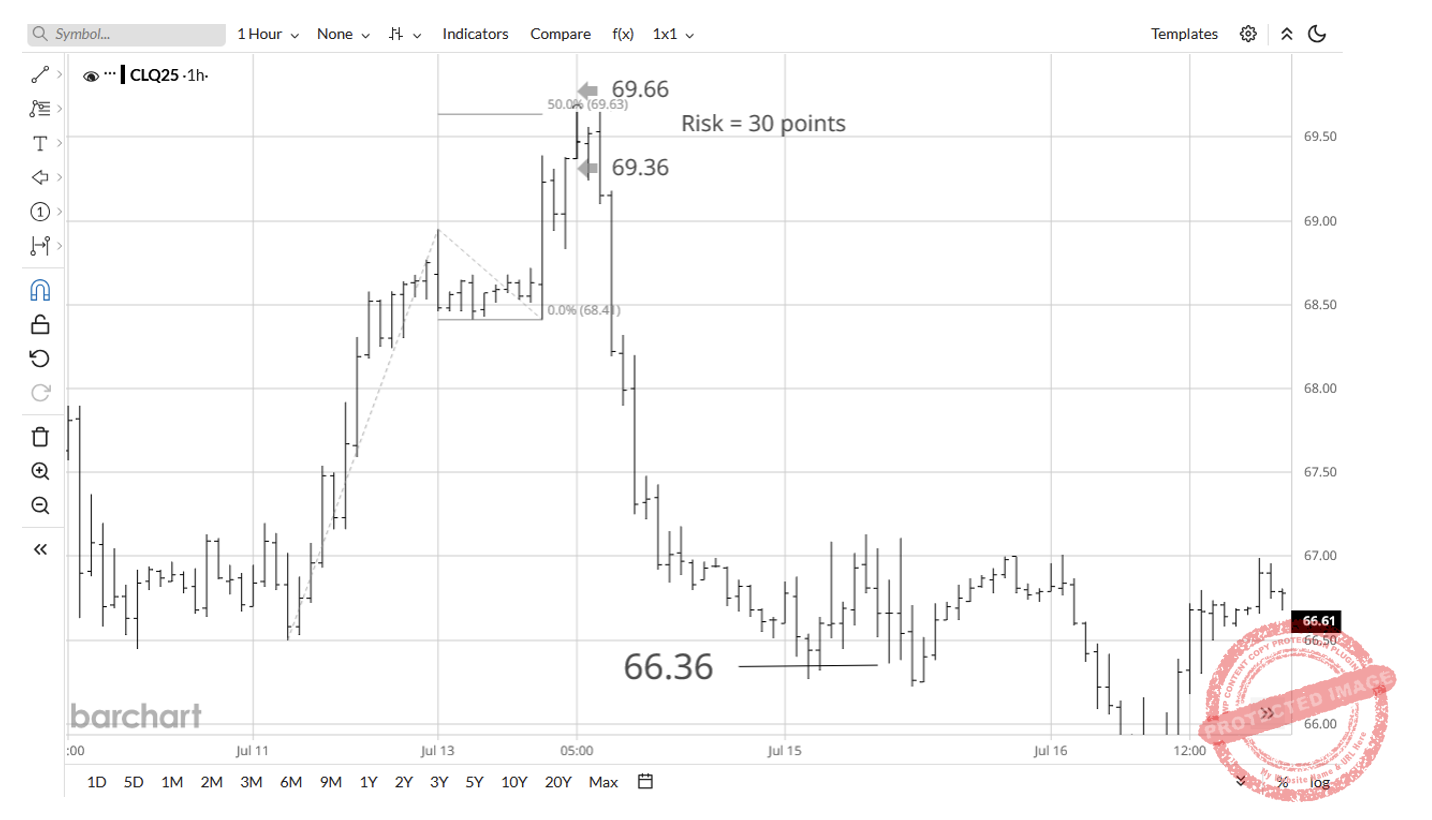
Chart 7
Creating trading plans has been one of the hardest parts of my trading journey – but also the most rewarding to complete and execute.
Happy Trading,
Gus