It Doesn’t Have to be Perfect
This month’s article takes a look at some typical price analysis and trade execution but thanks to a particular case study, shows that as traders we need not seek perfection in all areas to achieve a profitable end result.
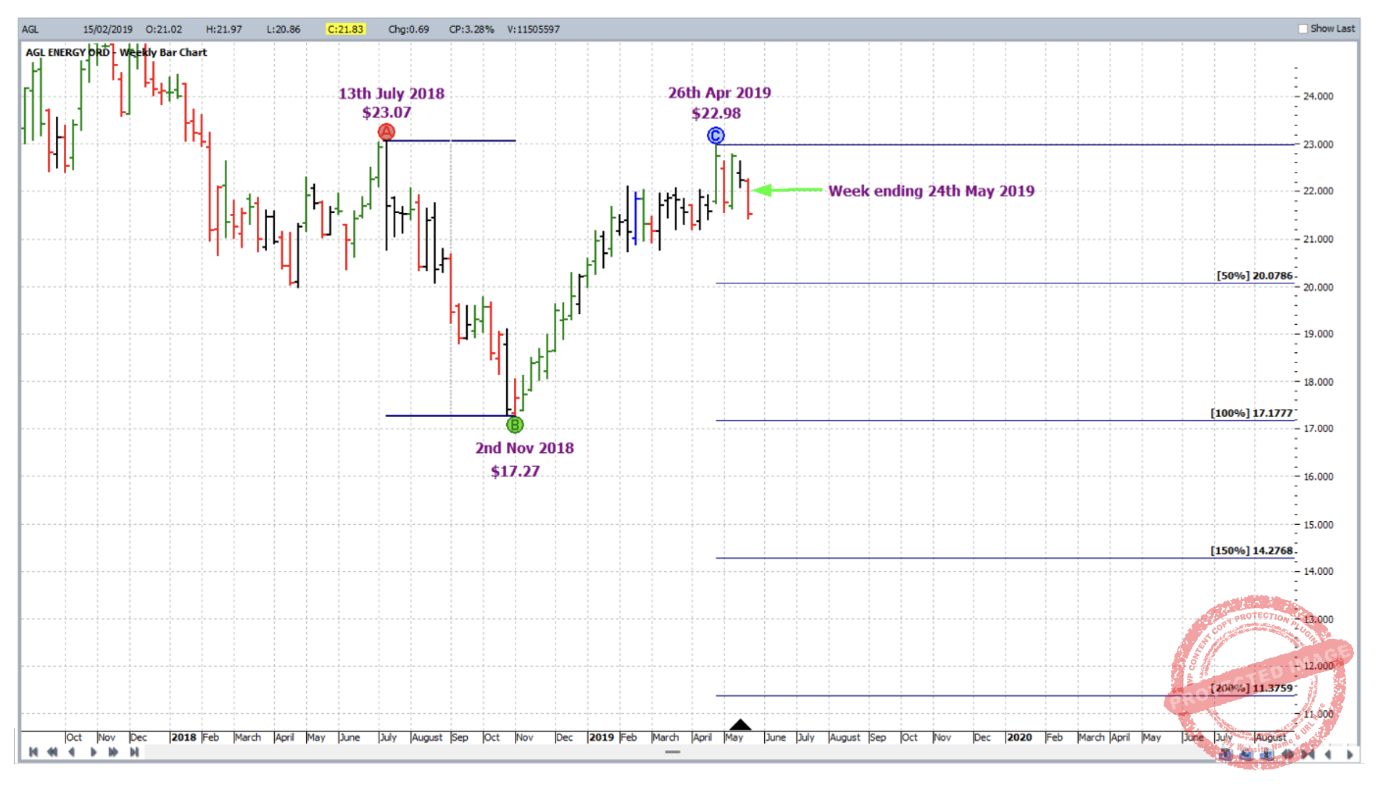
The market of this case study is Australian top 200 member AGL:ASX. As at 26 April 2019 this market reached $22.98 and was at a potential double top formation with the 09 July 2018 high ($23.07). These double tops were near the 50% resistance level of the Ranges Resistance Card applied from the April 2017 high ($28.19) to the October 2018 low ($17.27). This is shown on the ProfitSource chart below in Walk Thru mode.
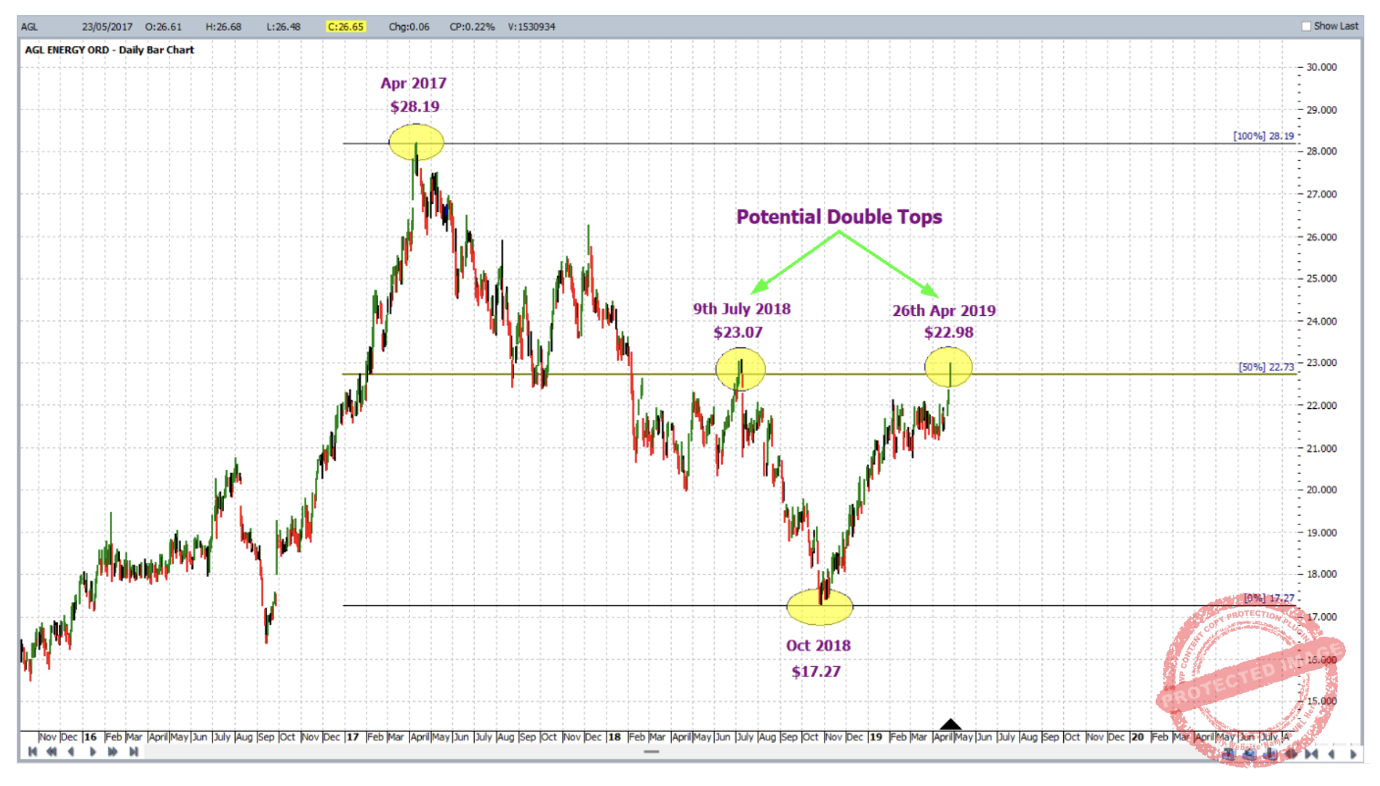
Here we have an example to challenge the perfectionist in many of us. Note above that both the July 2018 and April 2019 tops were definite breaks of the 50% resistance level. Yes we use percentage errors to work out how much error to tolerate and or compare error to the size of an average daily bar in the market, but still – it doesn’t have to be perfect! Let’s therefore assume that the Ranges Resistance Card above still has enough merit to add to the potential double top formation.
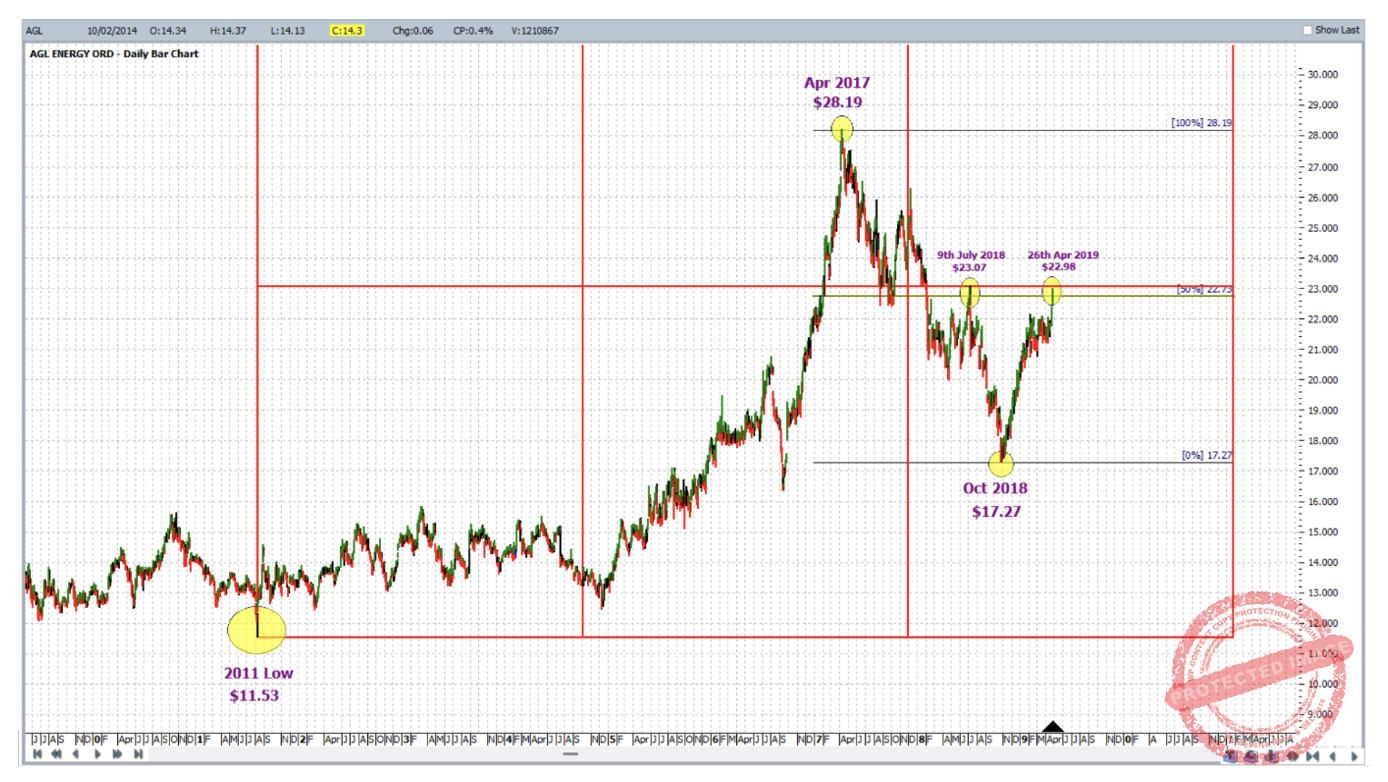
Zooming out we also note that the potential double top formation was at a 100% multiple of the major low of 2011 of $11.53; this is an example of the application of a Lows Resistance Card.
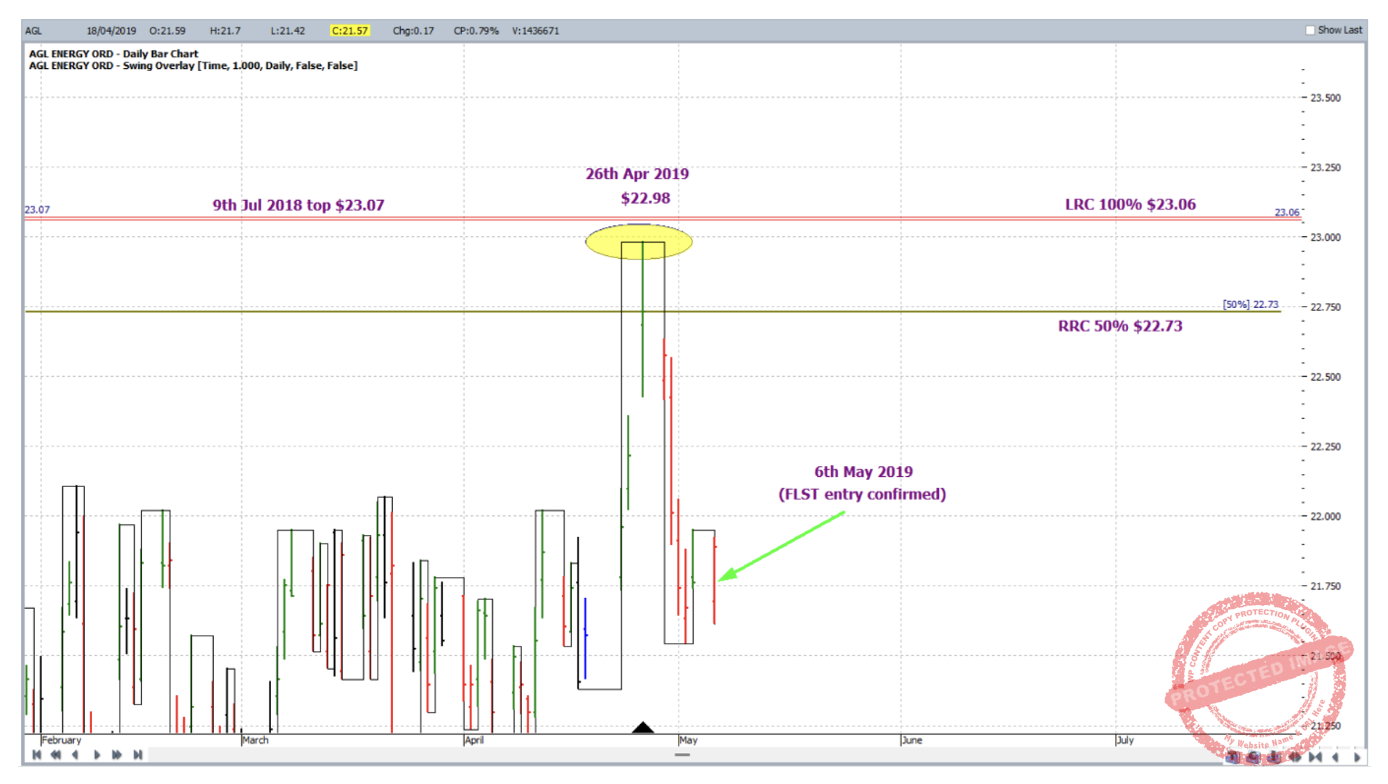
With enough reason to trade, let’s look at a trade entry out of this set up. On 6 May 2019, a first lower swing top entry on the daily chart was triggered. Zooming right into the market action this is shown below with the aid of the daily swing chart overlay and the original analysis inputs also.
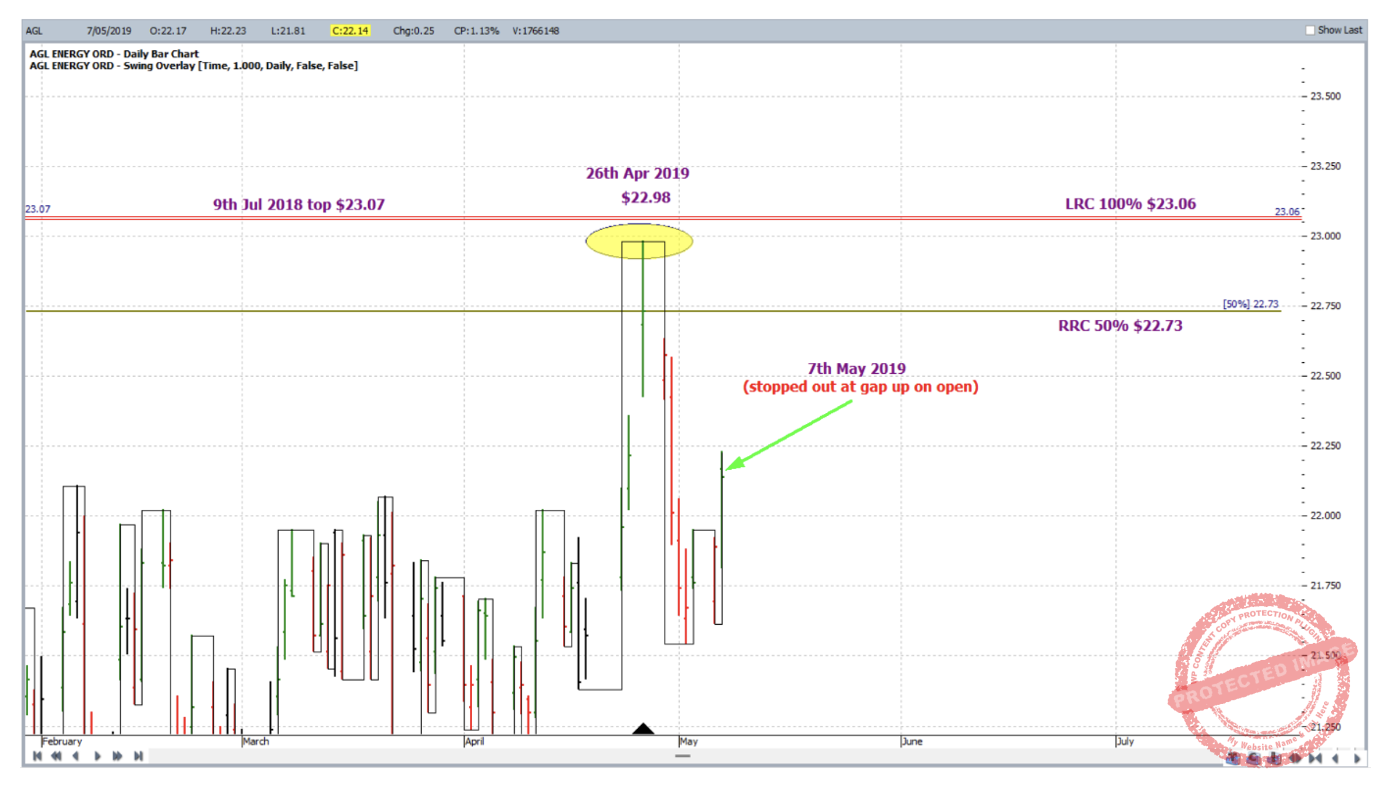
Well and good, we’re in short but have a look at the next day. 7 May 2019 sees us stopped out of the position with a strong gap up. Ouch! The loss basically doubled so almost two units of risk gone already…
Having had a little time to lick the wounds we re-asses. After all, double tops at a price cluster is a strong set up, so can we have a go at getting back on board? As shown below, by the end of the following week (that ending Friday 17 May 2019) the market still sat below the price cluster.
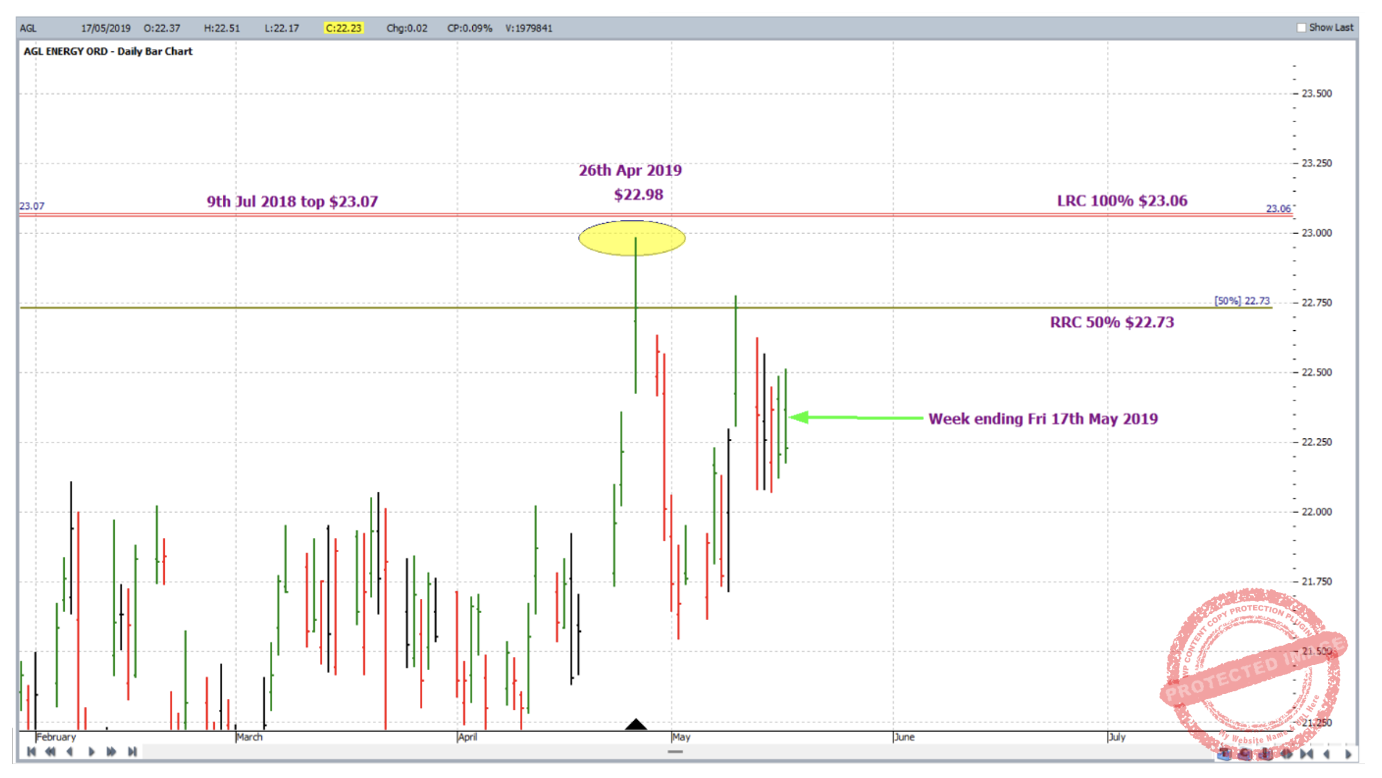
If less sure about the strength or integrity of a setup we look for more or at least stronger confirmation. And the weekly chart can offer this.
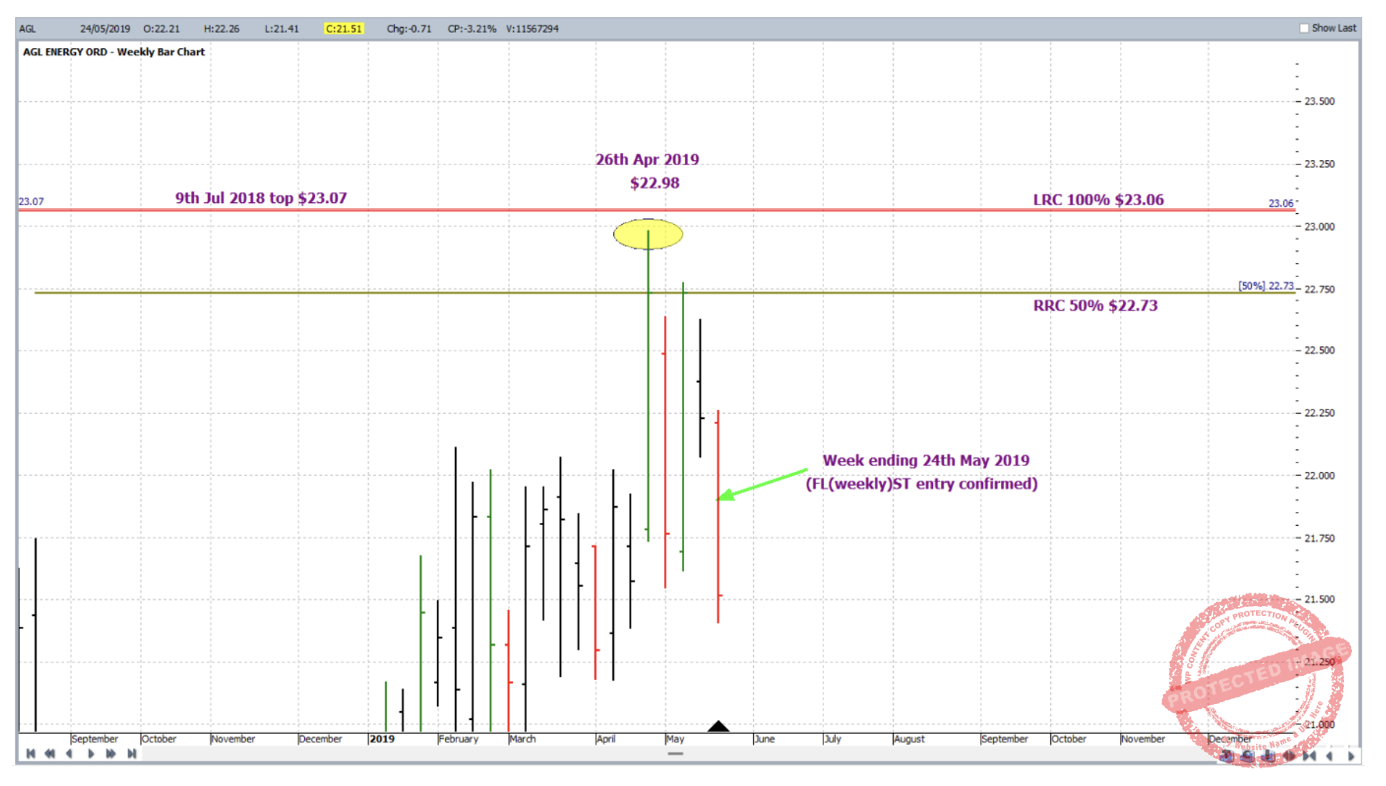
Switching to the weekly chart, it offered a first lower weekly swing top entry during the following week’s trading (week ending Friday 24 May 2019), having you short again at $22.06 with initial exit stop at $22.78; note that a small sized inside week (week ending 17 May 2019) helped to keep low the points risked per CFD at this the second attempt to get on board.
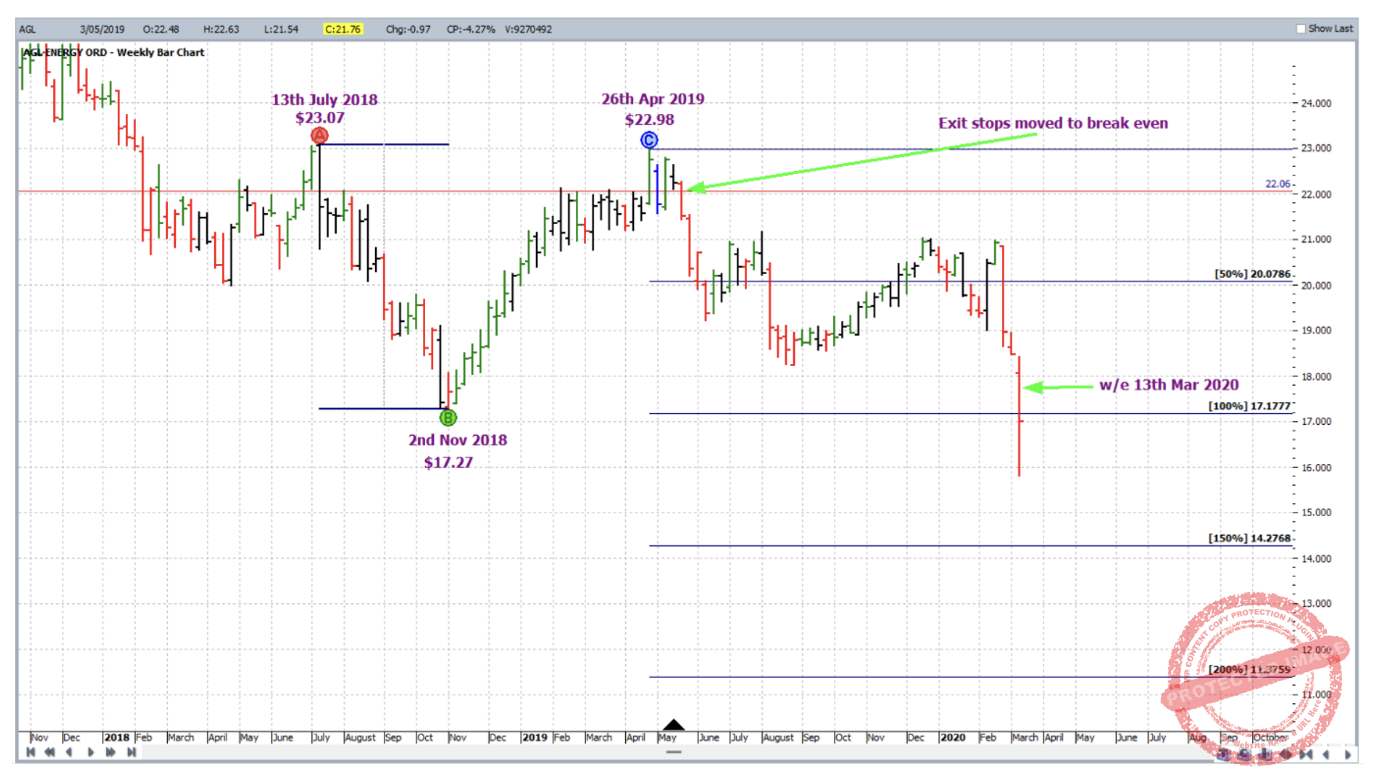
Now that we’re back in what about the trading plan? As per the Number One Trading Plan manual, we expect double tops to run to 200% therefore $11.38 will be the exit target as shown in the screenshot below followed by the ABC Point Details box.
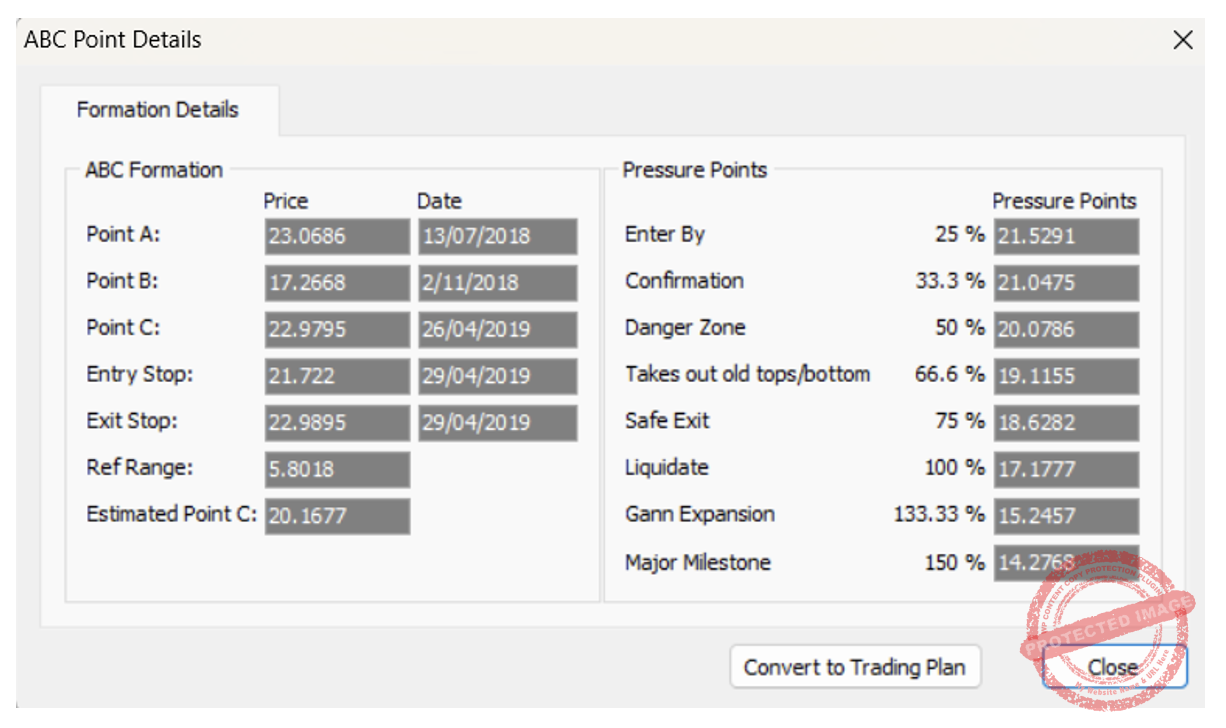
Instead of moving stops at every (milestone) multiple of 25%, stops will only be moved once the market reaches 100% and then 150%. These levels are, after all, at half way and three quarters of the way through the expected run to 200%. And when you think of it, that’s the same as what a standard ABC traded Currency style asks us to do – act at half way, act at three quarters of the way. That’s the theoretical reason for stop movement. More practically though we are allowing the market plenty of room to breathe on the way down.
By week ending 13 March 2020, the market reached the 100% milestone and exit stops were moved to break even.
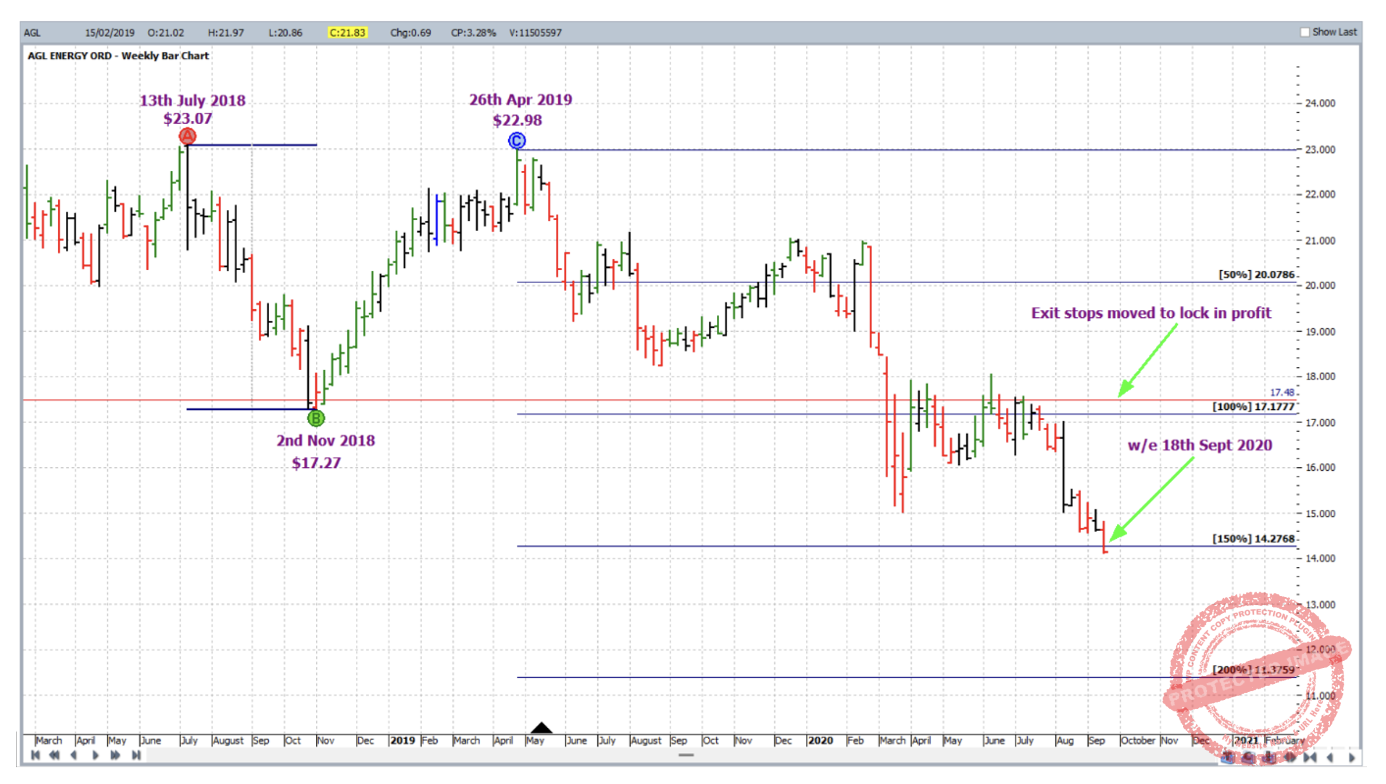
The week ending Friday 18 September 2020 saw the market reached the 150% milestone and exit stops were moved to one third of the average weekly range (roughly 30 points based on the last 60 weekly trading bars at the time) above the 100% milestone.
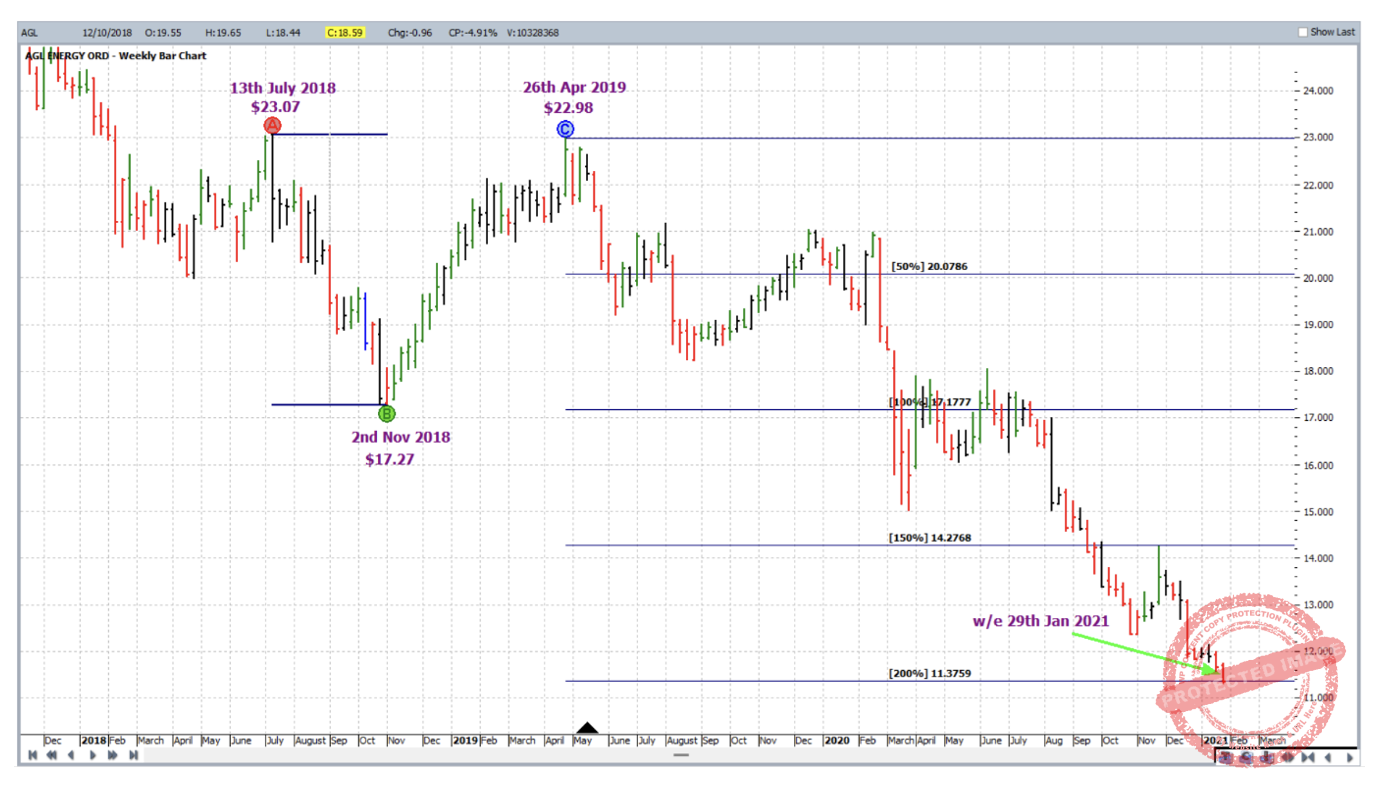
During the week ending 29 January 2021 the market reached the 200% milestone and profit was finally taken. Definitely a slow trade, and more suited to those comfortable with a lower cadence.
Often the conscious or subconscious need to be perfect holds us back. This is common in trading especially with those who come from a more technically inclined back ground. A way to get around this is to focus more on the end result. This case study is an example of how we may do this, so therefore let’s breakdown the rewards. Starting with reward to risk ratio:
Initial Risk: 22.78 – 22.06 = $0.72 = 72 points (point size is 0.01)
Reward: 22.06 – 11.38 = 10.68 = 1068 points
Reward to Risk Ratio = 1068/72 = approximately 15 to 1
If 5% of the account size was risked at entry, the growth in account size from this trade alone would be as follows:
15 x 5% = 75%
If we include two units of risk lost at the start, reward to risk ratio could be considered as roughly 13 to 1 with gain in trading account capital still at 65%.
With 5% of a $10,000 account risked at entry, the reward in Australian dollars would be:
15 x $500 = $7,500 (or less two units of risk for approximately $6,500)
Work Hard, work smart.
Andrew Baraniak