When is a Fifty a Strong Fifty?
Sometimes hearing a technique discussed so often makes you numb to its potential. We can get caught up in the mystery of advanced methods, always chasing the “next best” technique before we make full use of the earlier ones and realising their fullest potential.
What if you became so dialled in on one or two techniques or setups that you became an expert on them?
Take the 50% retracement, for example. Could it form the centrepiece of a universal trading plan? It’s one of the easiest tools to apply and calculate manually. But how well do you really know this technique, and importantly, where would you expect it to occur?
Let’s look back at a few examples on the SPI200 to see how the market behaved at the time. My aim here isn’t to prove the 50% works every time, rather, to find setups that did and didn’t work to better understand why!
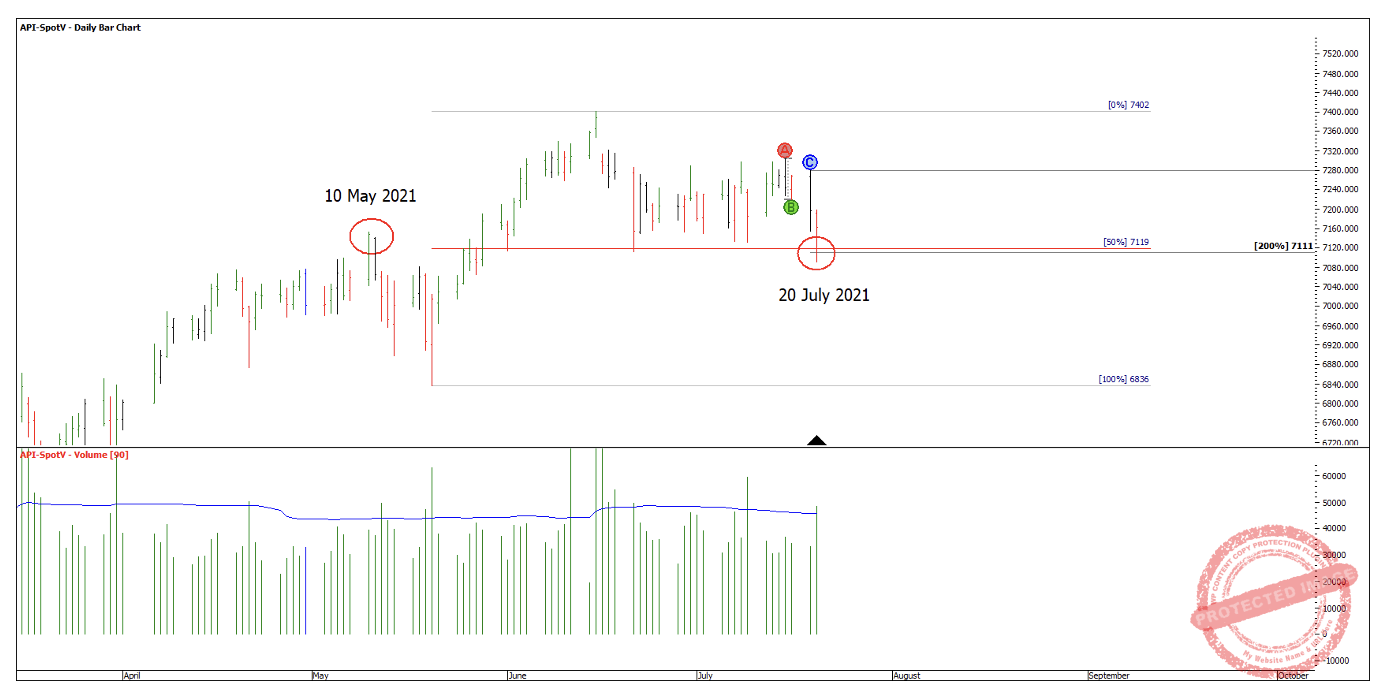
Chart 1
In the first case above, there is a double bottom on a 50% weekly swing retracement with the 200% milestone clustering at the same point. There was a clear spike in volume on the 20 July low, which also sat on the old 10 May weekly swing top.
The resulting weekly ABC pattern ran to the 75% milestone, marking the end of the move. With an intraday entry as the market moved back up through the 50%, this trade offered the potential for a strong double-digit Reward-to-Risk Ratio (RRR).
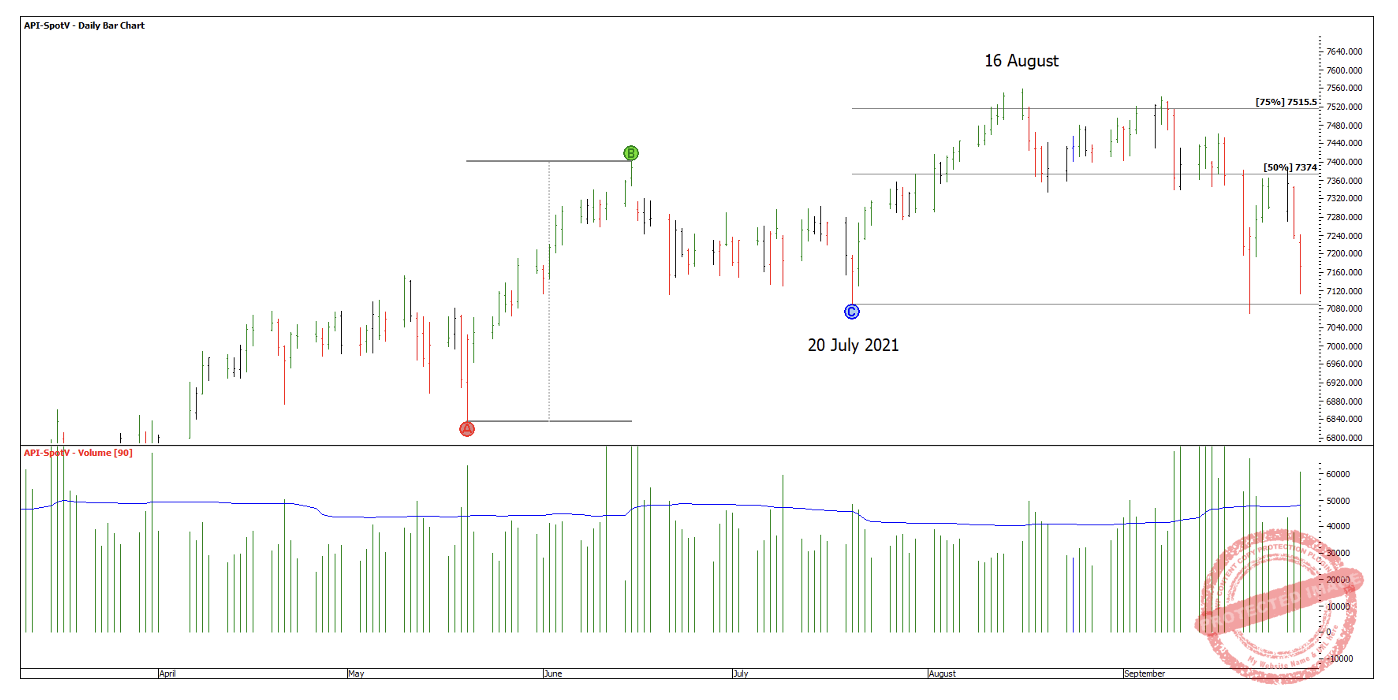
Chart 2
On 31 May 2022, the SPI200 pushed through the 50% weekly swing retracement before dropping back underneath it. A lower top formed under both the 50% retracement and a 50% milestone of the last daily swing range. For two days, the market repeatedly tested this level from below, which offered multiple shorting opportunities.
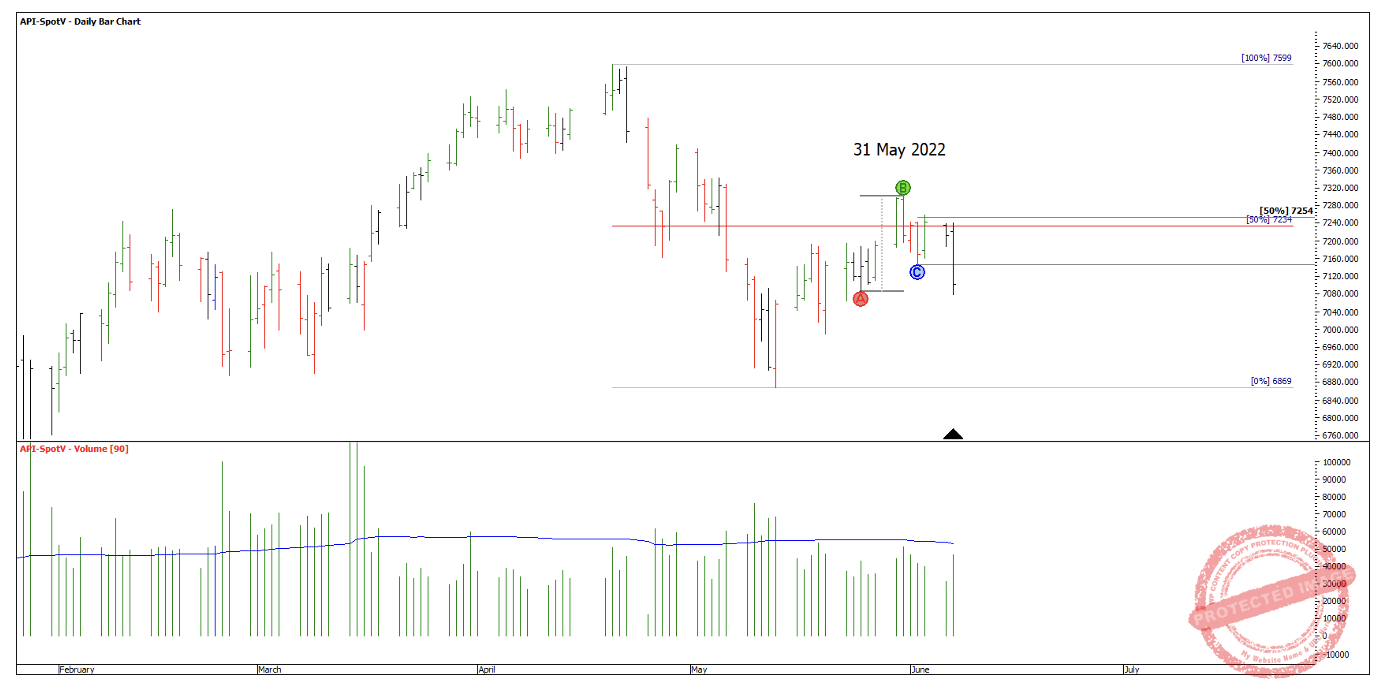
Chart 3
This trade eventually ran to 133% of the previous range and was a strong move providing a great RRR return.
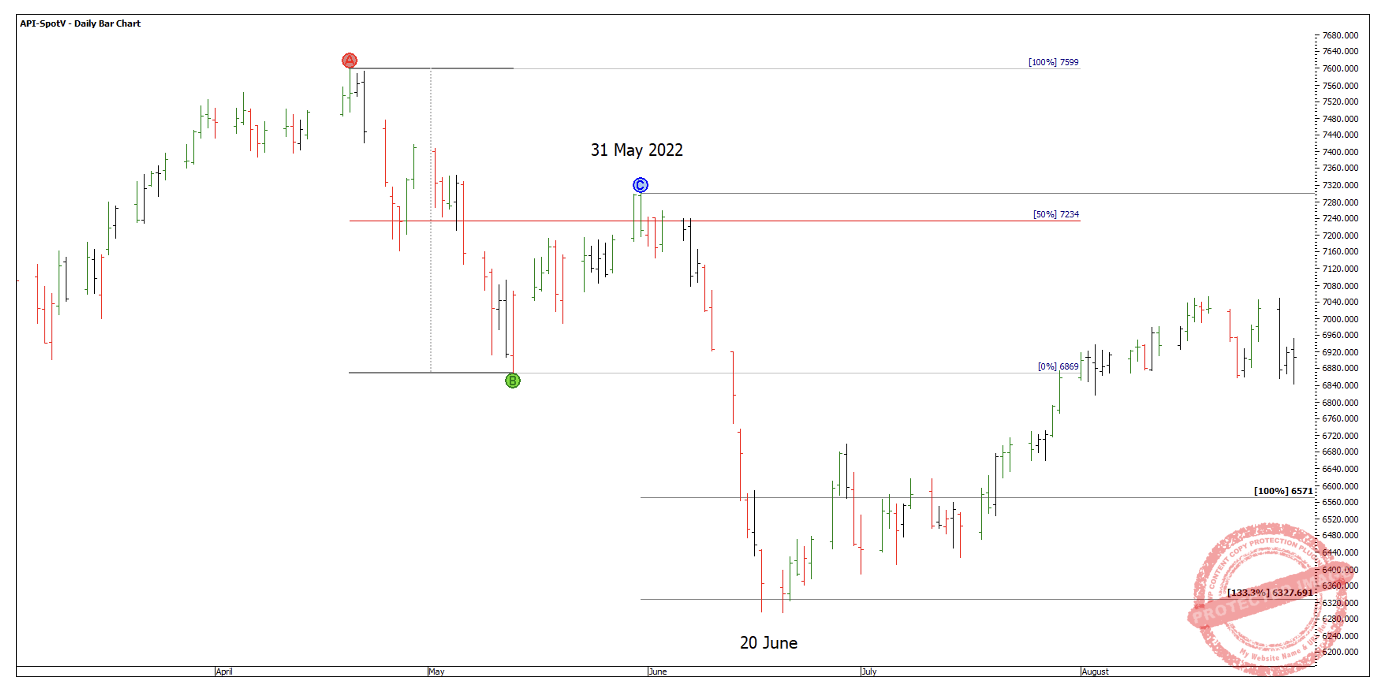
Chart 4
On 7 March 2023, another short trade appeared. The 50% retracement aligned with a small 200% of the First Range Out. The inside day on 9 March pushed one point above the 50% before closing beneath it, with a small volume spike on the day.
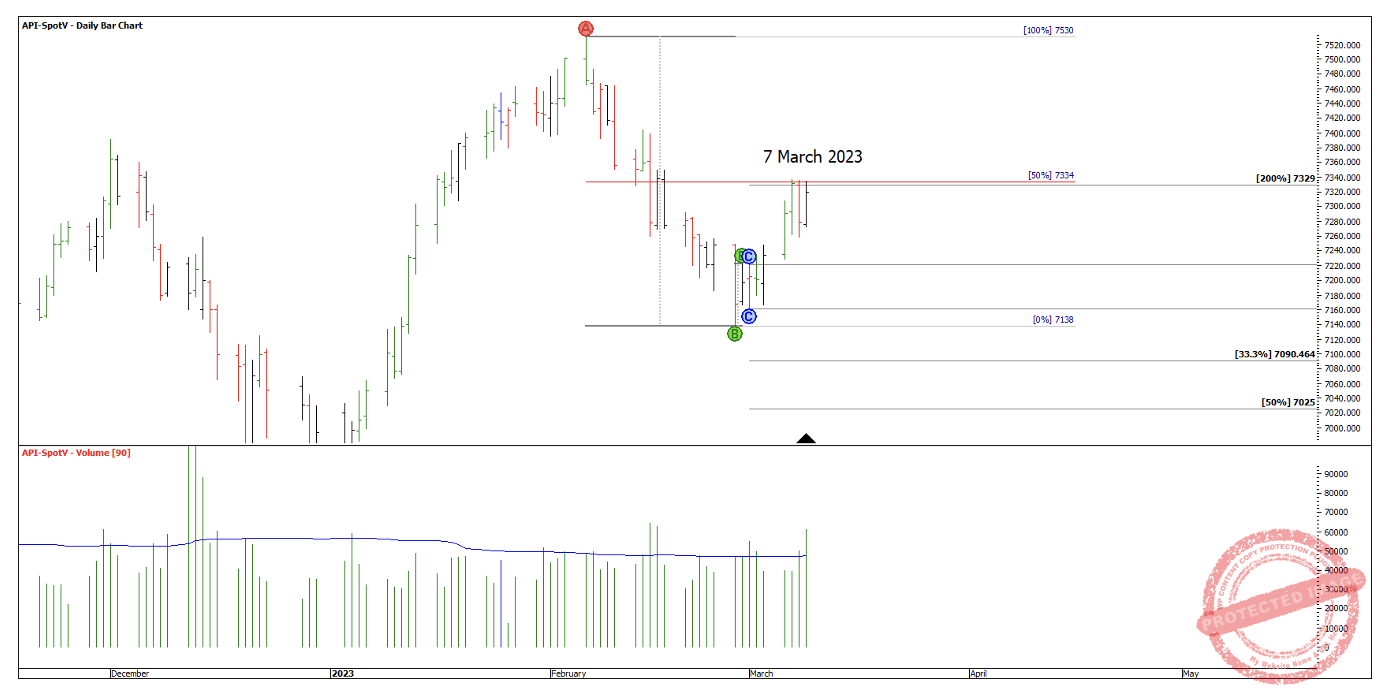
Chart 5
This weekly ABC trade carried just beyond 100% of the previous week’s range. Notably, this was also contract rollover into June.
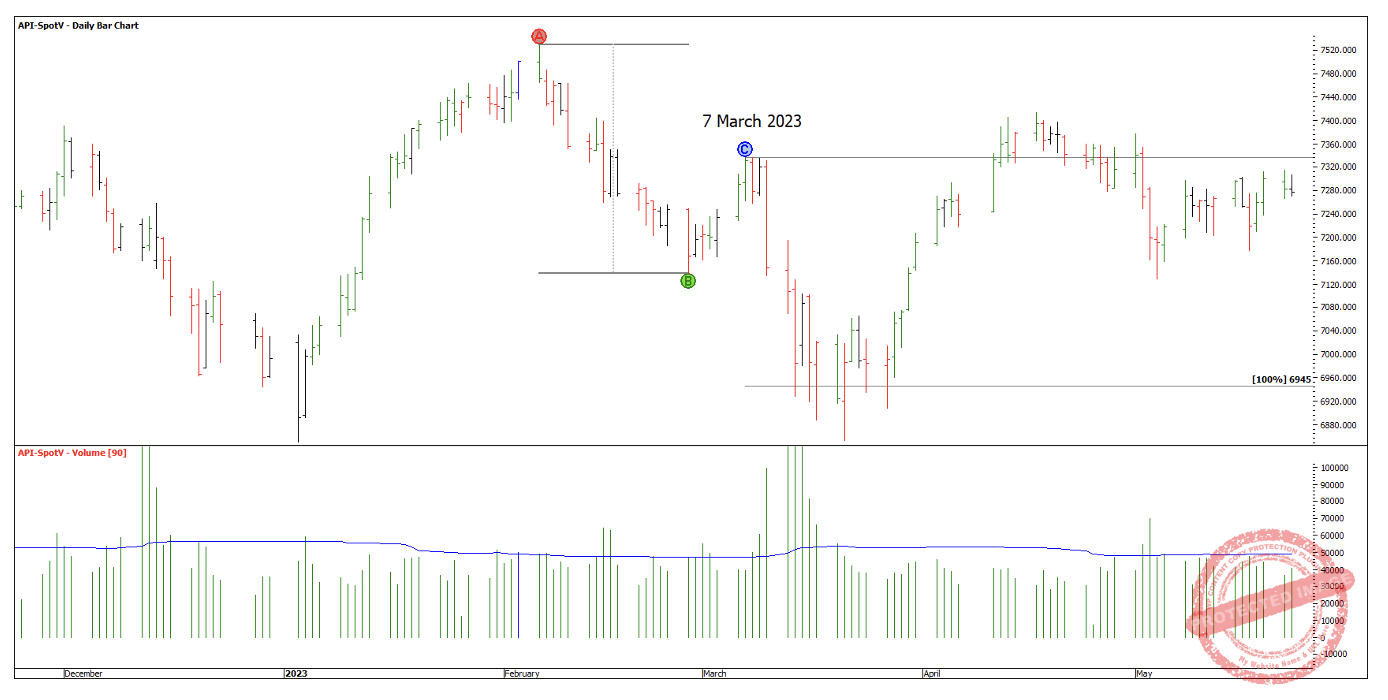
Chart 6
The 4 May 2023 low showed the 50% retracement was present, as was 300% of the last daily swing range, along with a volume spike the day before the low.
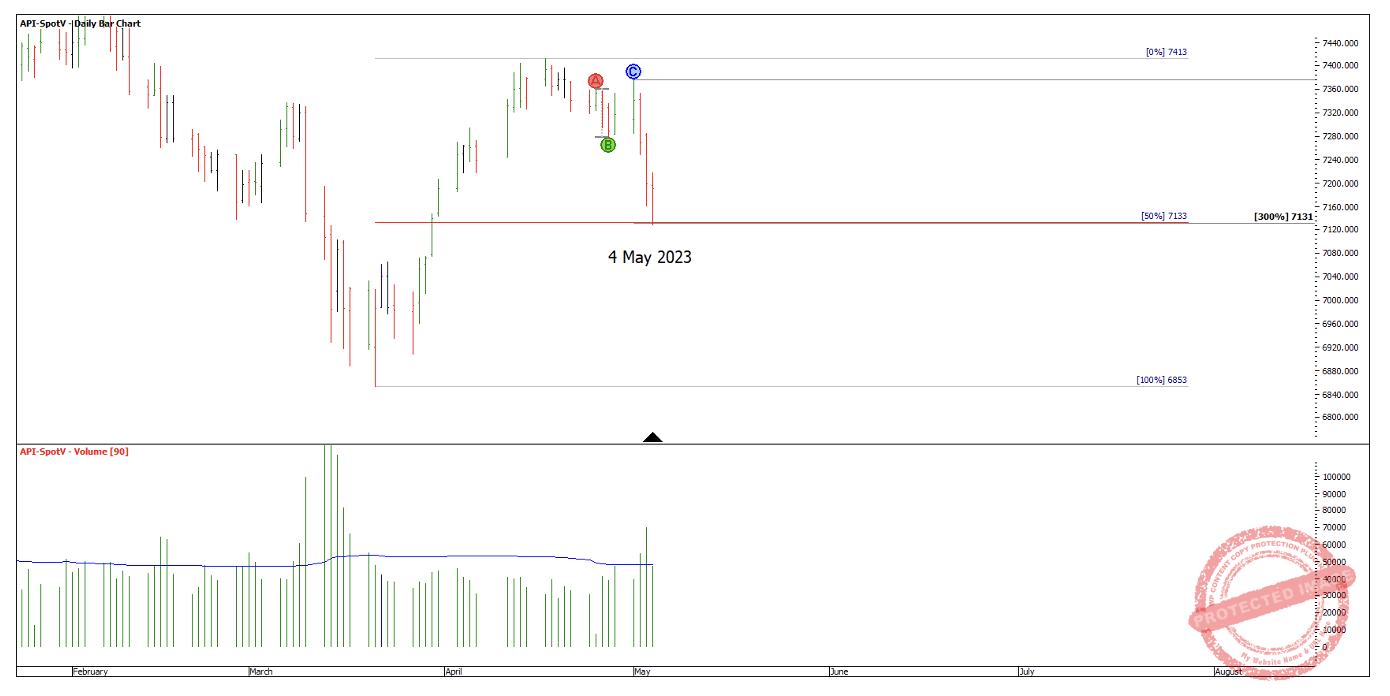
Chart 7
The move fizzled quickly, though there was enough time to move stops to break-even, covering the risk. Was there something about this pattern that hinted at weakness? Perhaps the shape of the pull back into the low looks a bit odd? Also, there was no old weekly swing high the market was sitting on here.
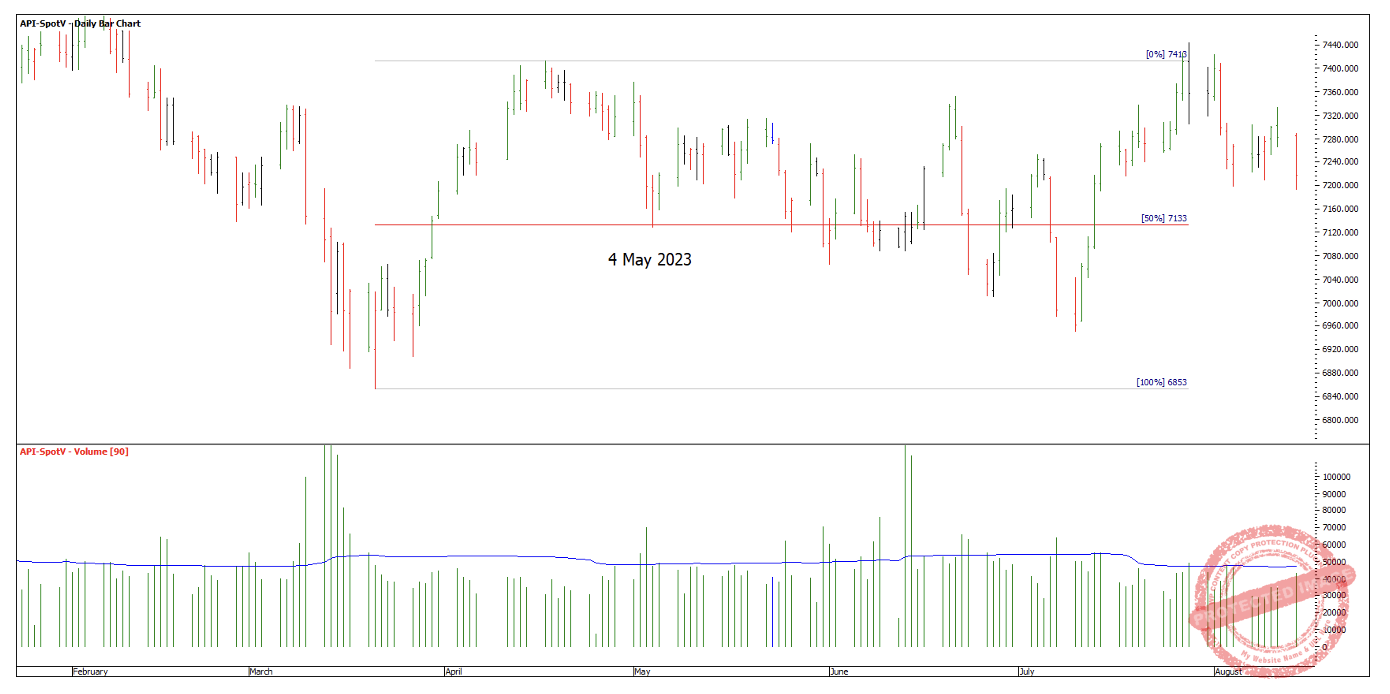
Chart 8
On 18 January 2024, a 50% weekly swing retracement combined with 100% of the daily First Range Out and nearly 200% of the last daily swing into the low. The day that hit the 50% also saw a small spike in volume, and the low sat on an old weekly swing high from October.
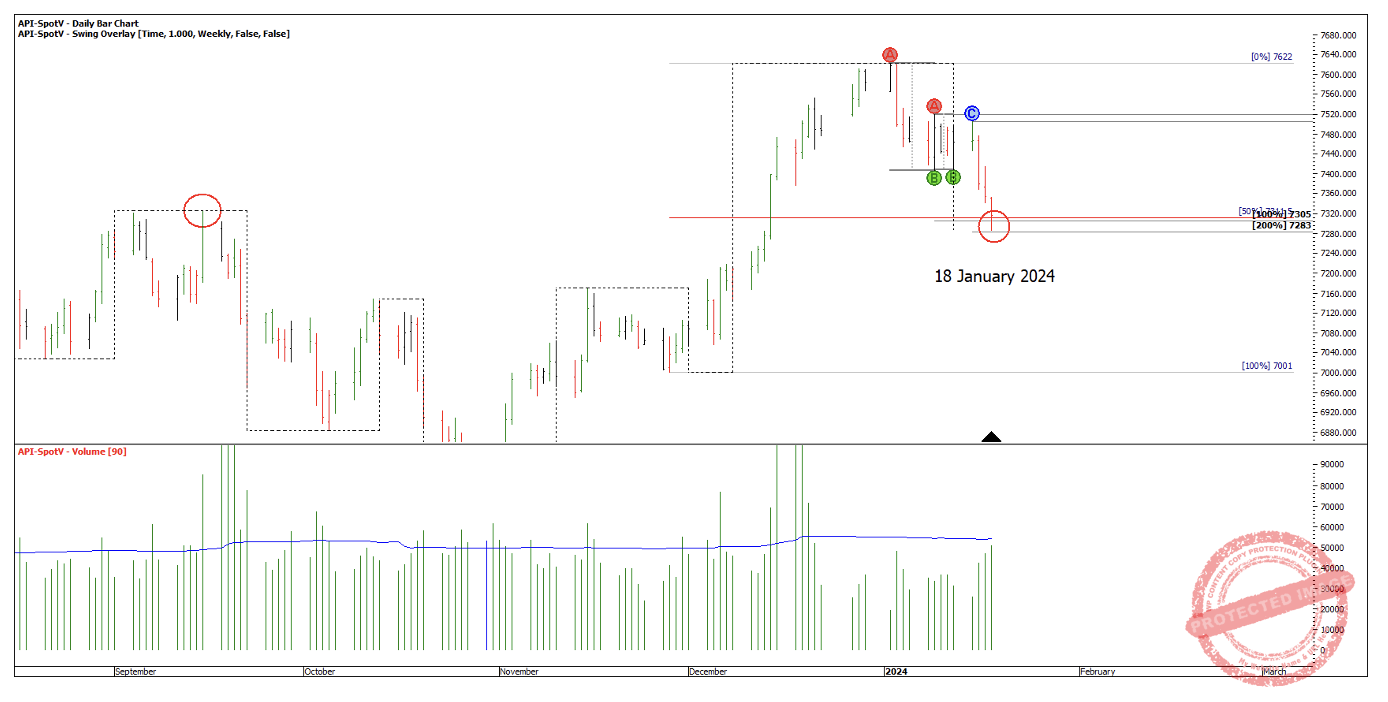
Chart 9
This market had plenty of upside from there, though it developed slowly. Still, the initial rally offered a very healthy RRR.
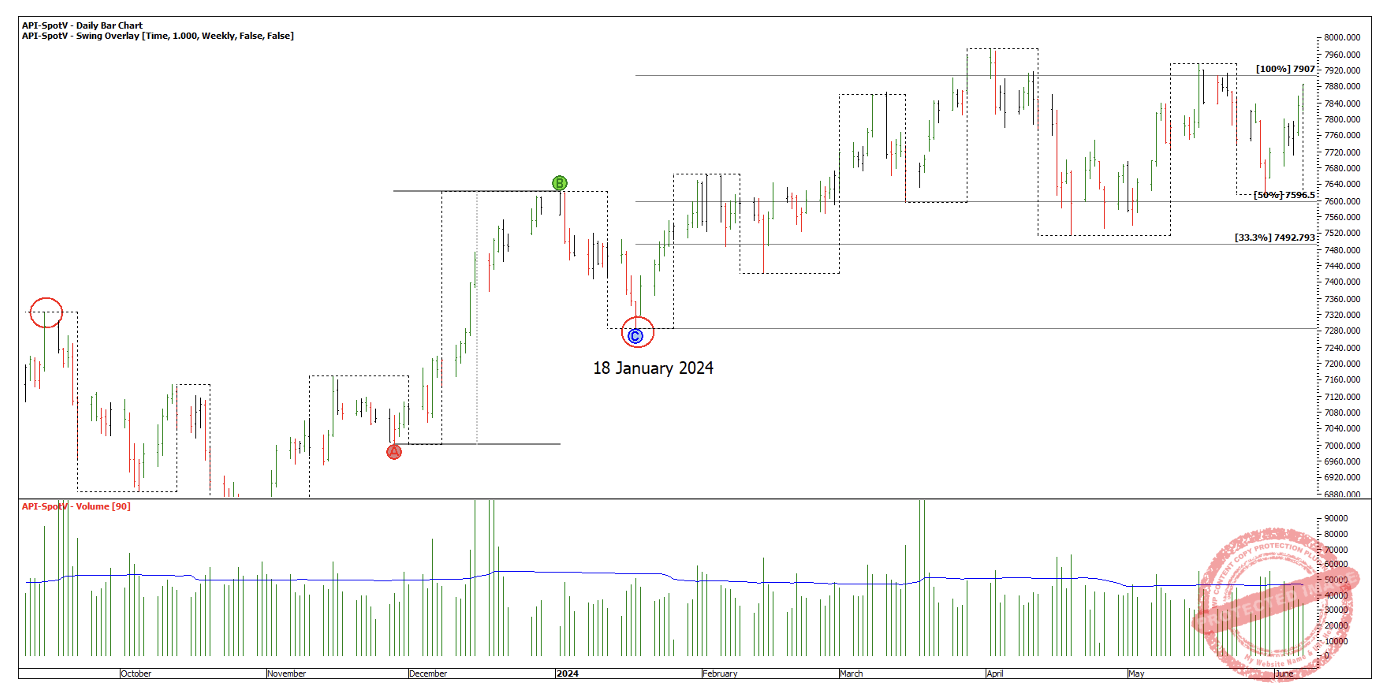
Chart 10
This approach shows the value of getting familiar with a technique. Take the time to look at good examples and bad ones. What does a good one look like? Is there a tell-tale or something that just looks odd about a bad one?
Having the confidence to either get in or sit out can only be developed by looking at plenty of examples and studying the market action!
Happy Trading,
Gus