A Tale of Three Trades
Continuing the discussion from the Safety in the Market Newsletter earlier in the month, I’m going to take a further look at the 50% retracement Trading Plan in practice and three trades that I personally took this month.
Now my analysis plan says look for a Weekly Point C with Three to Four Sections into a 50% retracement.
The three markets up for discussion are Soybeans, SPI200 and Nikkei Dow. These three markets made weekly Point C’s on a 50% retracement or did they!?
Trade 1: Soybeans
I see two daily swings down into a 50% retracement on 4 September, followed by two more daily swings down into a little double bottom on 11 September which was a higher bottom than the 4 September low.
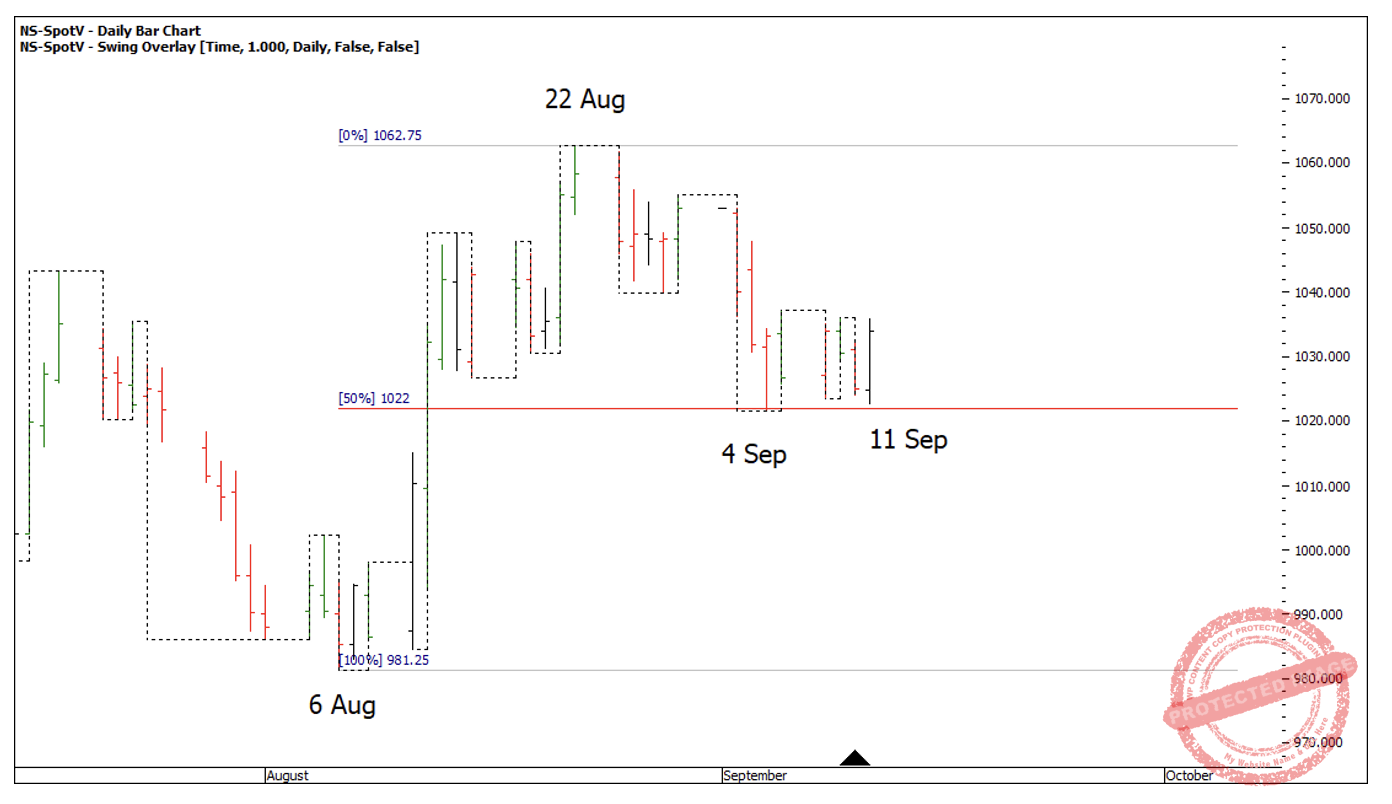
Chart 1
As Soybeans moved away from my point of entry, I was able to move my stop to break even only to see my trade stopped out on Friday night with a very small profit I would call break even.
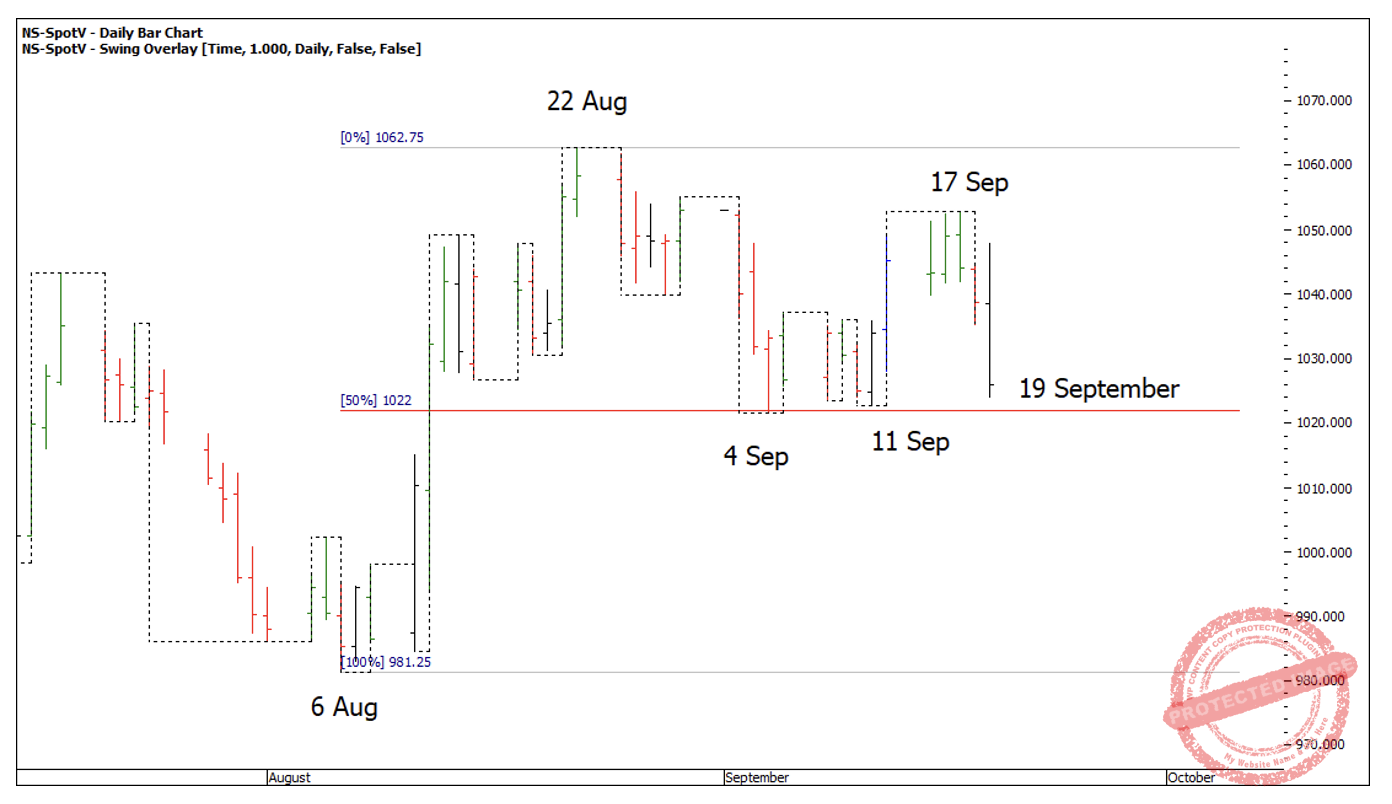
Chart 2
Post trade analysis:
What can I learn from this trade? Do I need to be more specific in my Analysis Plan regarding how the three to four sections into 50% looks? In this trade, If I call between 4 September and 11 September section 3 and 4, do I need to clarify that Section 3’s low has to be below the low of Section 2? Or does Section 3 have to touch 50%?
Trade 2: SPI200
The SPI200 initially made a 62.5% retracement that clustered with 150% of the daily First Range Out (FRO) that sat on top of an old weekly swing high from July. The daily swing overbalanced to the upside then came back to sit on the weekly 50% retracement and also had a daily double bottom.
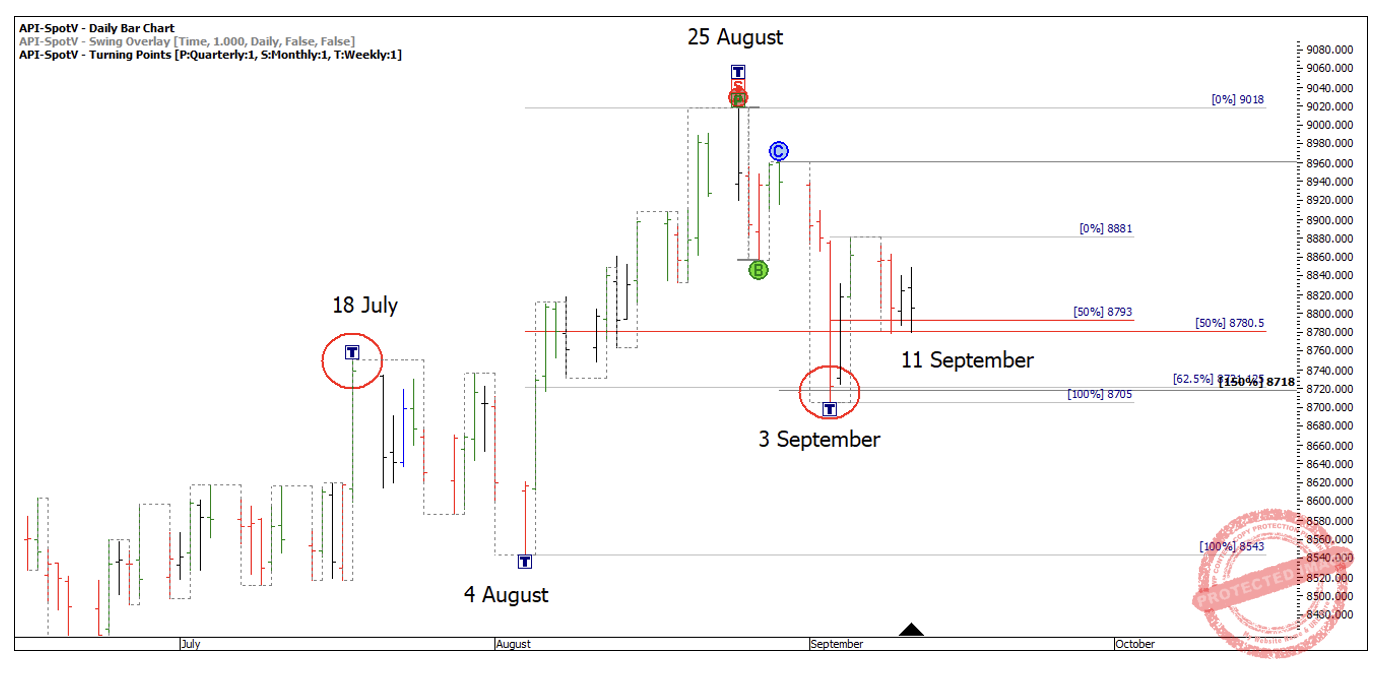
Chart 3
As the market moved away from point of entry, I could move my trailing stop loss to break even to cover all risk on the trade, but only to be stopped out on this trade as well!
Post trade analysis:
What can I learn from this trade? This trade clearly doesn’t satisfy my rules of three to four sections into a 50% retracement. Nonetheless this can often be a great trading opportunity, potentially it’s the bigger picture position that I need to consider.
Trade 3: Nikkei Dow
This setup offered three sections into 50% with a repeating daily range, followed by a daily higher bottom. The 1 September low was also sitting on the 24 July weekly swing high.
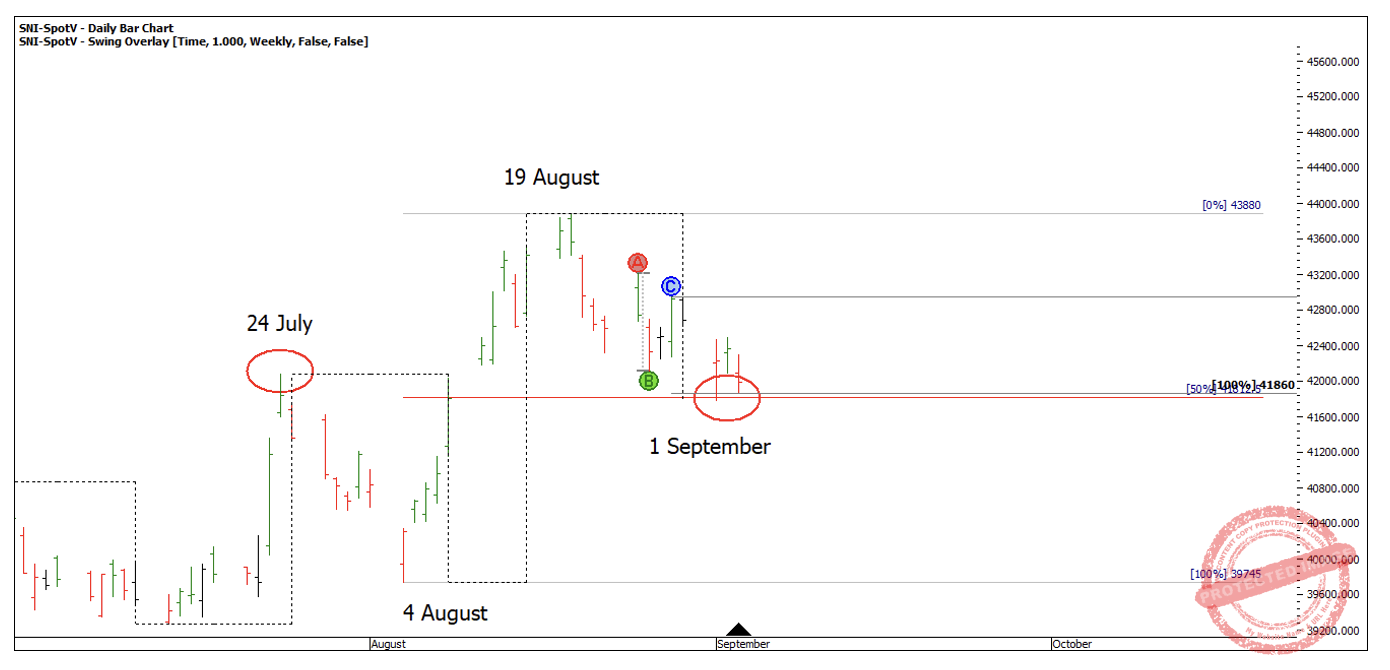
Chart 4
The higher bottom on 3 September produced a nice 4-hour higher bottom with a very easy entry and small risk, followed by a good run up that never looked like retesting the point of entry.
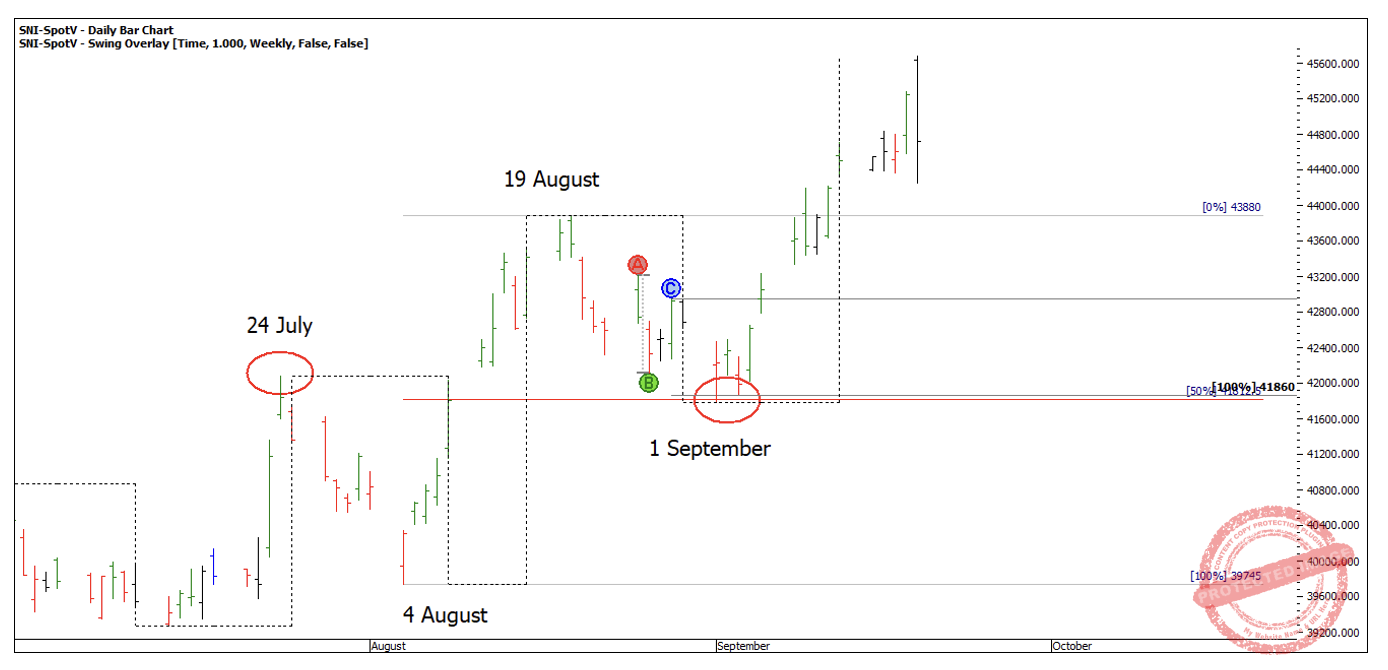
Chart 5
Post trade analysis:
What can I learn from this trade? Was a successful trait of this trade the repeating daily range into 50%? Is it that the daily First Range Out never reaching the 100% milestone? Is it the third section touching the 50% retracement nearly perfectly?
Looking for extra points of interest, it’s worth noting the bigger picture of these three markets, and if you zoom out, Soybeans is still in a tight sideways market, even though it’s making higher bottoms. As soon as I take a look at the big picture, I can instantly see a market that looks a little bit similar to 2019.
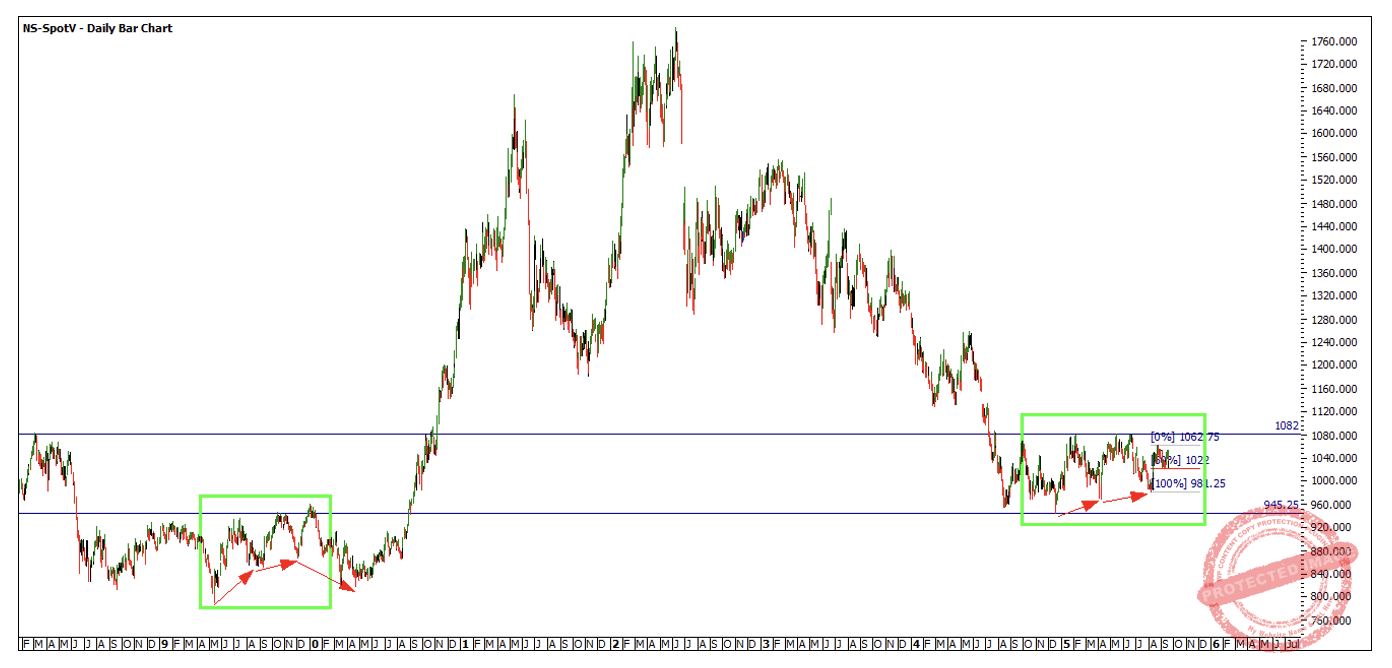
Chart 6
Unlike Soybeans, The SPI on the other hand is making tops in new All-Time Highs. On one hand we are in the winter of the monthly swing and perhaps the Point B resistance is too strong.
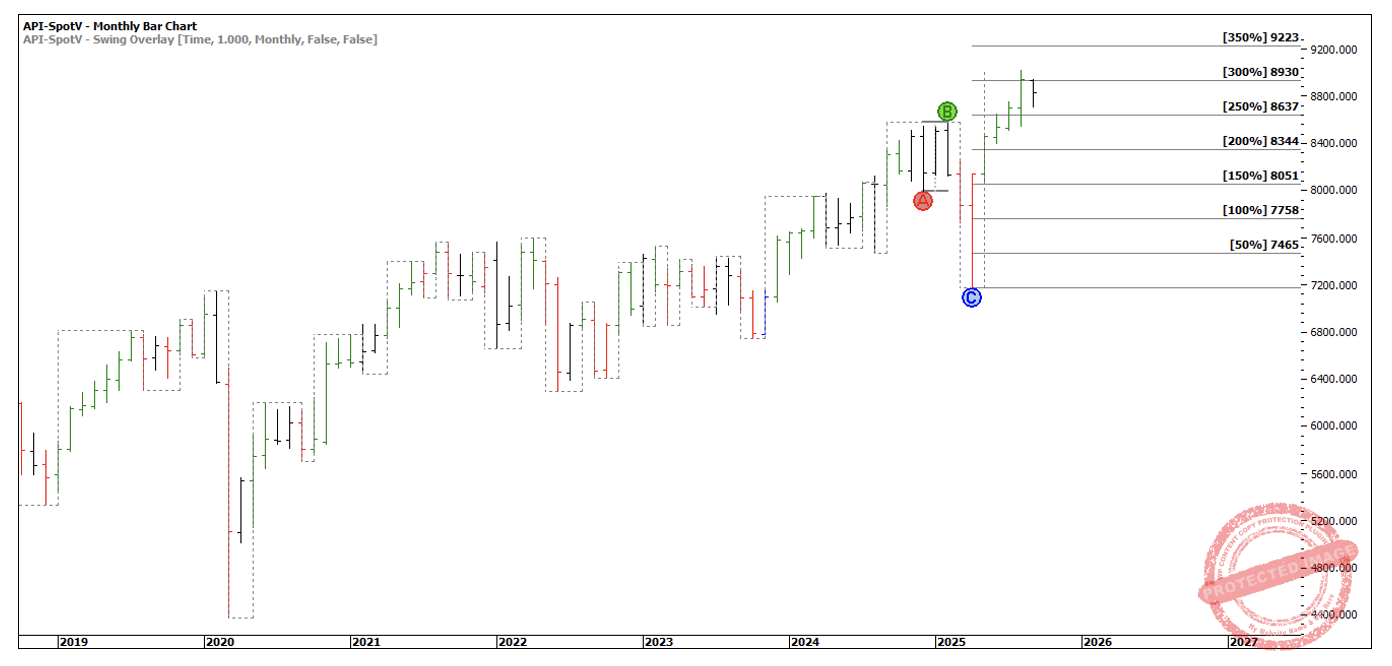
Chart 7
Whereas the Weekly Point C on the Nikkei Dow is sitting just above the 100% milestone of the monthly double bottoms and sitting on a stronger old top from July 2024.
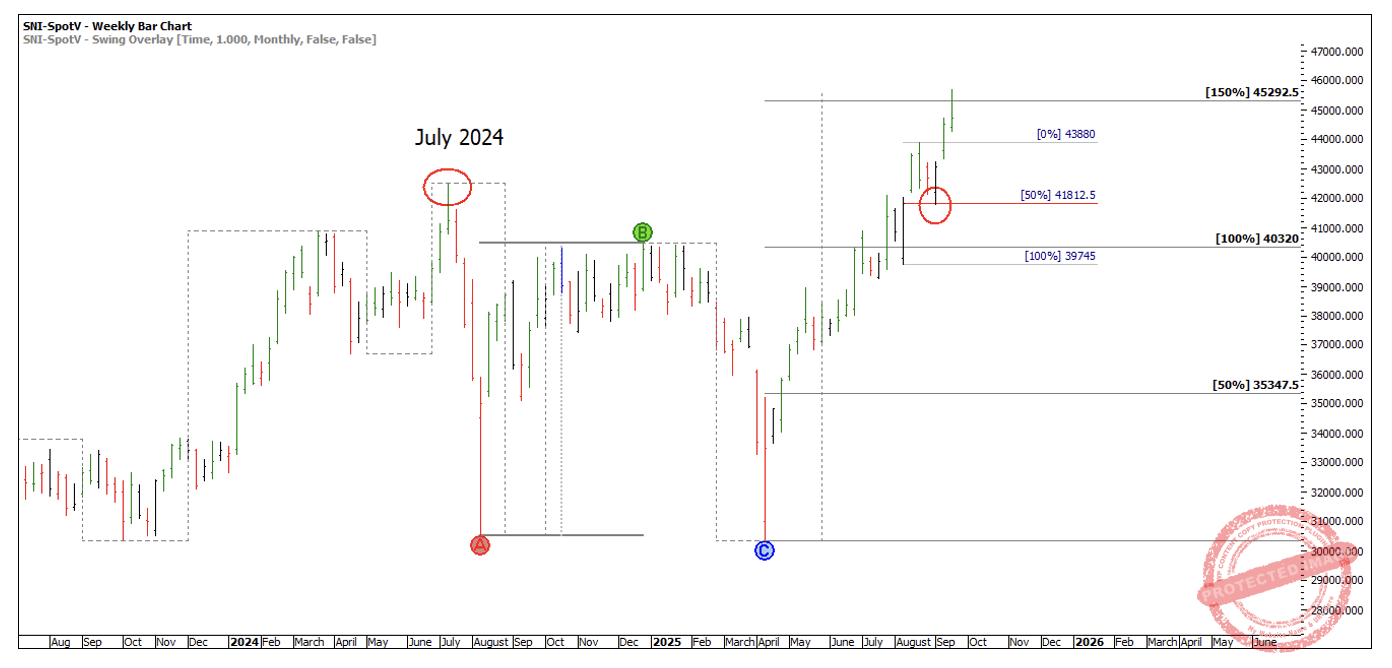
Chart 8
Psychological wrap up:
I’ve been rewarded in September, I’ve had a few break evens, a couple of small loses and one really good double digit, Reward to Risk Ratio trade that has seen my account grow nicely.
What I’ve learnt over the journey is now it’s time to reward myself with some time out of the market. This used to seem counterproductive, but It’s a great way to really savour that feeling of being an exceptional trader, and to also get used to a new account size to then hit the next setup with a clear, fresh outlook, when ever that maybe!
Happy Trading,
Gus