Sideways! Or is it?
That’s the nature of the commodities markets. They can very much be an all or nothing affair. A run up into extreme price territory, and a run back down from it. Then months if not years of sideways action with very little going on at all. In fact, trading a sideways market, and forcing the issue can even chew up a trading account. So, we must be diligent!
Let’s take a look at a few of the main commodity markets over the space of the last year or so. Below, in ProfitsSource’s split screen mode are continuous daily bar charts of Corn, Wheat, Soybeans and Soybean Meal.
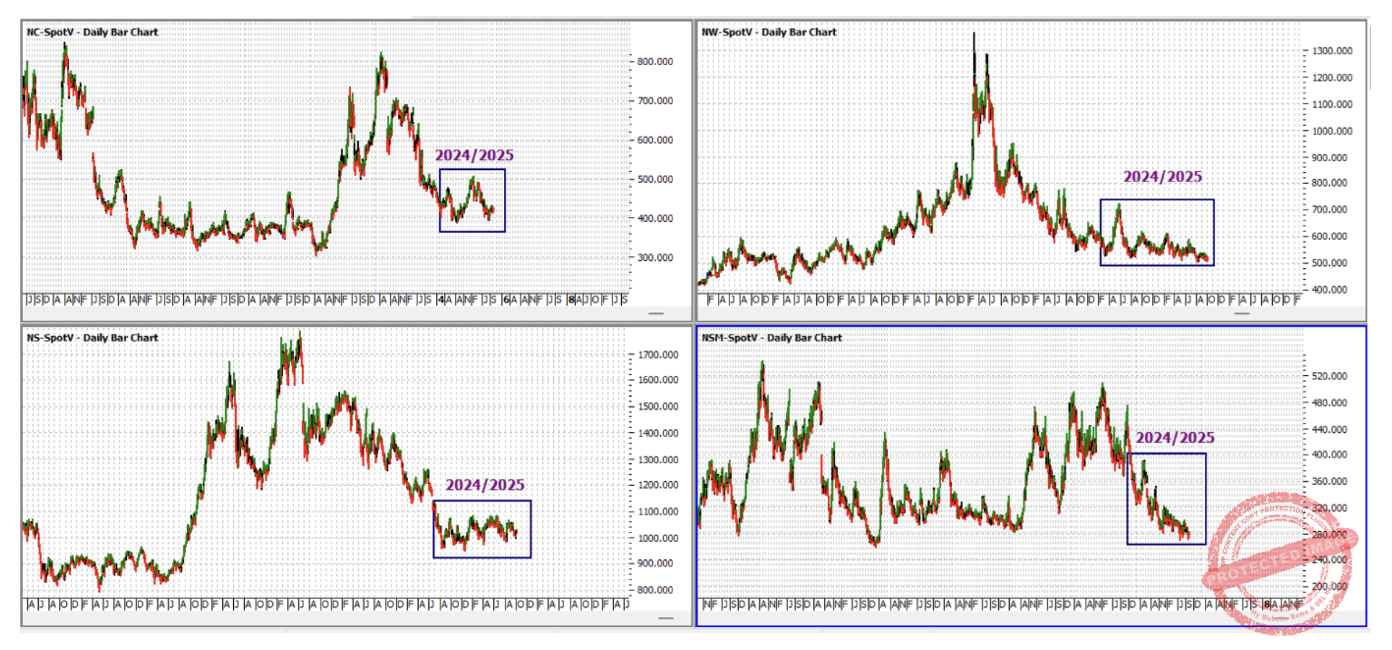
As you can see over the better part of 2024 and 2025, not a lot of volatility has occurred in these markets. Especially in comparison to the years immediately prior. So does that mean we stay out all together? Wait for another big run? Let’s see…
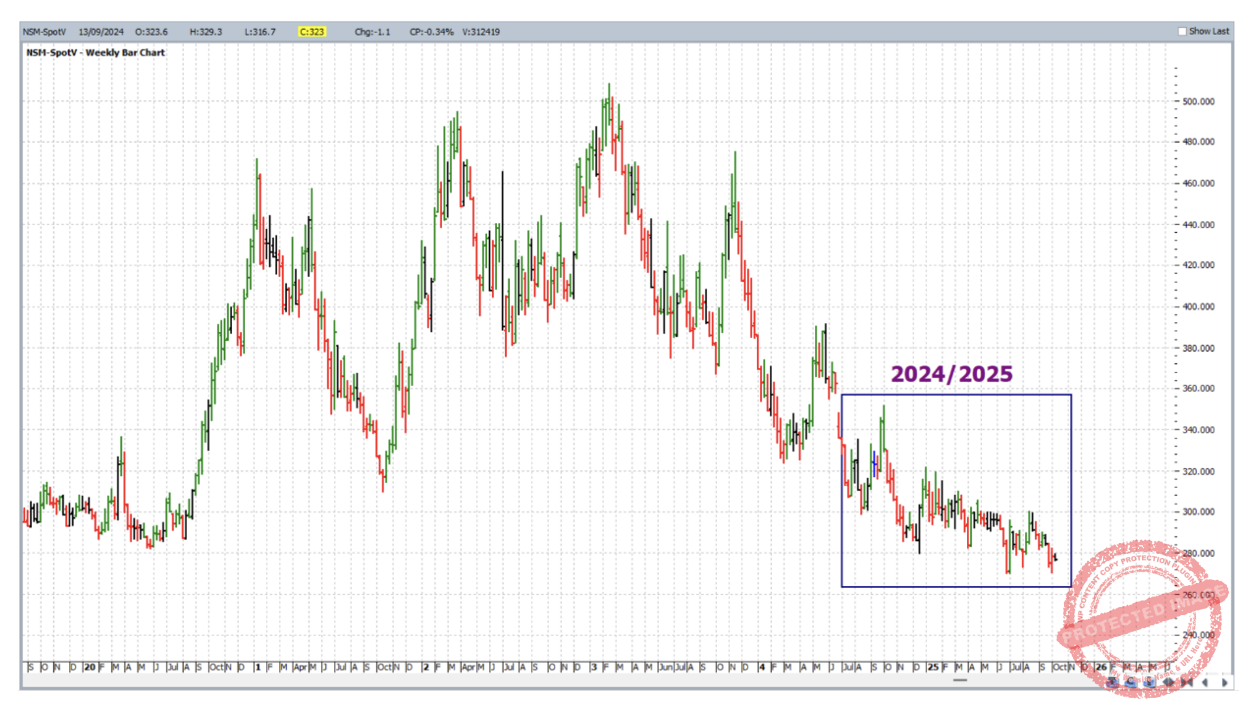
Let’s take a closer look at one of the four markets above – Soybean Meal. Even with the chart at weekly resolution, the ranges of late have been small.
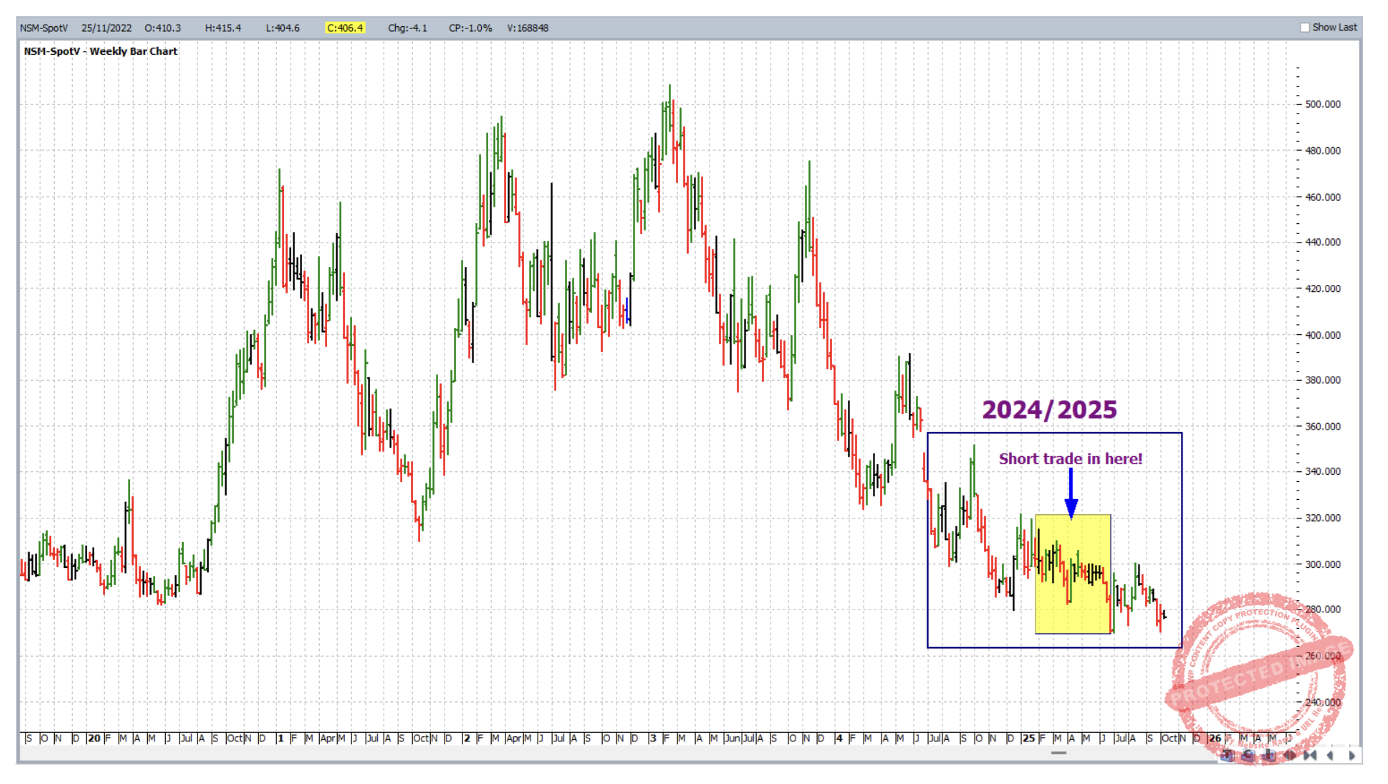
But let’s say, for better or worse, you were persistent and consistent with your trading routine. Were there any opportunities at all during recent times? For reference purposes, the same chart is again below. Highlighted in yellow, this time is the period from February to June of 2025. And as it turns out, during this “sideways” period there was still a reasonably good short trade.
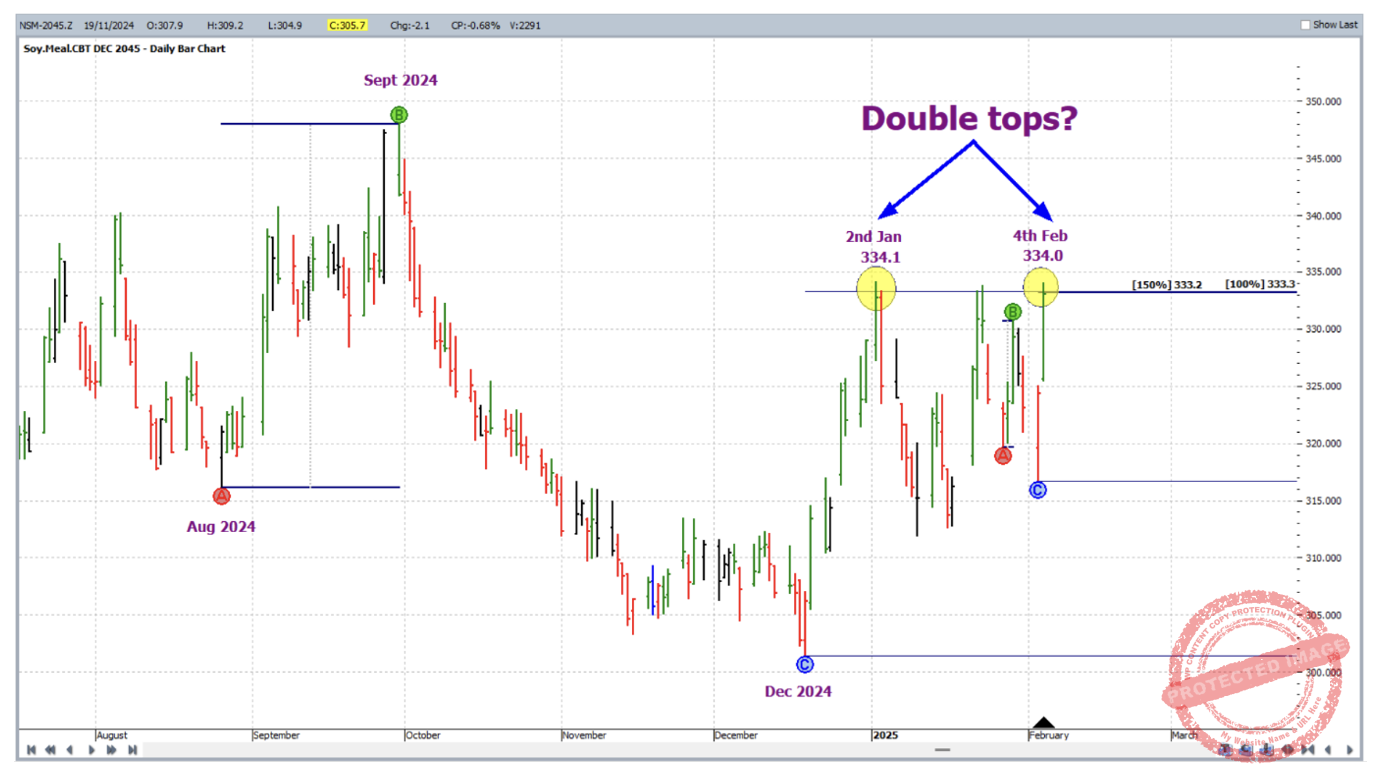
While the continuous chart above gives us a good picture of the technical state of the Soybean Meal futures market, often with a commodity like this it pays to also keep an eye on the individual contract charts. So from this point we will focus our attention on the individual contract chart for the December 2025 contract – ProfitSource chart symbol NSM-2025.Z (note that at the time of writing, a currently known issue with Hubb software has us accessing this chart through symbol NSM-2045.Z).
As at 4 February 2025, this market sat at a high of 334.0 USD per tonne. And at this point there were a few reasons for a reversal. The market sat at a potential double top formation, with the 2 January 2025 high. The range from August to September of 2024 when projected from the December 2024 low had repeated to 100%, and a smaller application of repeating ranges had reached 150%. These ABC applications and the potential double top formation had clustered very closely. See the chart below.
In a market going sideways, ranges are smaller so the big reward to risk ratios are harder to find. Therefore the risk parameters at trade entry need to be spaced over as small a range as possible. So let’s go to the intraday chart for an entry.
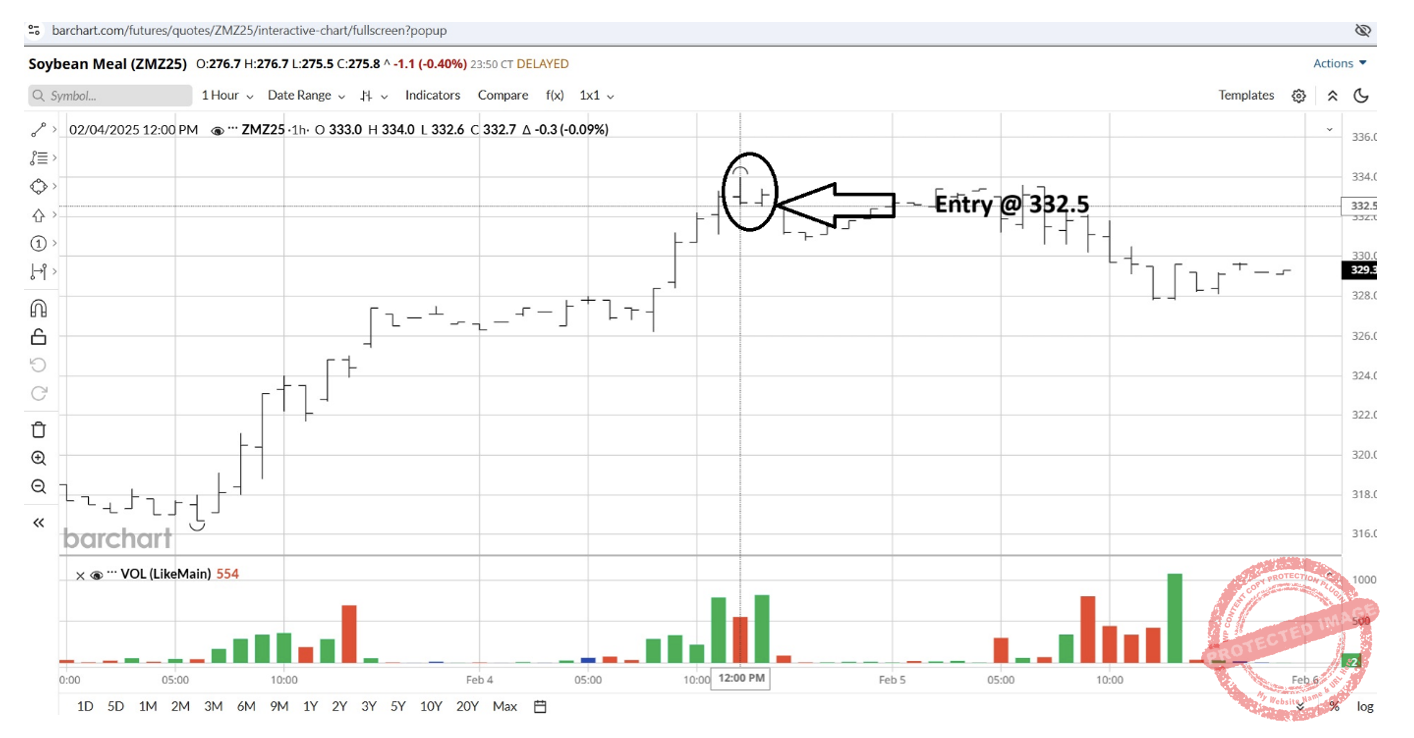
Below is the hourly chart of December 2025 Bean Meal from barchart.com; as the hourly swing chart turned down from the 334.0 high, entry was at 332.5, with initial exit stop at 334.1; this occurred around 1pm Central time on 4 February 2025.
As for trade management, this was a double top formation, so the exit target was set to 200% of the double tops. This is shown below followed by the ABC Details window.
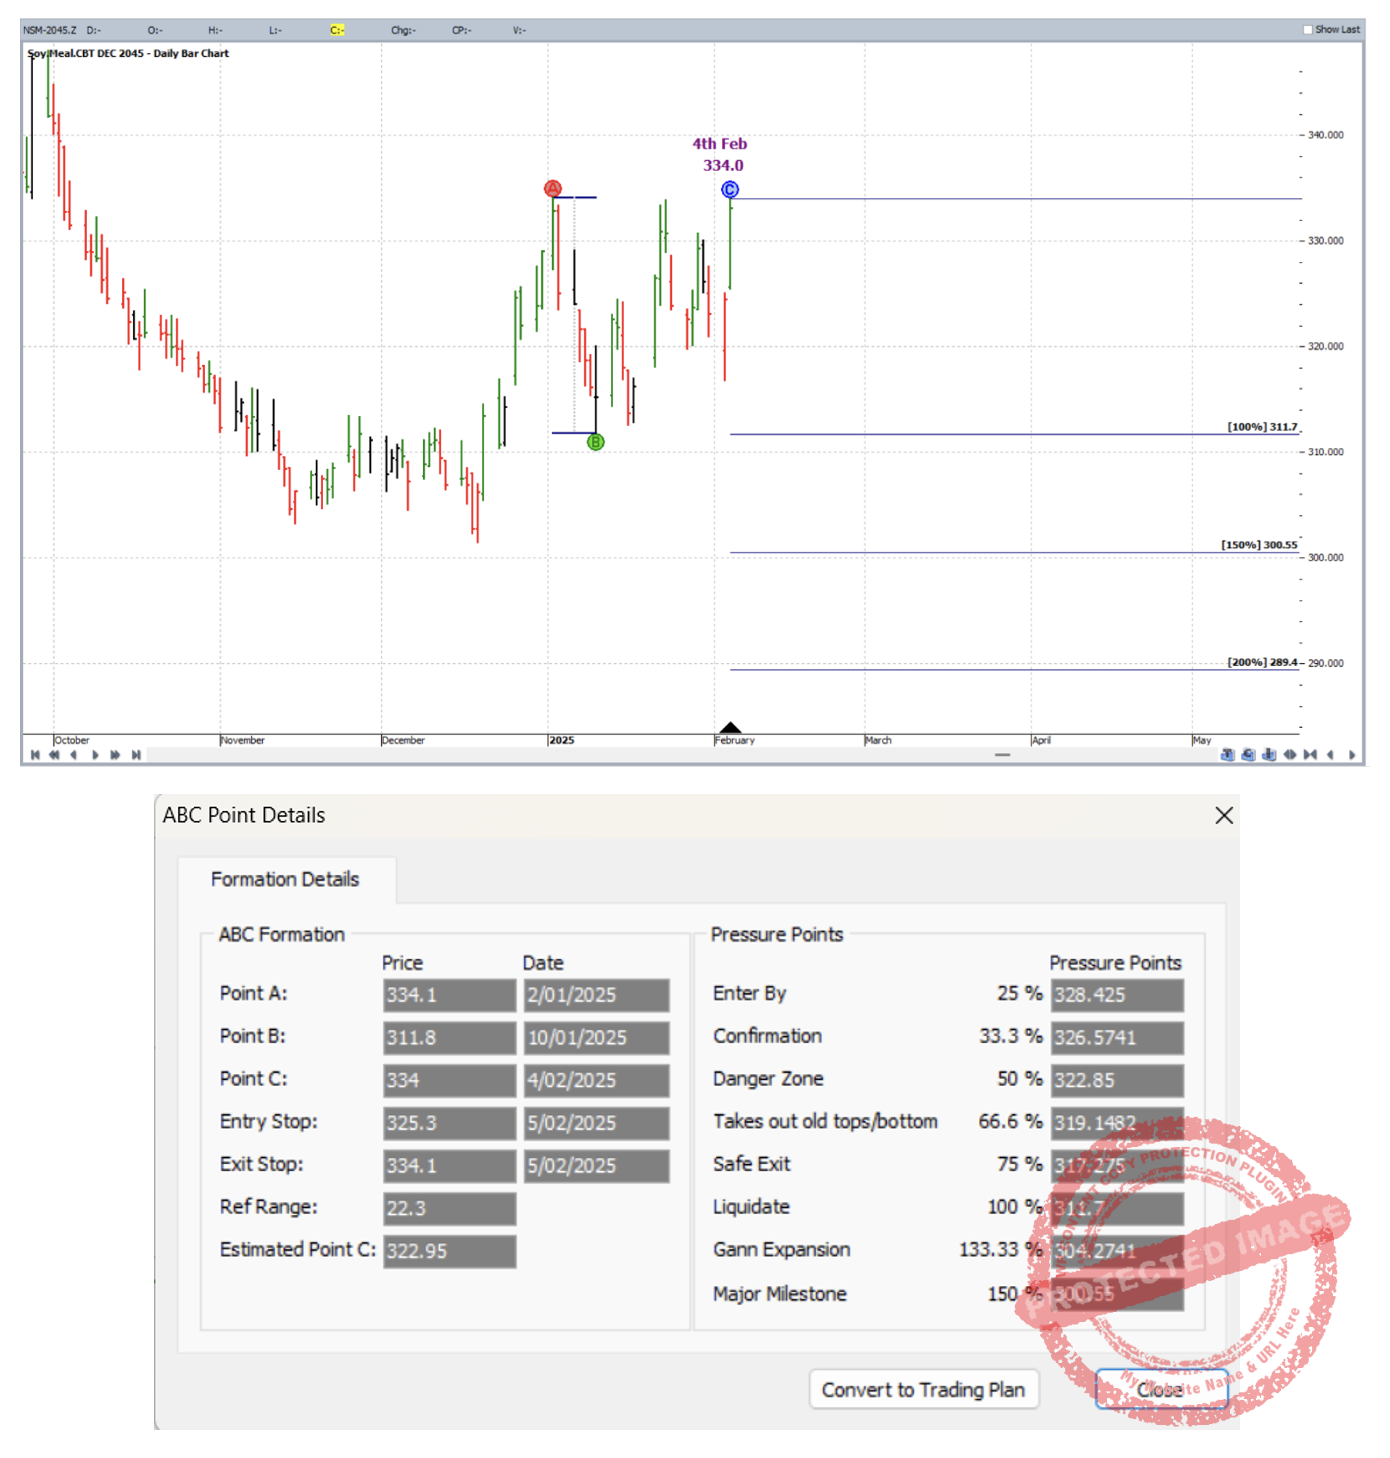
Moving and trailing stops every multiple of 25% in a market trading smaller ranges doesn’t leave much room for the market to breath on the way down. So in this case, it was planned only to move stops twice – once to break even when 100% was reached, and once to above 100% when 150% was reached, to lock in profit.
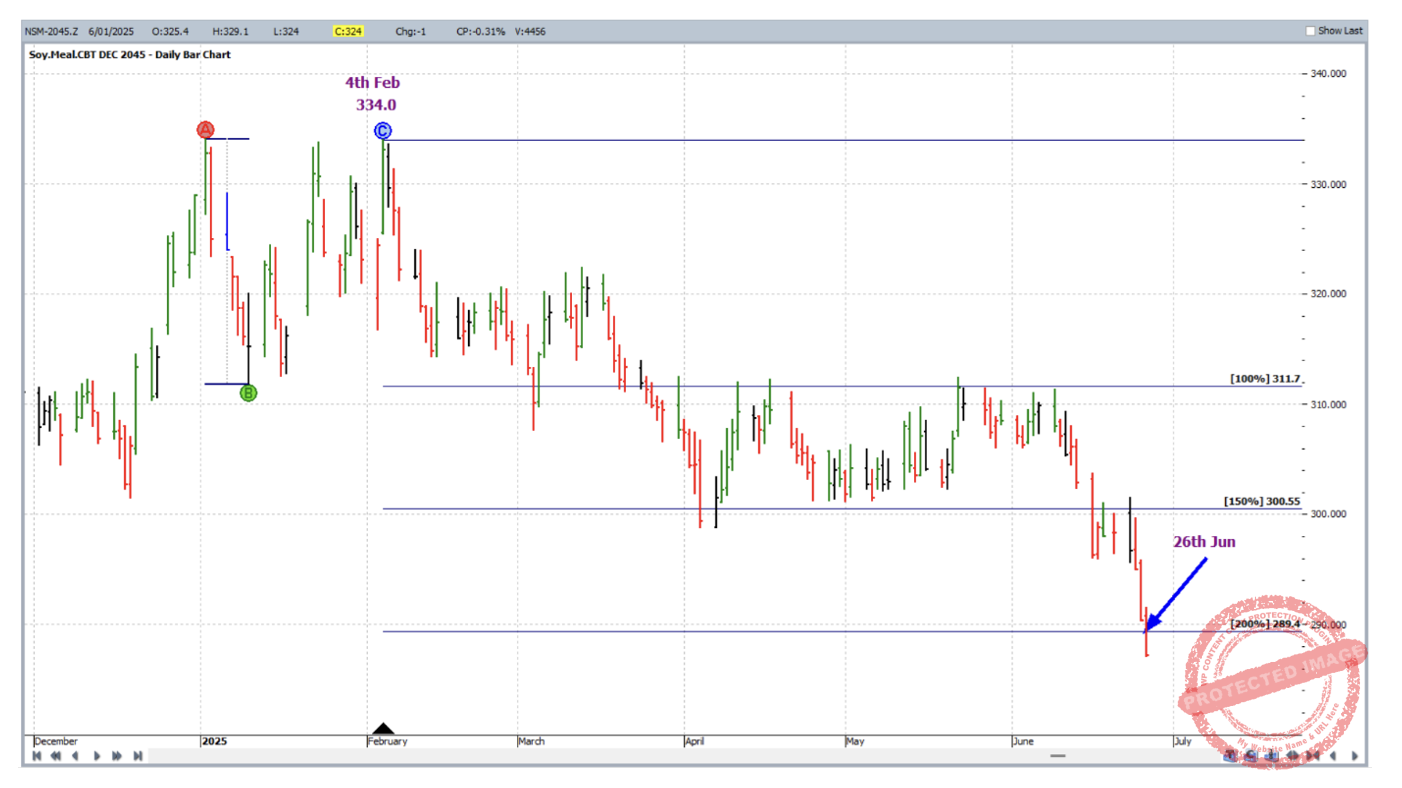
It was definitely a grind, and patience was required. But the market eventually got to 200% and the trade was exited on 26 June 2025 at 289.4.
To break down of the rewards, first of all in terms of the reward to risk ratio:
Initial Risk: 334.1 – 332.5 = 1.6 = 16 points (point size is 0.1)
Reward: 332.5 – 289.4 = 43.1 = 431 points
Reward to Risk Ratio: 431/16 = approximately 27 to 1
Each point of price movement changes the value of one Soybean Meal futures contract by $10USD. So in absolute USD terms the risk and reward for each trade of the contract was calculated as:
Risk = $10 x 16 = $160
Reward = $10 x 431 = $4,310
In AUD terms at the time of trade exit this reward was approximately equal to $6,500.
Since the entry parameters were spaced over a very small range at entry, let’s assume a smaller percentage risk i.e. 2% of the account size for this trade. With this the resulting percentage change to the account after taking profits would be:
27 x 2% = 54%
That’s more than a 50% increase to the financial asset (the trading account)! It took the better part of five months – slow for what is generally a short term game. But for any financial asset to increase by such a large percentage within a year is difficult to match.
On a final note, for those looking to engage time analysis to boost the probability of your trades, there was at least one simple such element here which increased the probability of this trade.
Work hard, work smart.
Andrew Baraniak