Come Fly With Me
A well know stock that comes in and out the news based on the latest safety concern is Boeing. We tend to hear so little about aviation stocks as flying from A to B in comfort, at speed has become the normal rather than an adventure. The ability to run an airline with ever cheaper fares, but higher aircraft costs is a balancing act. The saving grace is more people want to travel each year so in essence it becomes a commodity of mass movement…but I digress.
Having spent some time in the aviation space it’s still a passion I have around the whole art of flying. So why not attempt to profit along the way on stocks that resonate? This month I want to look at the current position of Boeing BA.NYSE. I would not expect many to be aware, but Boeing turns 110 in 2026 with its initial beginning back in July 1916. It did not list until January 2nd 1962. We can also throw in the dates in which the articles of incorporation were published, again in July this time, 1934, and we have a series of dates we can test and research for our trading purposes.
Chart 1 gives us some big picture building blocks with the GFC low to the pre-Covid high of 2019 delivering us a large range to watch. The 50% level has held and gave us a range down to watch in August this year. The current 50% level is $237.53 and should be watched into the future.
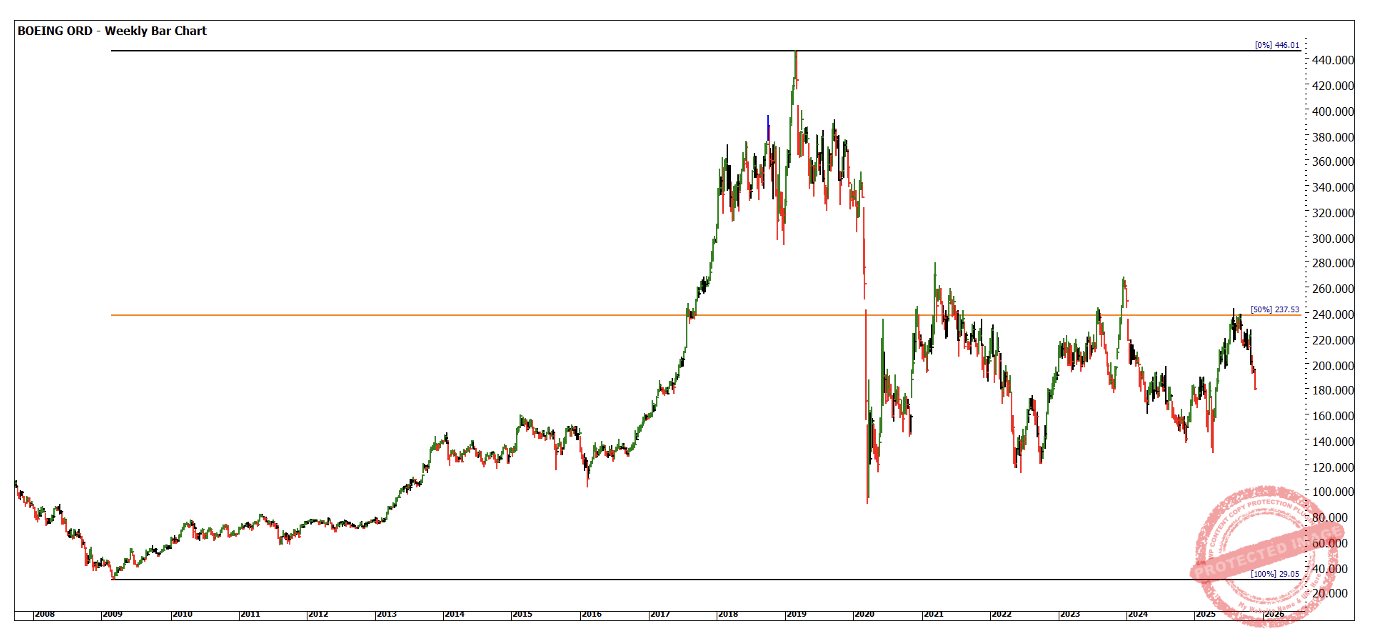
Chart 1 – Weekly Bar Chart BA
Chart 2 again aims to understand the big picture and using the 2008 low of $29.05 as a Low’s Resistance Card, we can see areas of support and resistance and marry highs and lows to weakness and strength in the relative squares of that low.
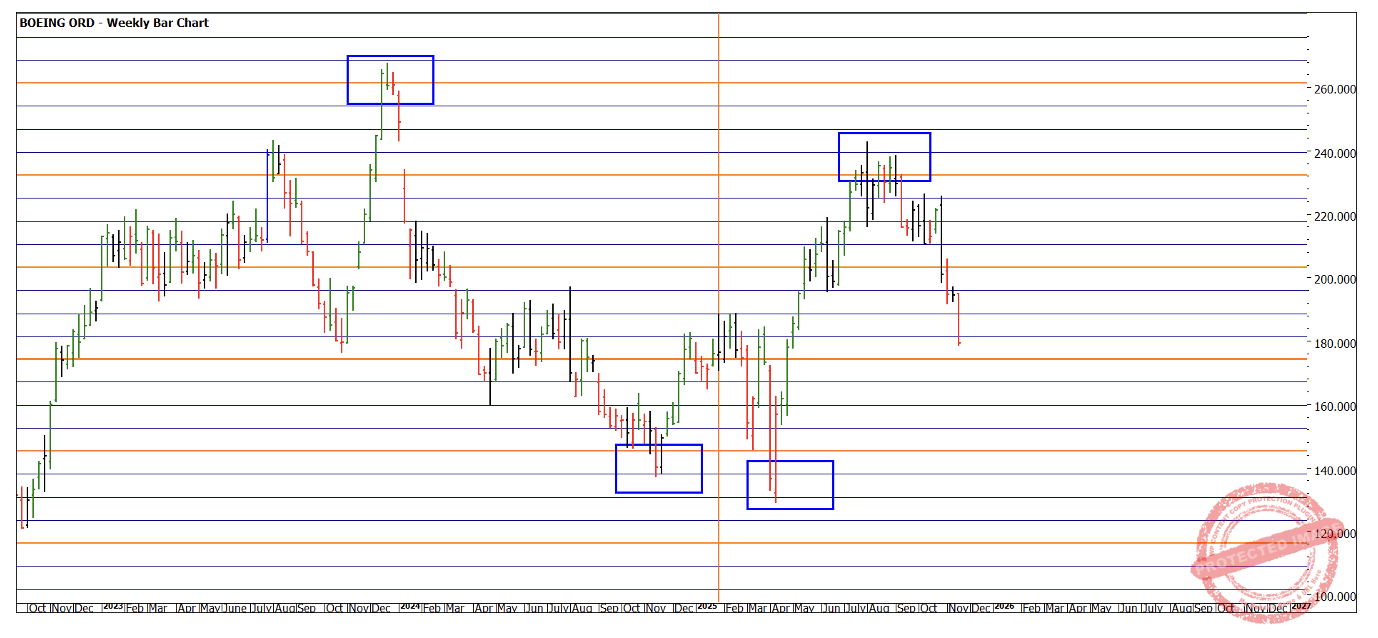
Chart 2 – Weekly Bar Chart BA
Chart 3 uses the balancing time technique to understand the current position in days; I find it interesting that we have 50% of the down range coming out at the end of November and the 100% completion into July next year. It seems that July is a seasonally active time for this stock.
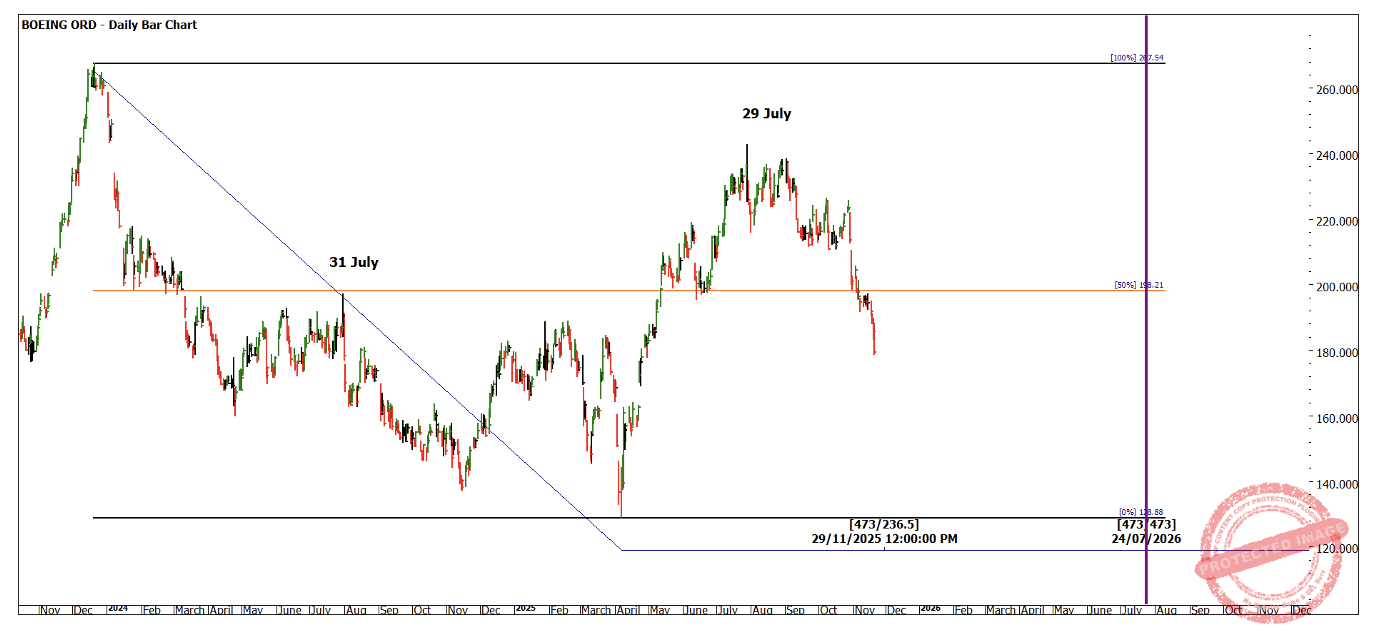
Chart 3 – Daily Bar Chart BA
Chart 4 brings me to the current patterns of interest, of an approximate 50% time and price alignment. The 113-day range has repeated into the current price action, however price has held at or around the 50%. We could see continued selling, however, if a reversal was to occur around this area, we may have some reasons to look to our swing charts for a higher bottom?
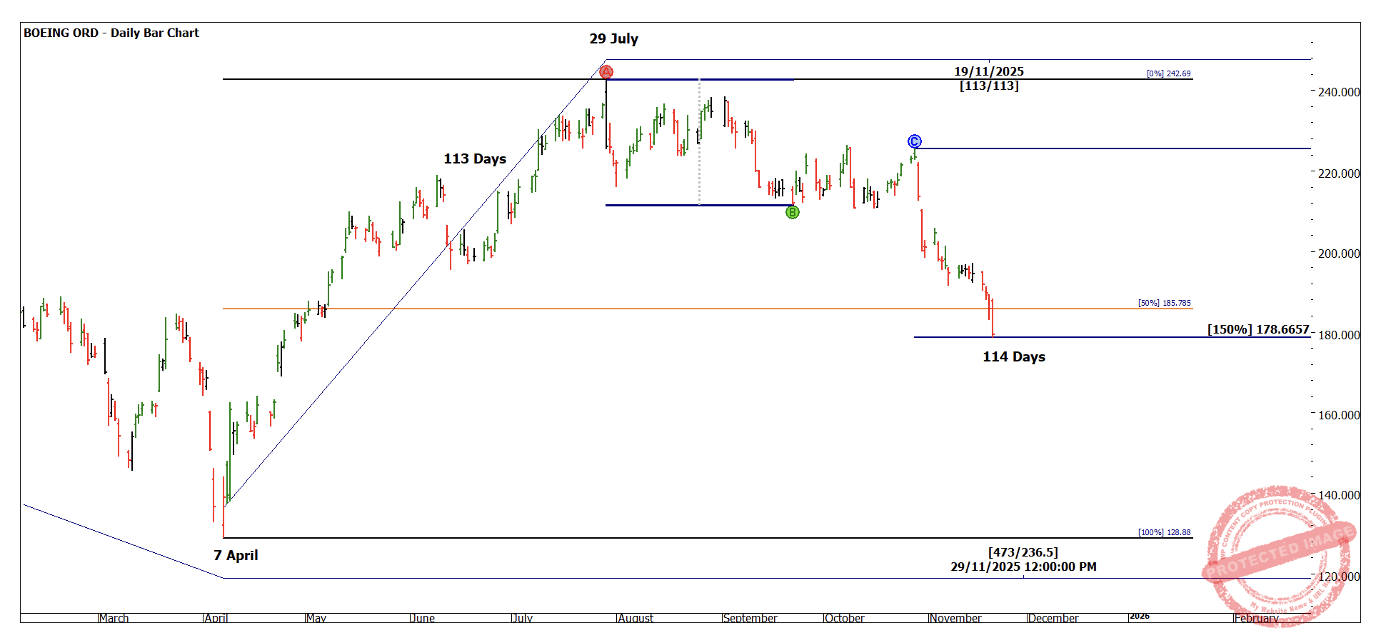
Chart 4 – Daily Bar Chart BA
You may notice that most of the tools I am using are based on 2nd dimension or time based. Once you have a framework there is much more we can layer to understand what we may see in the future.
The final cherry I leave you with is Gann’s 360 Degree master chart, essentially percentages of the circle. 180 weeks back from our current place in the market is the low from 2022.
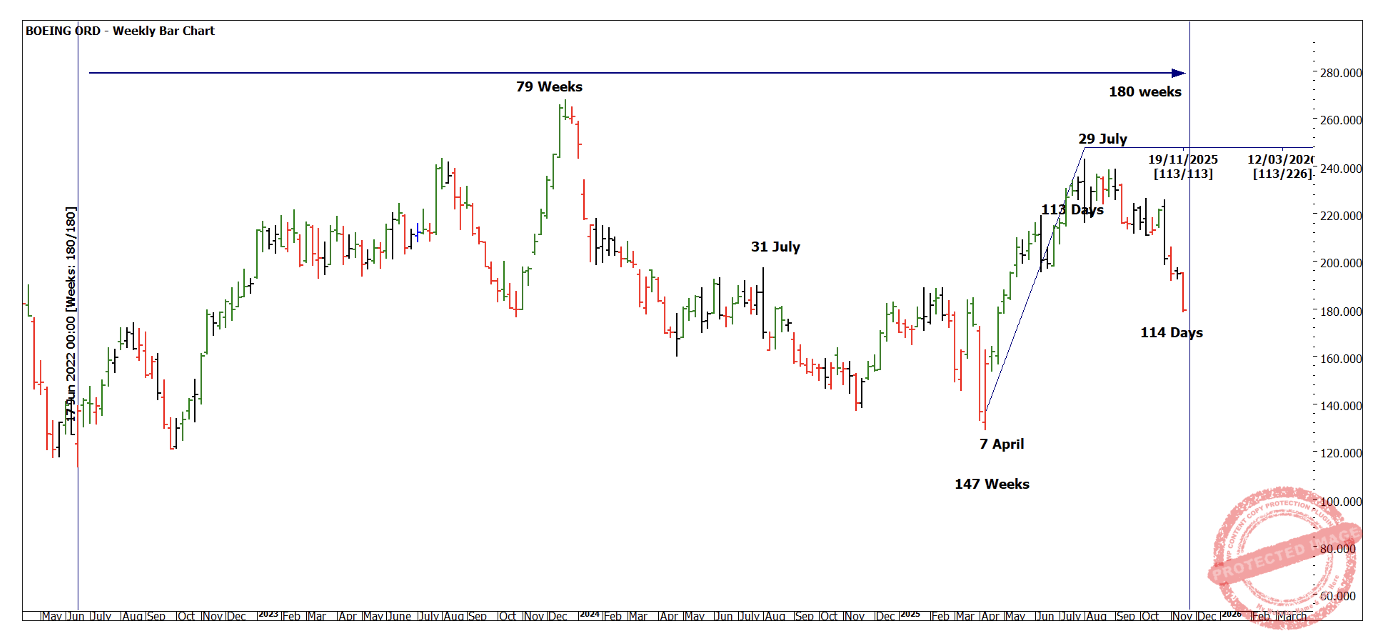
Chart 5 – Weekly Bar Chart BA
Now it’s your turn to see what else you can layer to assist your analysis.
Good Trading
Aaron Lynch