Christmas Rally
Well, it’s that time again and many are counting the days till we break for the year from our usual work routines. The great aspect of markets is they keep moving albeit on smaller volumes, especially in the Australian market. There is a well-studied phenomenon known as the Christmas Rally that when studied and understood can lead to strong opportunities on market like the SPI200.
If you are keen for a research project, you can go back over the last 42 years of the SPI200 and look at the months of December and January and look at whether they are positive, neutral or negative when it comes to returns. There are a number of options to research as well around where in January these rallies tend to stall. There are often a few key dates that appear as a good place to tighten stops or even close positions.
This gets me thinking of Gann’s lesson on Seasonal Changes in Stocks where he looks at the times of the year that can be useful to watch. It’s interesting he lists an area in January to watch but does not give any detail of why. That is a lesson that David pulls apart in the Ultimate Gann Course and leads many of his students down the road of Time by Degrees.
In Chart 1 we can see the SPI200 and its current position and an interesting pattern that is forming.
There is an area of support at 8400 that is supported by 2 lows. It also aligns with the 37.5% retracement level of the April – October Range.
The pattern of interest is the area marked in the rectangle. The best way to think about it is to imagine a gap up in price above the rectangle which would isolate all the bars in the rectangle and form what is called an Island reversal. These can be powerful signals of a reversal in markets.
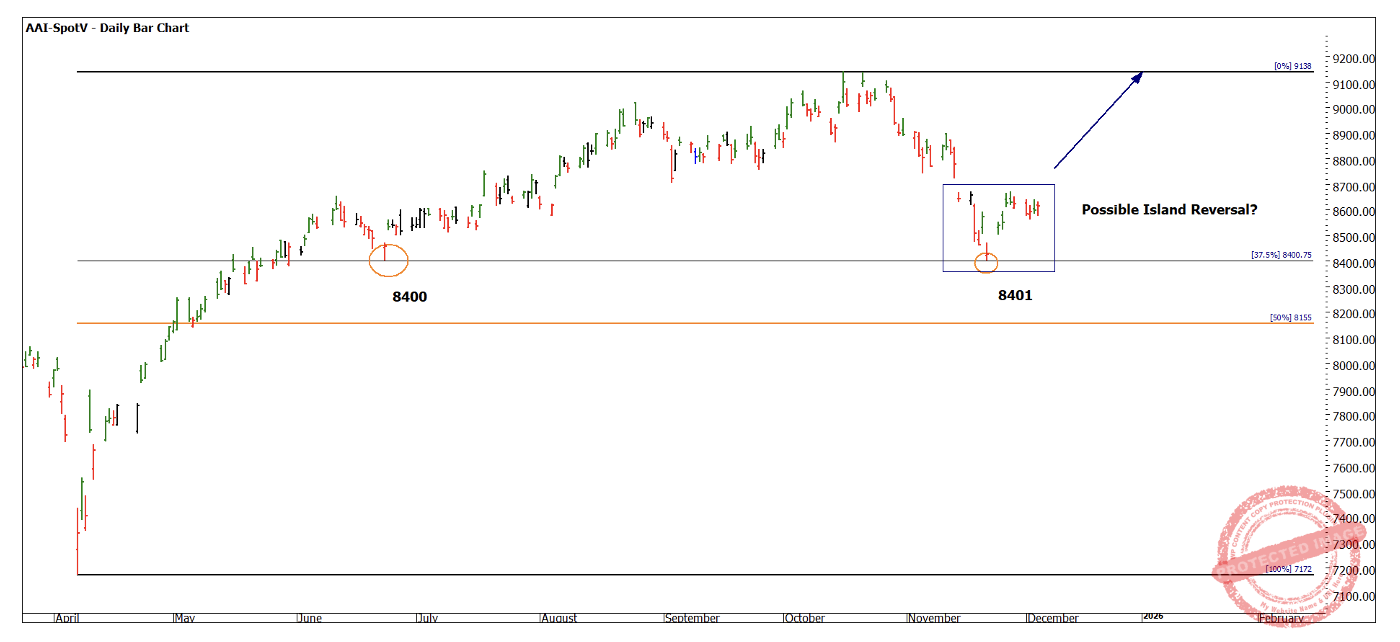
Chart 1 – Daily Bar Chart AAI-Spotv
This pattern takes me back to 2003, yes, I have been around that long. I recall we watched a similar scenario play out in March of that year and it was a strong signal that the bear market was over. These patterns exist on most markets and particularly ones that do not trade over a full day.
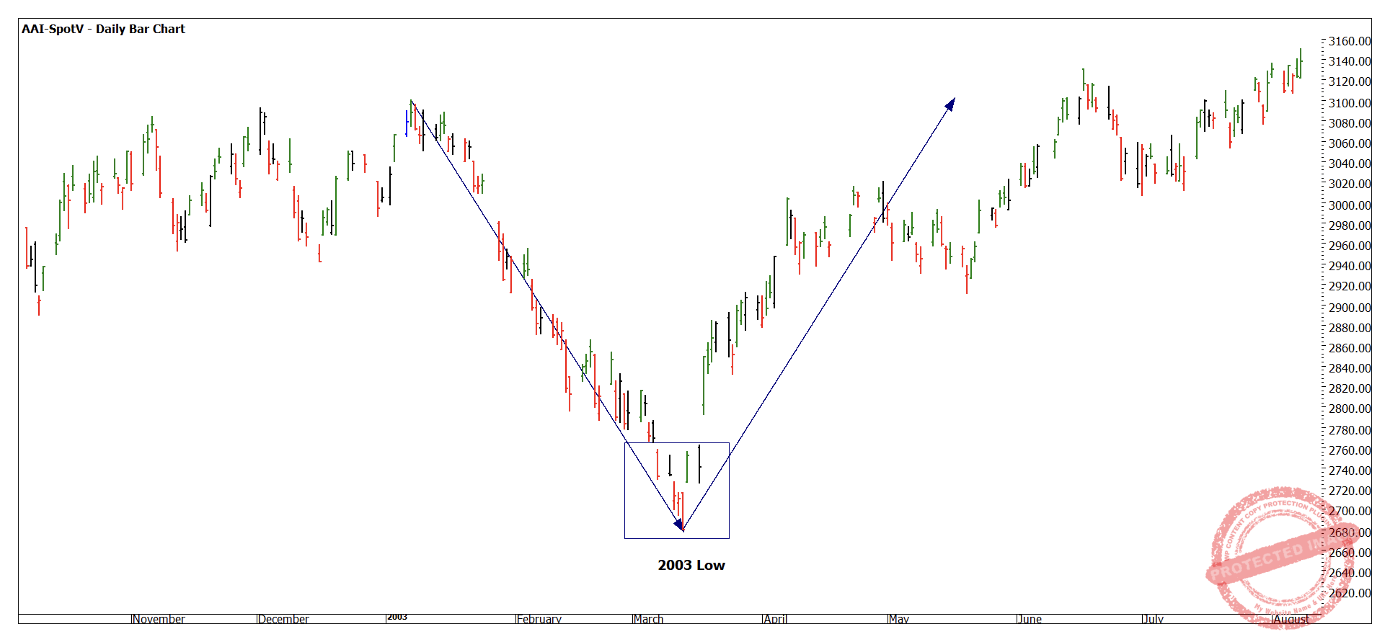
Chart 2 – Daily Bar Chart AAI-Spotv
Of course, we like to see there being price support and clusters at the approximate level of the island reversal. Chart 3 uses the GFC low of 3111 and when we multiply that we see that 275% of 3111 gives us 8555. This is a good approximation of where old tops formed and also where the support is currently formed. This technique is what called a Lows Resistance Card from your Number One Trading Plan.
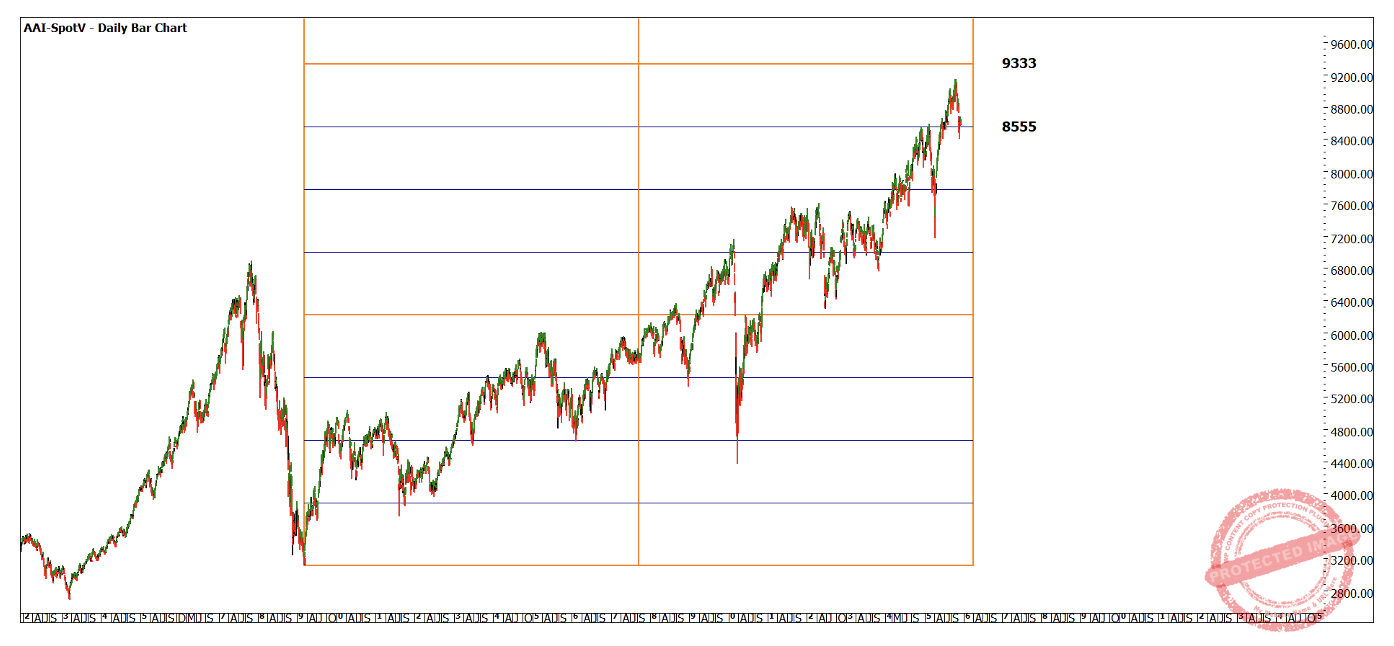
Chart 3 – Daily Bar Chart AAI-Spotv
Chart 4 zooms into the more current picture and we see how the 8555 level has guided the market previously. In turn the longer we hold support above this level then 3 times 3111 gives us 9333 a strong area to watch if we see continued upside.
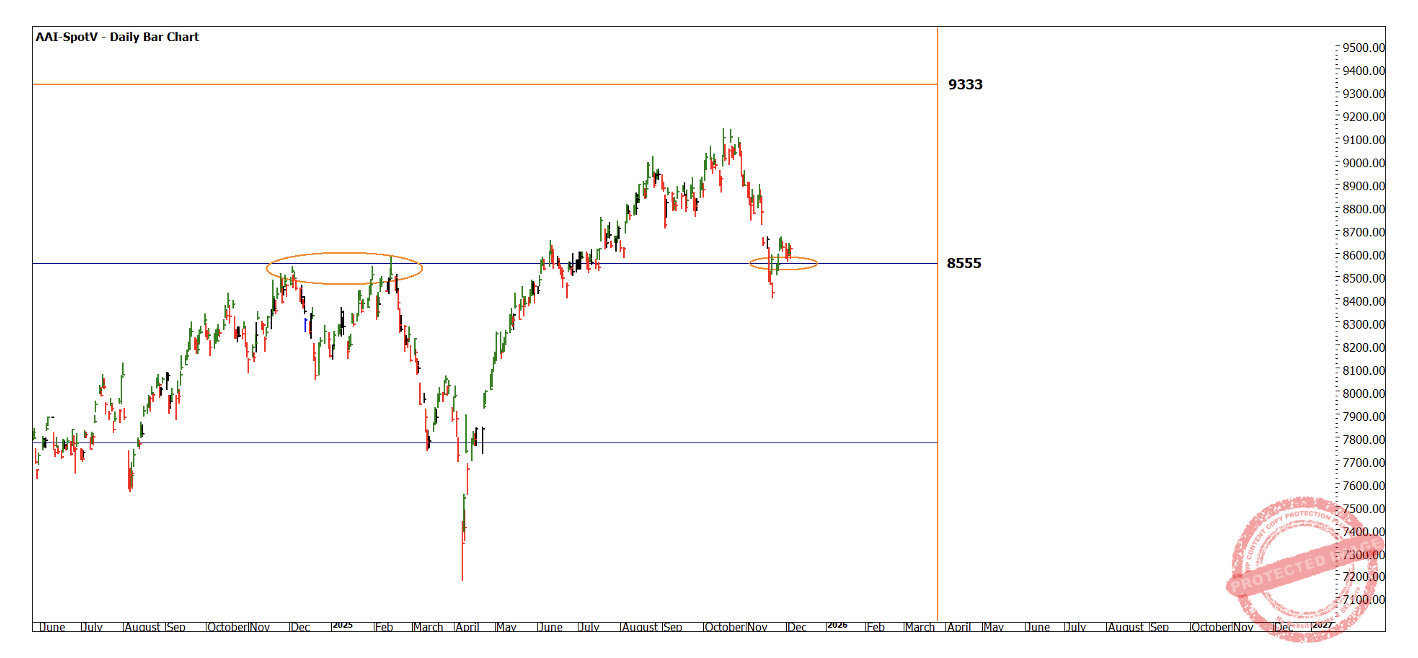
Chart 4 – Daily Bar Chart AAI-Spotv
If the price action breaks below and closes below 8555 then we can use this a sign of weakness.
I wish for you all a safe and relaxing Christmas and New Years period, set some ambitious goals for 2026 and I look forward to hearing of your trading successes.
Good Trading
Aaron Lynch