WBC Continued…
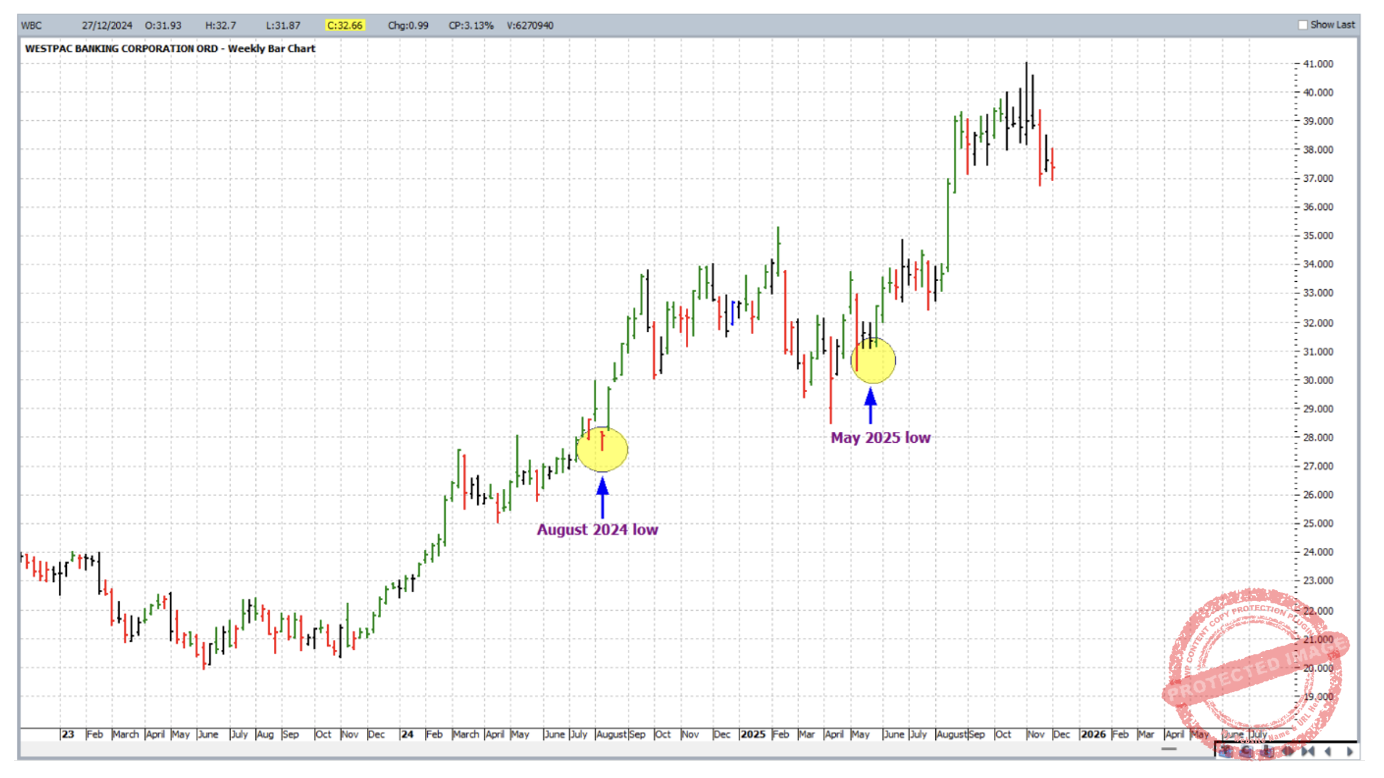
This is Part 2 in a mini-series of articles that focuses on trading turns in Aussie banking stock Westpac Banking Corporation, WBC:ASX. Our November 2025 newsletter covered Part 1, and you can catch up on it here if need be. To be brief, that article studied the trading of the August 2024 low. This is highlighted in the chart below.
WBC has been in a steady bull market for the last couple of years. So what other intermediate lows were we able to anticipate with our Safety in the Market price forecasting skills? Also highlighted below is the area of May 2025. Why and how could we have traded out of this low to take advantage of the bull market that has been underway?
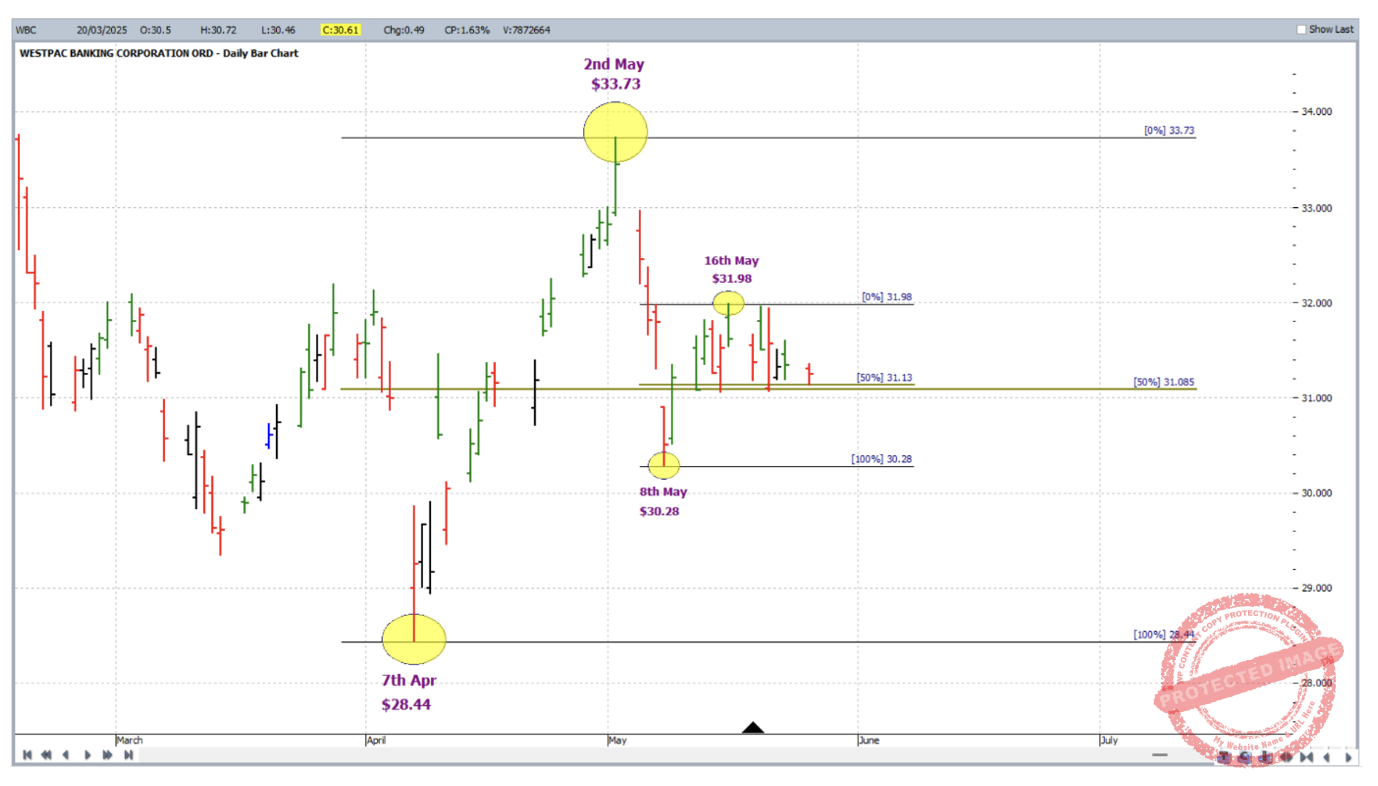
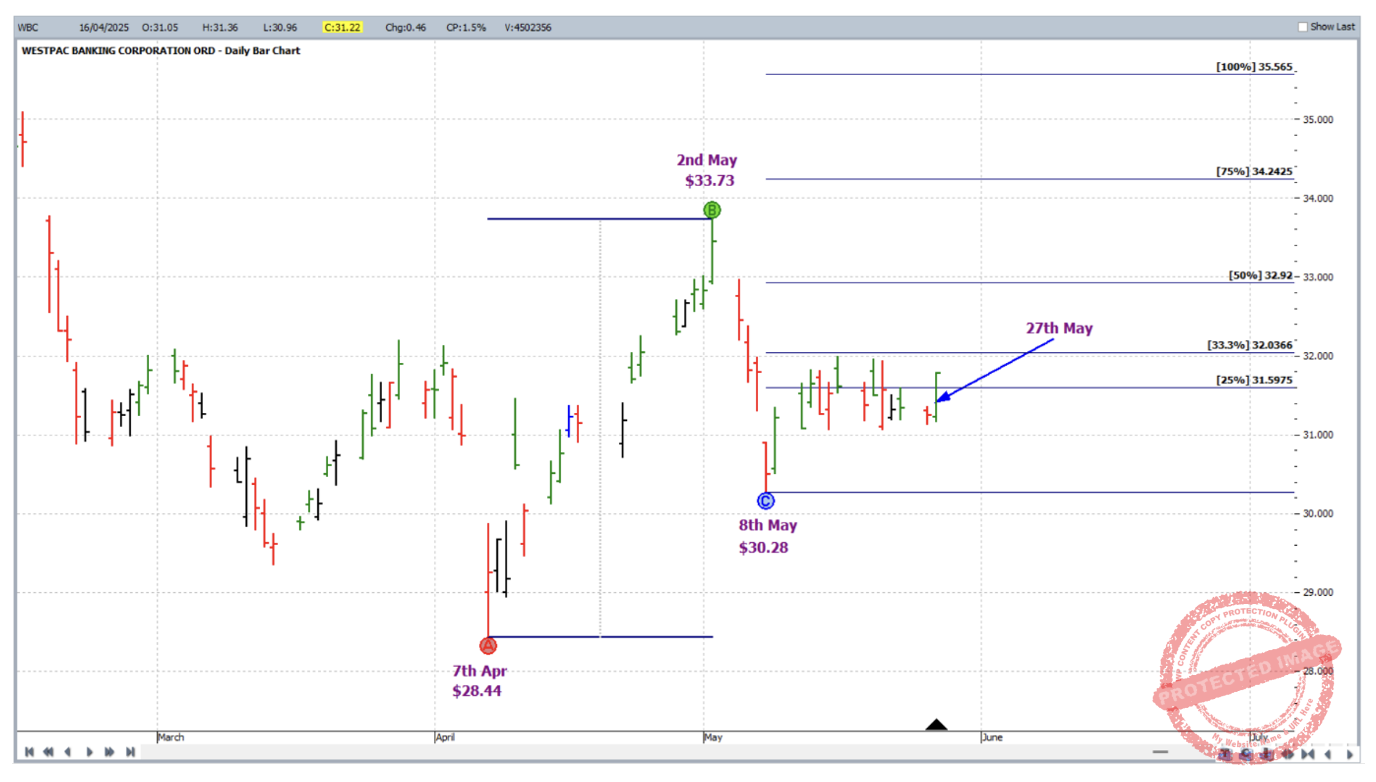
Let’s zoom into the market action of May 2025 and take a look at the main analysis factors that were present at the time. First of all there was a neat, strong price cluster from the application of two Ranges Resistance Cards and their all-important 50% resistance levels. The low from 7 April 2025 ($28.44) to the high of 2 May 2025 gave $31.09. The low from 8 May 2025 ($30.28) to the high of 16 May 2025 ($31.98) gave $31.13; see below.
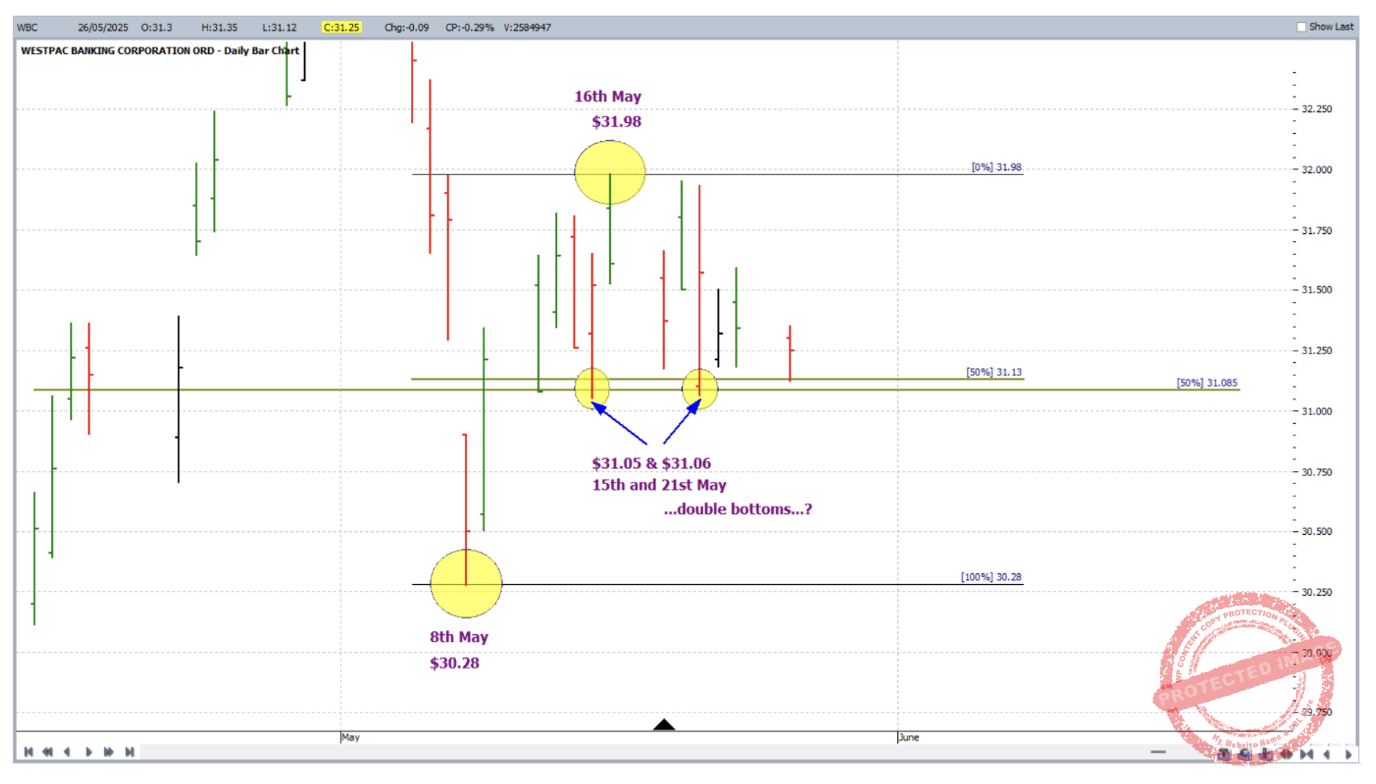
Zooming in further we see that a small double bottom formation was also present.
After the second of the two double bottoms, the market was not in a particular hurry to get going. So what if any was the entry signal? Applying the daily swing chart overlay and the Swing Bottoms and Swing Tops hi-lites tool, we see that a first higher swing bottom entry was triggered on 27 May 2025, with an expanding upswing (66c compared to 53c) and contracting downswing (47c compared to 89c) both confirmed during and after the entry process.
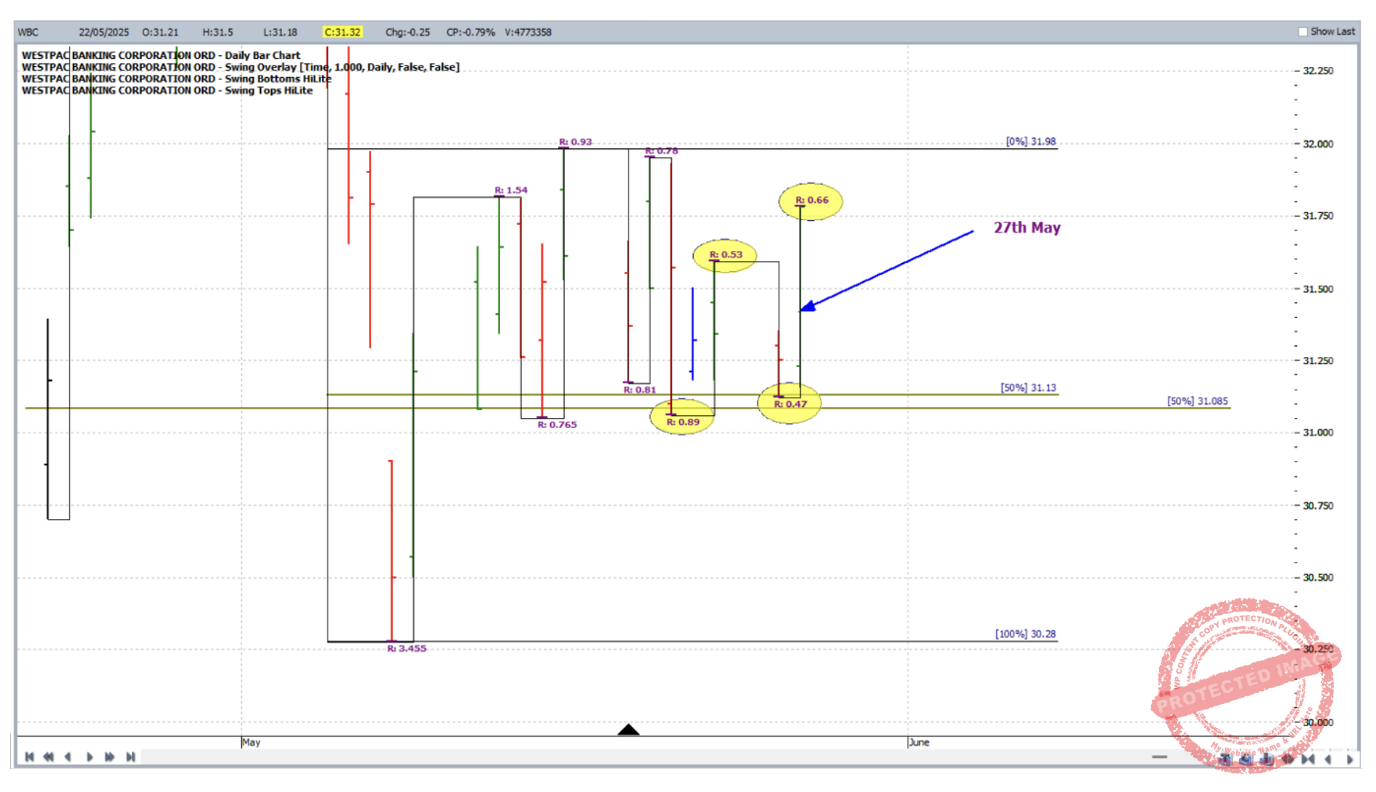
This entry would have had you long WBC at $31.36, with initial exit stop at $31.11; entry parameters conveniently spaced over the range of the small sized daily bar of 26 May 2025 – making easier the end goal of a high reward to risk ratio trade.
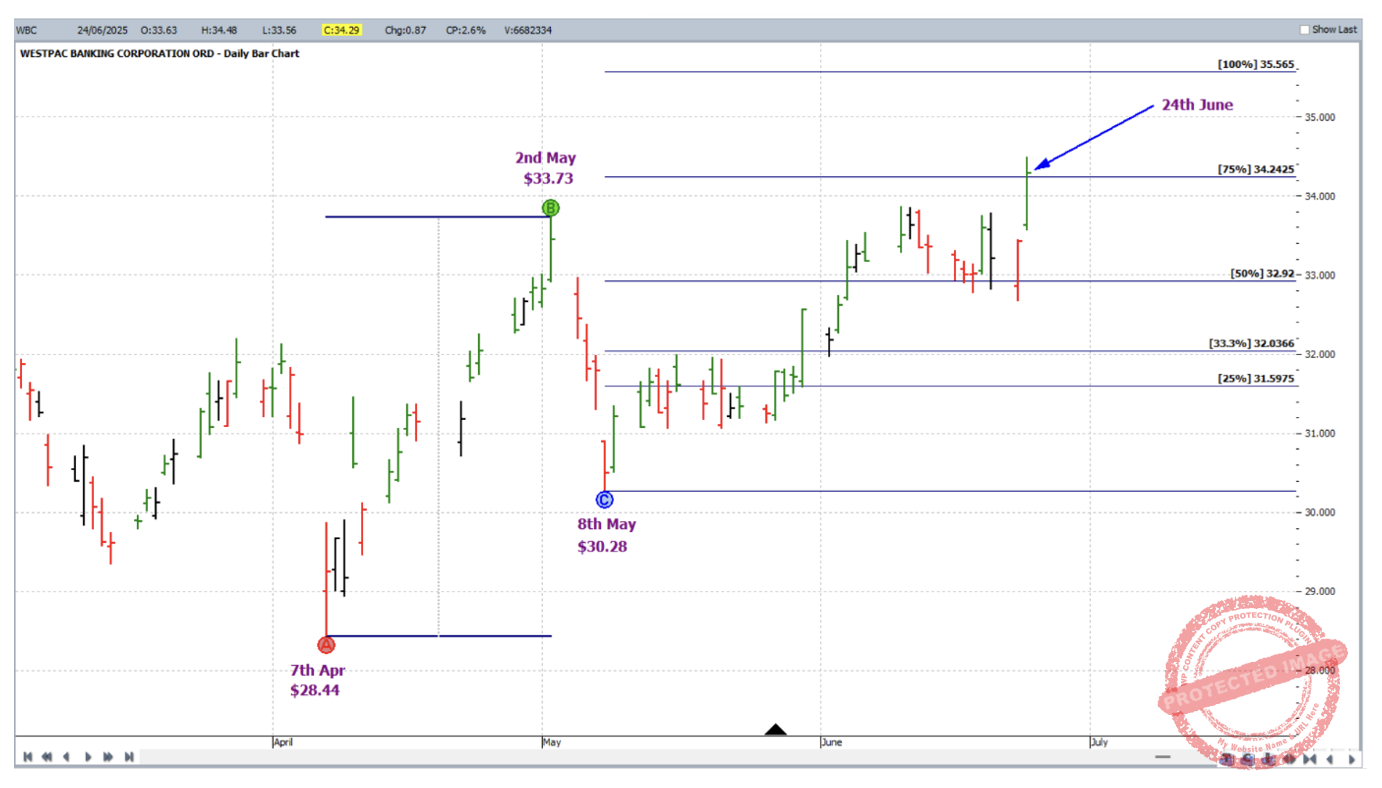
As for trade management, the AB reference range chosen was that from the April low to the May high, with Point C being the May low and 75% the exit target. In other words the trade from this point to be managed Stock style.
On 4 June 2025 the market reached the 50% milestone and exit stops were moved to break even.

And on 24 June 2025 the market reached the 75% milestone and the trade was closed at $34.24.
Now for the usual breakdown of the rewards. In terms of the reward to risk ratio:
Initial Risk: 31.36 – 31.11 = $0.25 = 25 points (point size is 0.01)
Reward: 34.24 – 31.36 = 2.88 = 288 points
Reward to Risk Ratio = 288/25 = approximately 11.5 to 1
If 5% of the account size was risked at entry, the gain in account size would be as follows:
11.5 x 5% = 57.5%
If 5% of a $10,000 account was risked, i.e. $500, the reward would be:
11.5 x $500 = $5,750
Work hard, work smart.
Andrew Baraniak