Getting into the Swing of Things
To cover of from my last article from 2025, the Christmas rally has again produced some solid gains albeit a little muted in places outside North America. My speculation of a possible island reversal pattern here locally on the SPI200 did not materialise but the process of planning possible outcomes in advance can prepare the subconscious mind for a variety of outcomes.
The role of swing charts is such a foundational lesson from David and Gann; however, I feel I certainly don’t highlight their value on a regular basis. As they are not the most seductive technical tool we can access, I regularly fail to highlight how much I rely on them. This brings me to the basis of this article.
In 2025 I penned an article for the more advanced traders using time-based techniques on the stock Boeing BA.NYSE. It was published on the 21st of November and framed what we can now see is a large picture ABC point. Chart 1 shows the current position; the price action formed a low and has pushed out strongly.
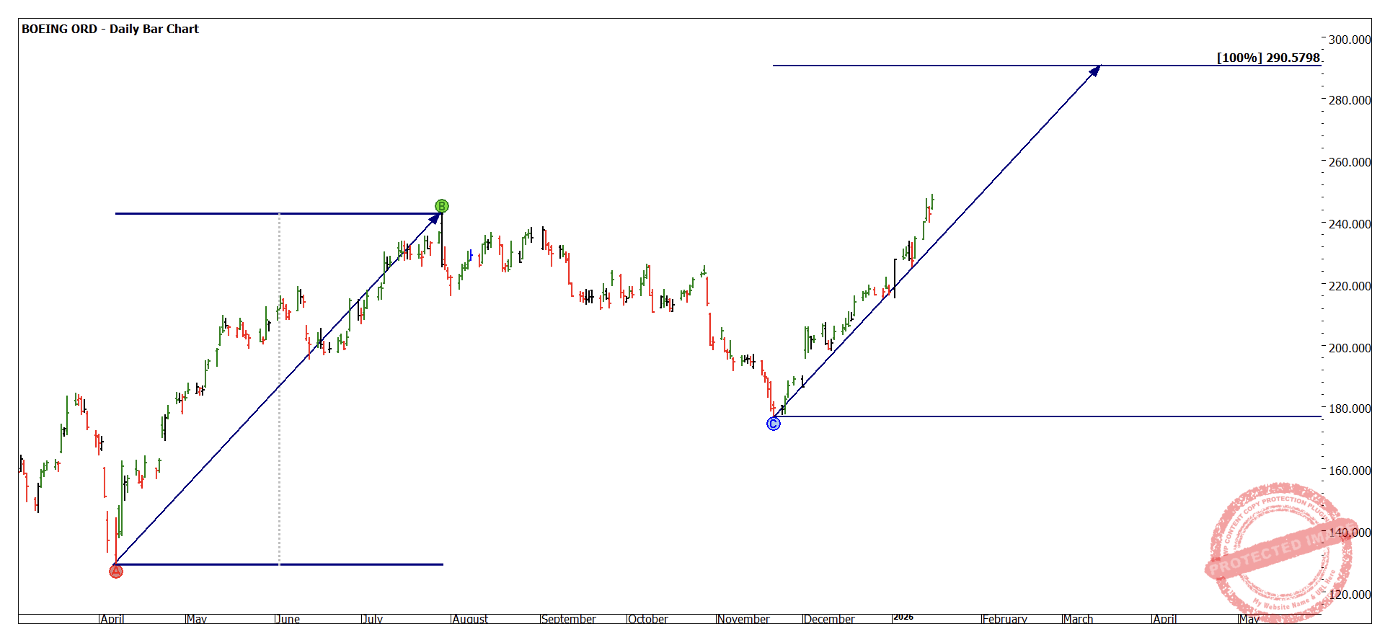
Chart 1 – Daily Bar Chart BA.NYSE
If we move over to our swing chart, we can see a textbook example of a swing chart that is orderly and making a series of higher tops and bottoms. The focus on ranges as well as the pullbacks helps us not only with assessing the strength of the market but adds the lesson of stop loss placement and management.
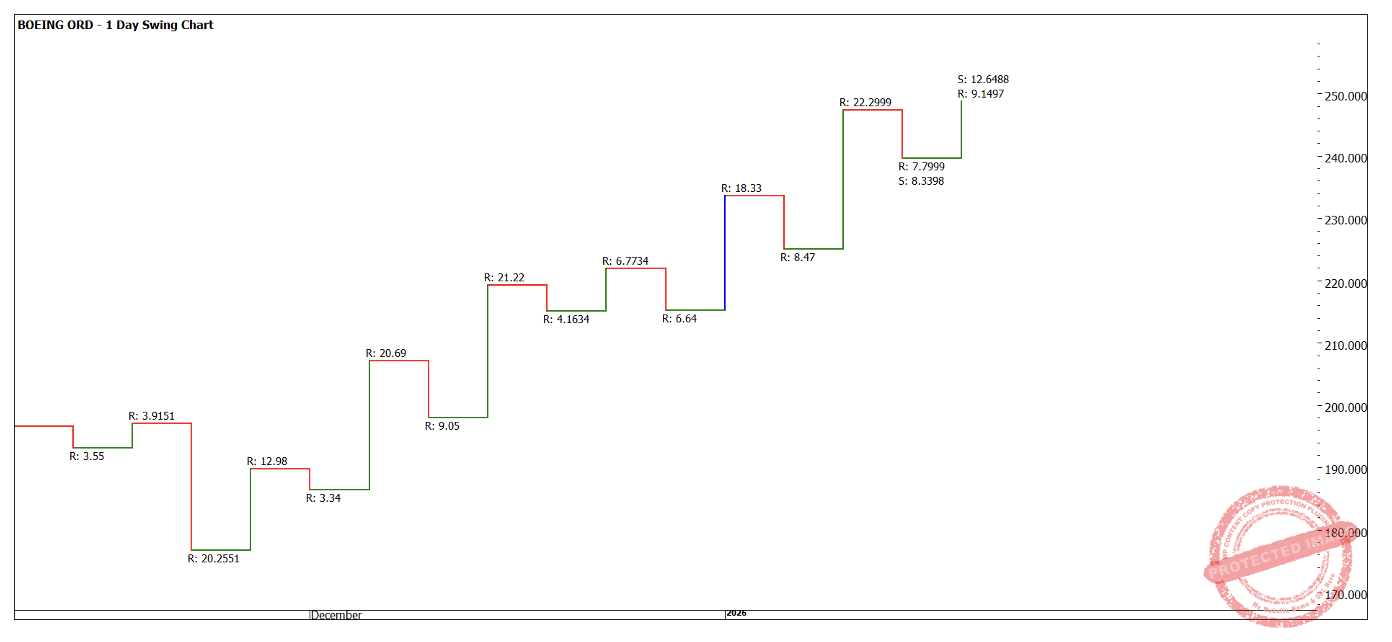
Chart 2 – Daily Bar Chart BA.NYSE
An entry using a first higher swing bottom in November has been an effective entry and trailing stops behind swing bottoms, in this case a 1-day swing chart, has allowed us to participate and remain in the move.
There would also be a case of entering on the 1-day chart but managing stops behind a 2-day chart as shown in Chart 3.
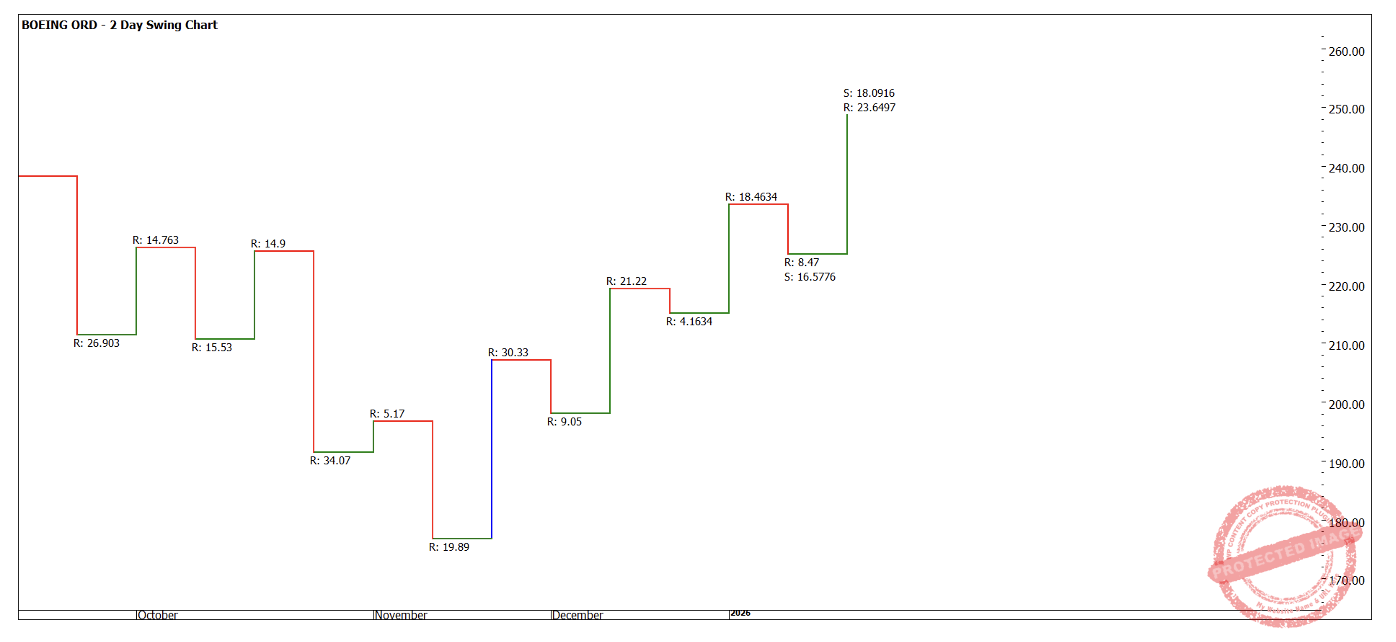
Chart 3 – Daily Bar Chart BA.NYSE
For clarity this setup has all the foundations of an ABC trade, on a bigger scale. However, the reasons for the focus in mid-November all stemmed from the concept know as a Classic Gann Setup , where a number of techniques combined to offer a high probability turning point.
If you refer to Chart 1 the complete repeat of the A to B range would take us to approximately $290. The pitch of the previous bull range and the current are also similar as marked with the trend line so now that is a possibility.
Chart 4 asks us to look at the “what if” scenario of a continued bullish move. I have used a Ranges Resistance Card to highlight the 50% point of the 2019 /2020 range. On two previous occasions the price action has failed to close above. We should be overlaying the big picture on top of the small to offer a possible price target.
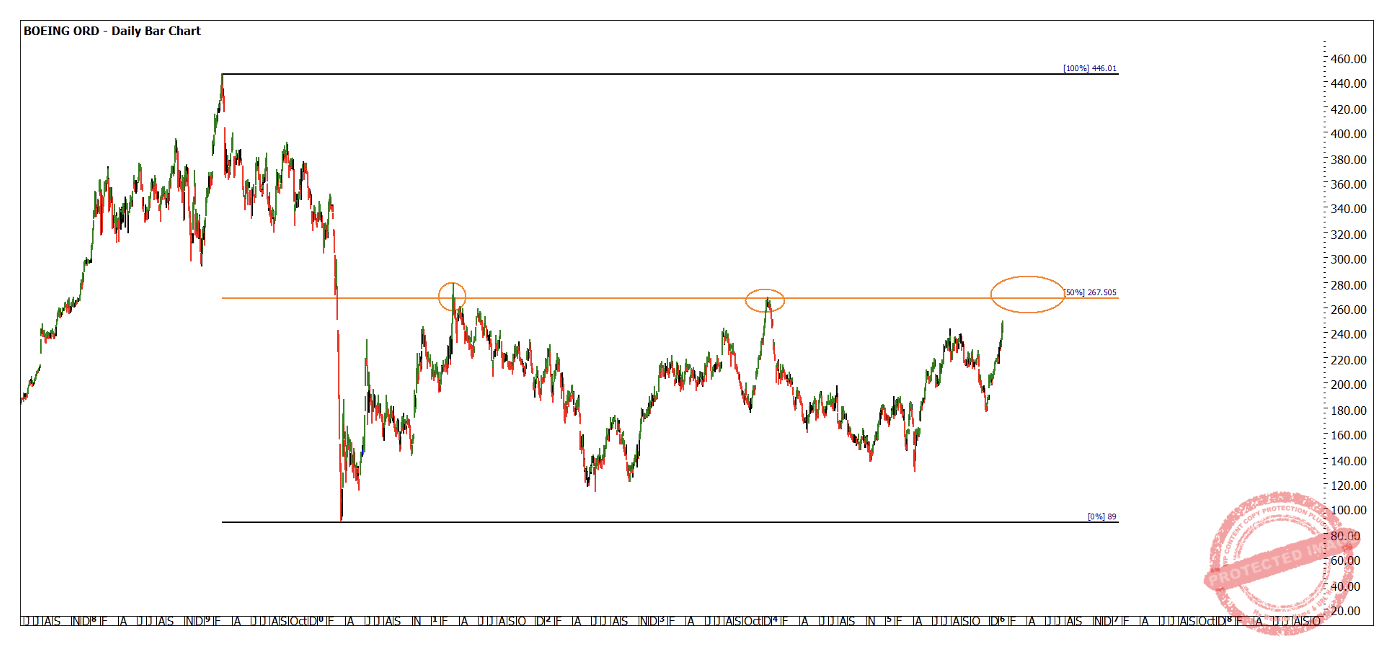
Chart 4 – Daily Bar Chart BA.NYSE
If the price action can break above $267 then blue sky may be in Boeing’s future . A failure at this level could again see the opportunities on the short side.
I suggest this could be a good market to study in 2026, planning ahead and developing a set of tools to apply to this market could pay dividends.
Good Trading
Aaron Lynch