Sense of Direction
A recent discussion with a fellow student highlighted what I think is an important point about trade analysis. Do you look for setups first then do your analysis or do your analysis first to gain a sense of direction, then look for setups?
I had a habit of seeing a setup then bending my analysis to suit the setup, I had bias! Whereas if I follow the swing charts, wait for an entry setup with low risk and move my stop to breakeven quickly, I may take fewer trades, but I also take fewer losing trades. I may not always be correct but at least I stack the odds in my favour.
I finished up last year’s Platinum article stalking a setup on the SPI200. We had just seen a big Overbalance in Price on the weekly swing chart which has the potential to be an A-B range. Then I was on the lookout for a weekly Point C – Classic Gann Setup to form.
My target area was a 50% retracement on a Seasonal date/Time by Degrees date with balancing time. I had my scenarios listed as how I would like to see the market unfold as we approached this time and price cluster. Chart 1 below shows my time and price window from December’s article.
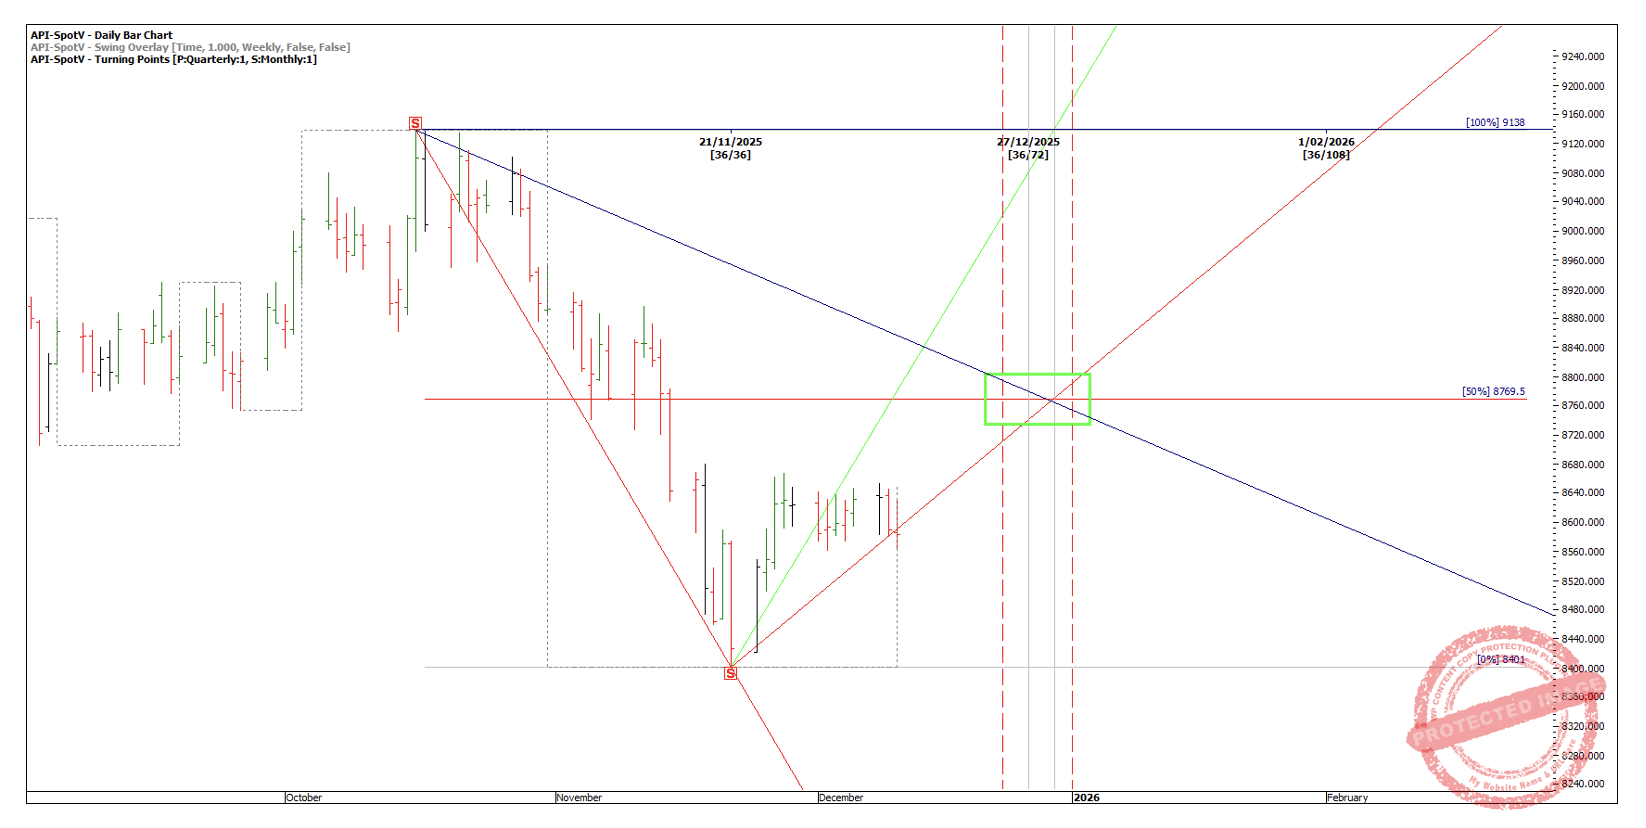
Chart 1
However, as the market hit this window, the daily swing chart didn’t show Classic Gann signs of completion! The daily swing chart had a big expanding swing up of 269 points that had overbalanced the previous range up of 169 points.
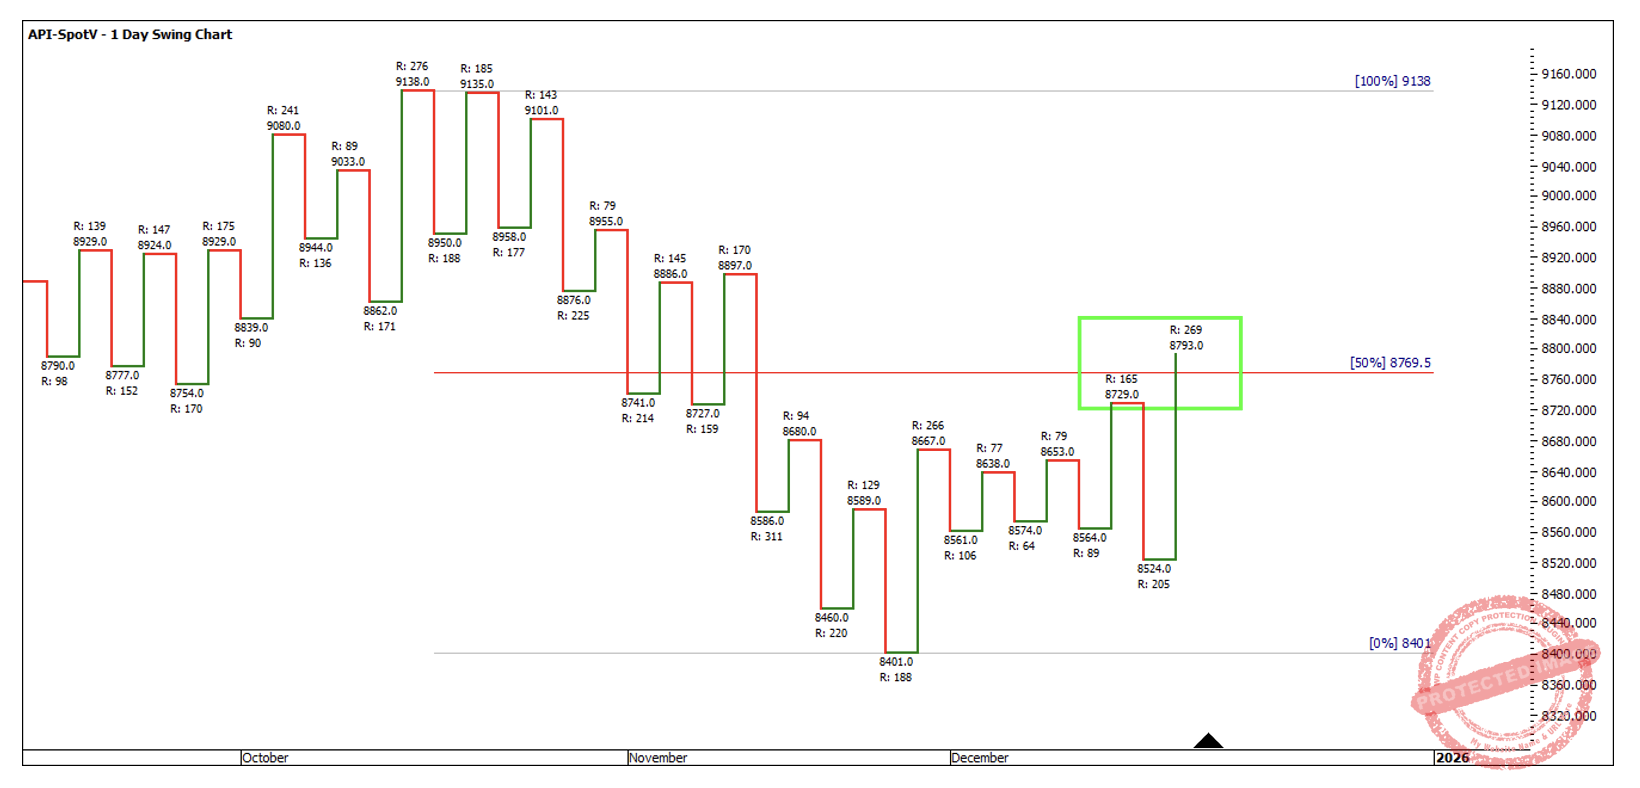
Chart 2
The above swing chart pattern is not typically what I want to see leading into a turn! Taking form reading a little further, this weekly swing was all one daily swing, and the market was trading well above the 2×1 Gann angle from the current weekly swing low which to me are two signs of strength, so this was a NO trade for me.
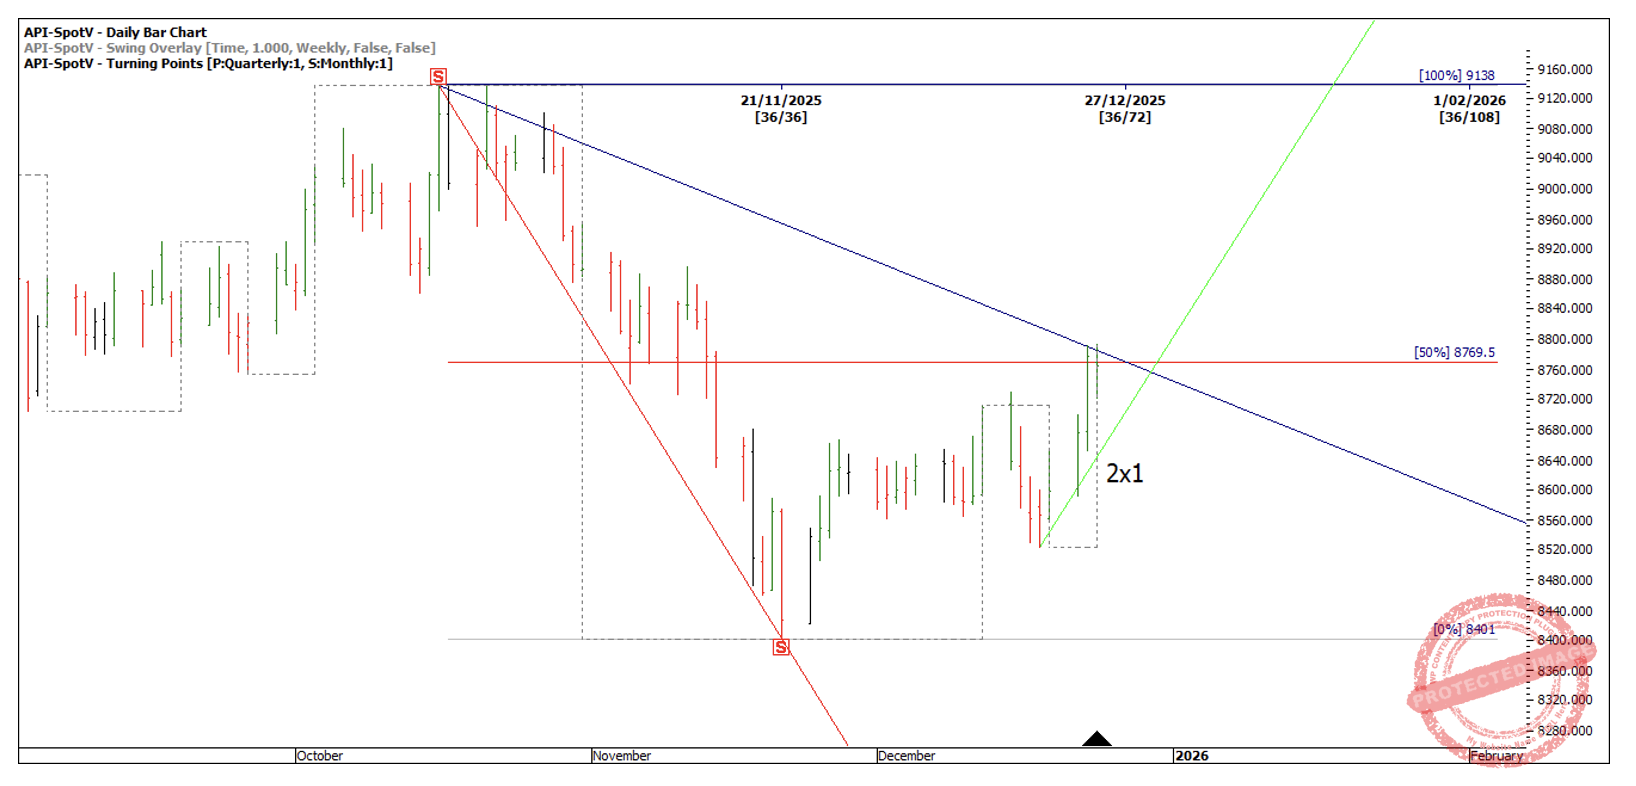
Chart 3
Compare Chart 2, our daily swing chart to last year’s top in February, the last weekly swing up was comprised of three daily swings, finishing in an almost perfect repeating range to within 2 points. This is the kind of pattern I like to see!
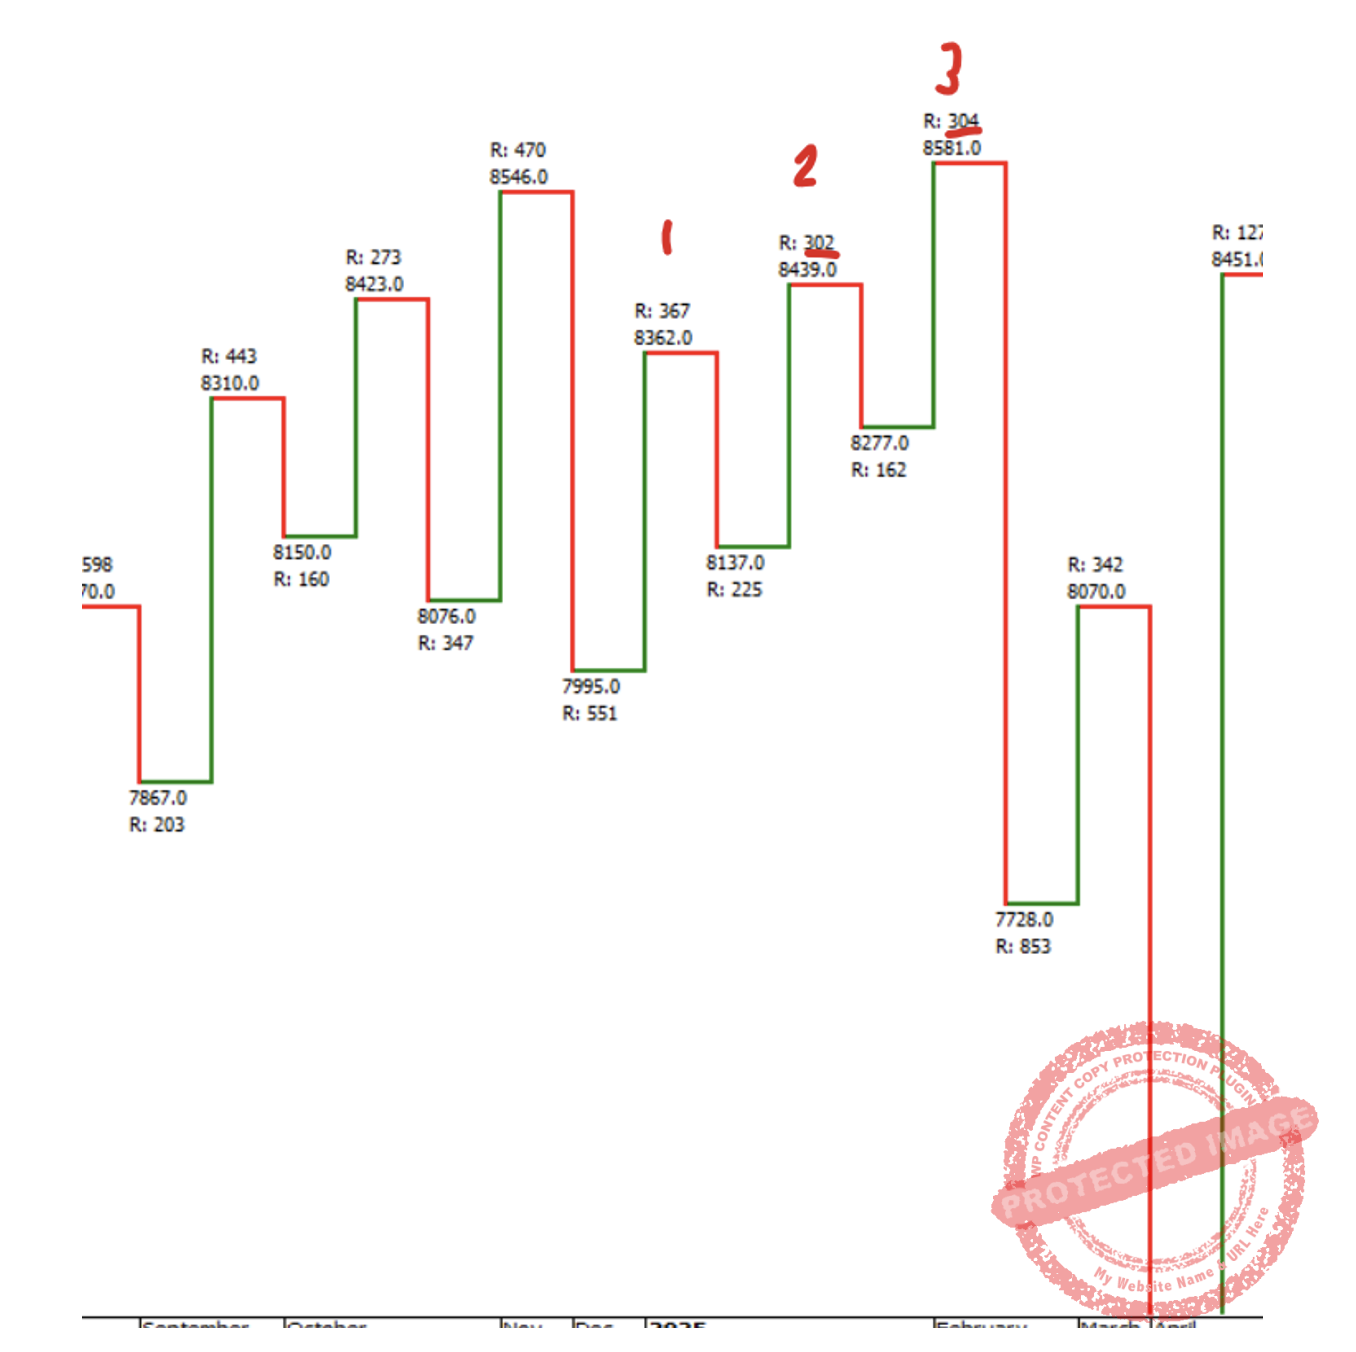
Chart 4
Fast forward a few days and the market gave us the potential for a lower top on 5 January under the 50% resistance level. Even though the daily swing chart hasn’t turned down, it’s now showing a contracting swing up under the time and price pressure which I read as a sign of weakness.
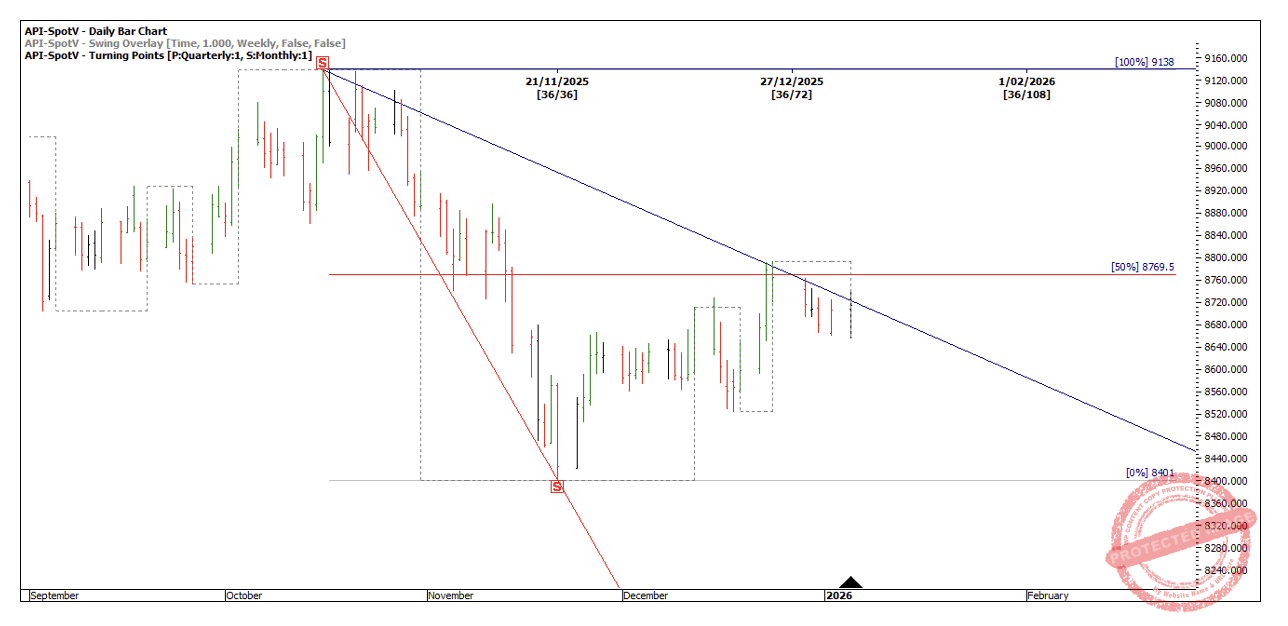
Chart 5
Now I need to see a setup on an intraday chart like the 1 hour or 4-hour bar chart to get a small risk entry and a better Reward to Risk Ratio, but also so I can move my stop loss to breakeven as fast as possible with this trade being a little more subjective.
Looking at the current March contract month, the 4-hour bar chart showed:
- Two sections up
- A 62.5% retracement
- Double top
- Speed angle resistance
- Contracting range up of 69 points compared with 83 points.
As the market breaks back under the speed angle, then the previous top, then the low of the previous 4-hour bar and then finally the 62.5% retracement, this is enough to satisfy my entry plan and enter at 8738 with 19 points of risk.
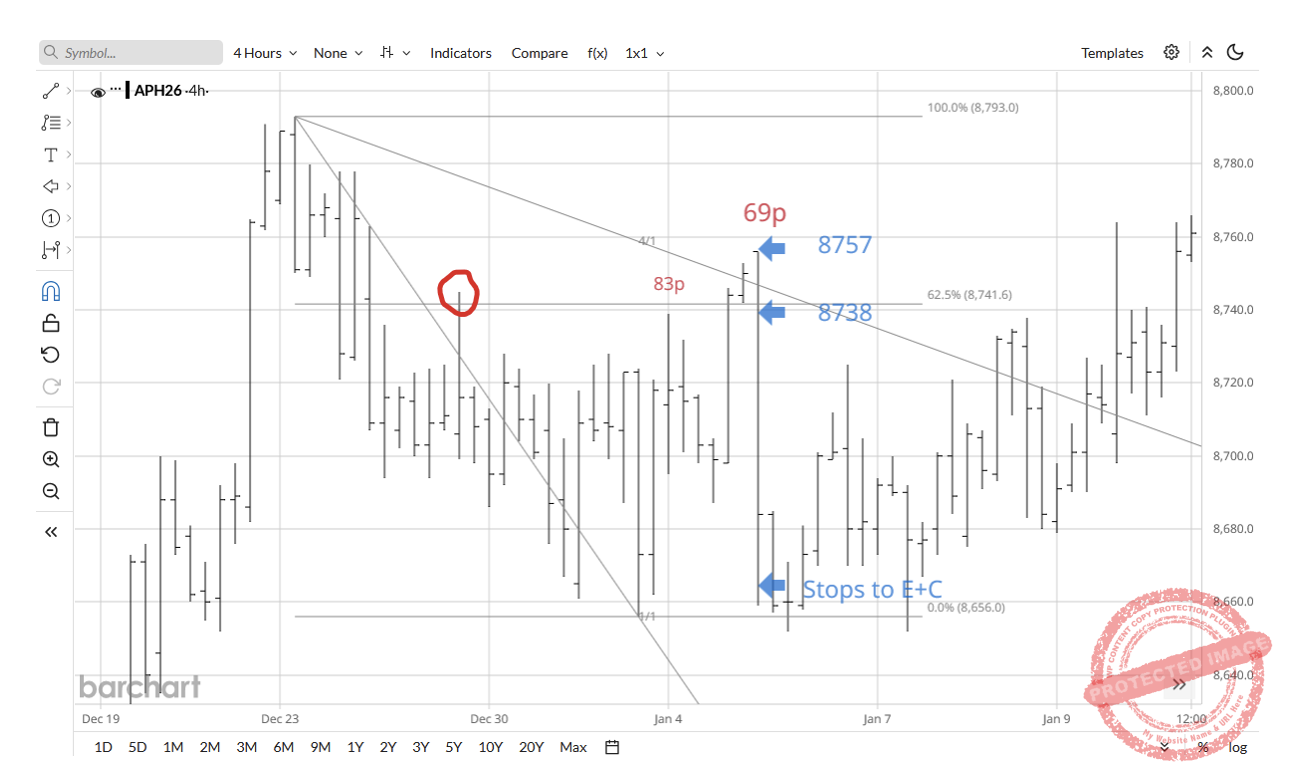
Chart 6
The market moved off quickly and I could move stops to entry plus commission within a couple of hours! If this was going to be a decent top, then the market shouldn’t get back to entry levels. At this point I was feeling good.
To my disgust the market stopped me out for a breakeven. So, all that for a break even! That’s trading unfortunately and in actual fact it was very little time and emotional effort. A breakeven is always much better than a loss, so I move on!
Happy Trading
Gus