The Big 4
In our November and January newsletter articles, a few trades were discussed for the Westpac Banking Corporation stock (WBC:ASX) but what about the other three major Aussie banks? Have they also had any tradeable lows? As can be seen in the split screen chart below, the stocks from this sector tend to move together. Commonwealth Bank (CBA), Australia New Zealand Bank (ANZ) and National Australia Bank (NAB) have also been on the up for the last few years.
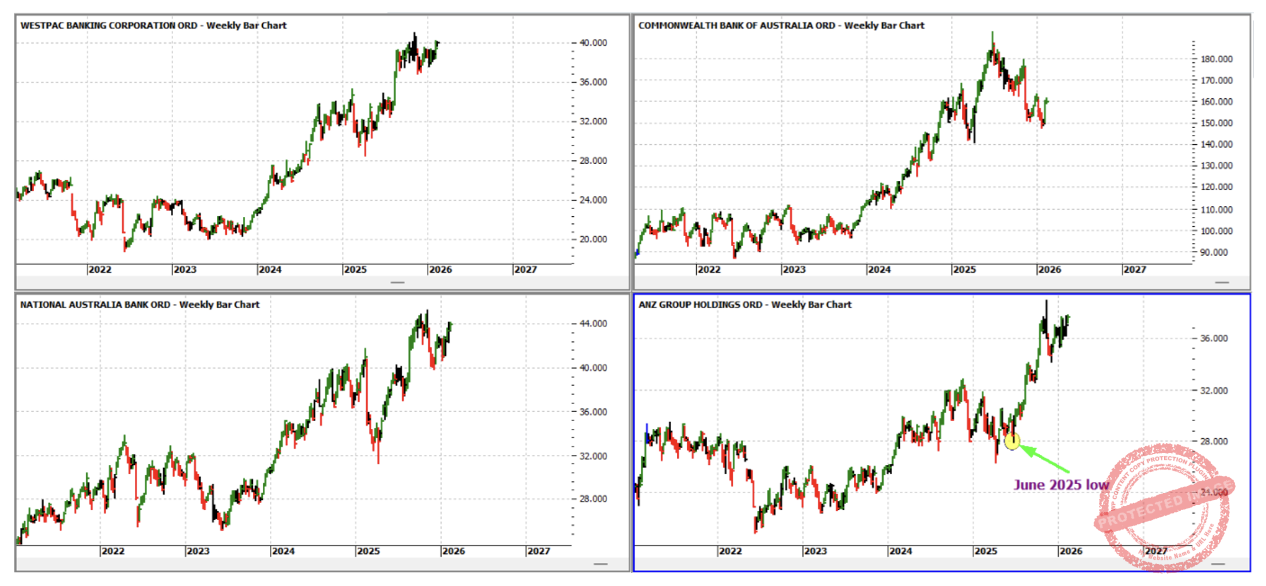
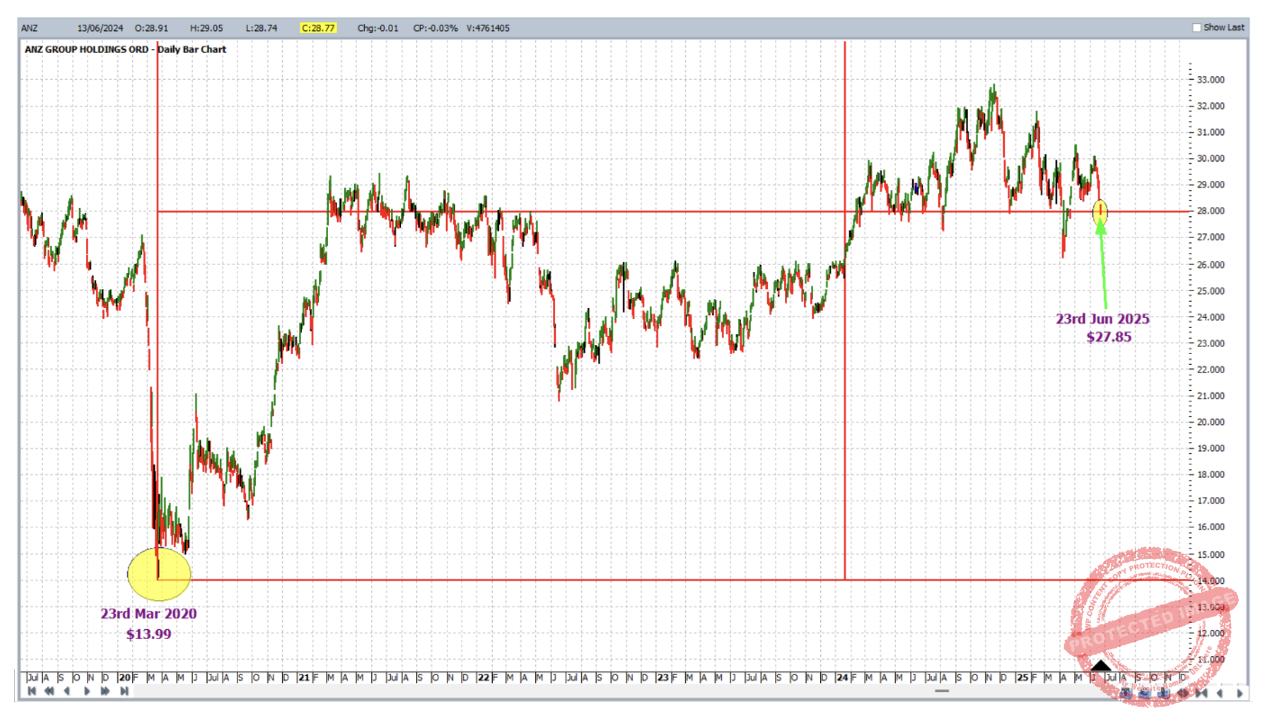
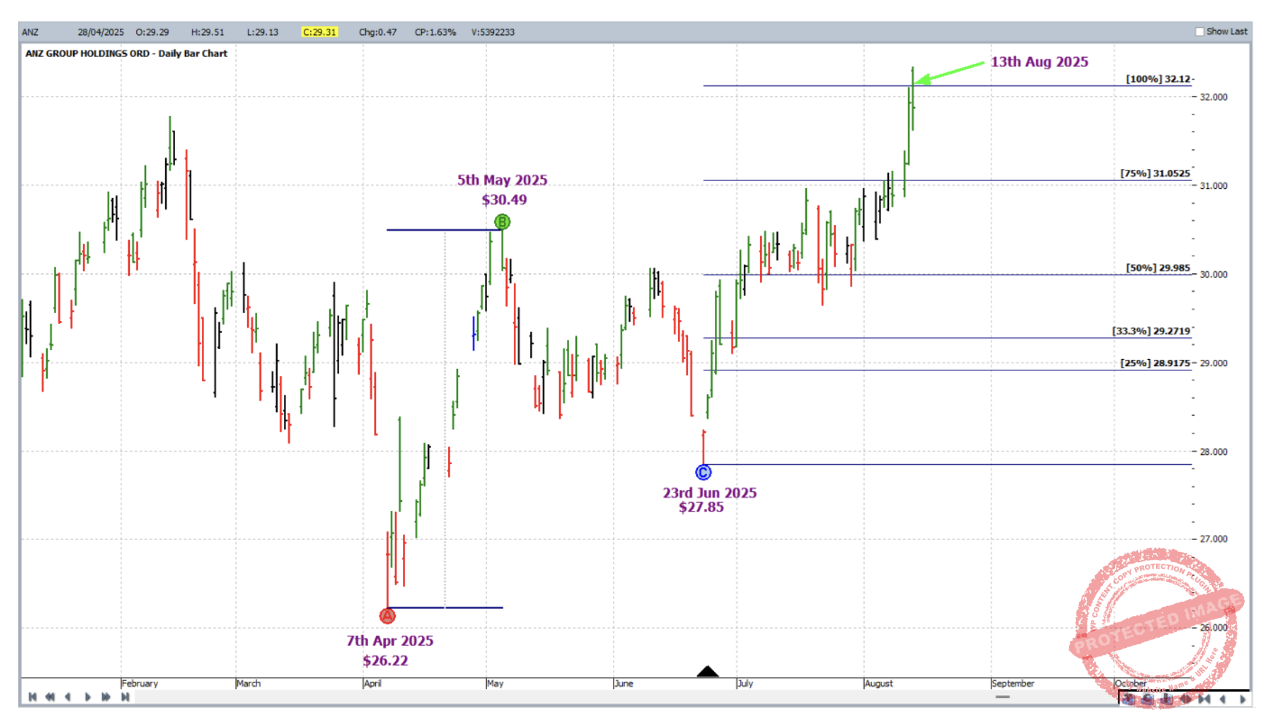
In the ANZ chart above the June 2025 low has been highlighted and this article will focus on the analysis, trade execution and rewards of trading out of this low. Let’s take a look at one of the analysis inputs – the Lows Resistance Card based on the 2020 low. This low came in at $13.99 on 23 March 2020 and 200% of that is $27.98; the 23 June 2025 low (or at this stage call it a potential low for the purpose of this article) was not far off at $27.85.
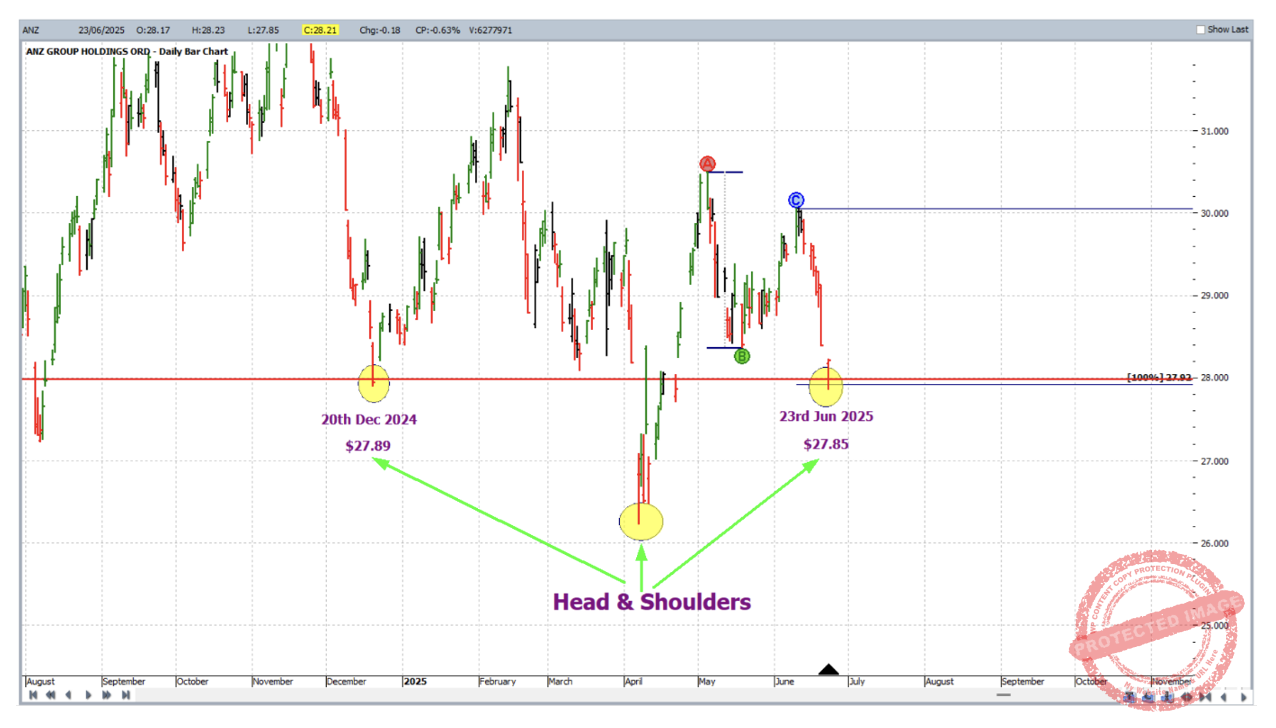
Now let’s zoom in for a closer look and see what else there was. The resistance level discussed above is shown below in red, but also we have a traditional head and shoulders pattern, and a 100% repeat of an ABC application.
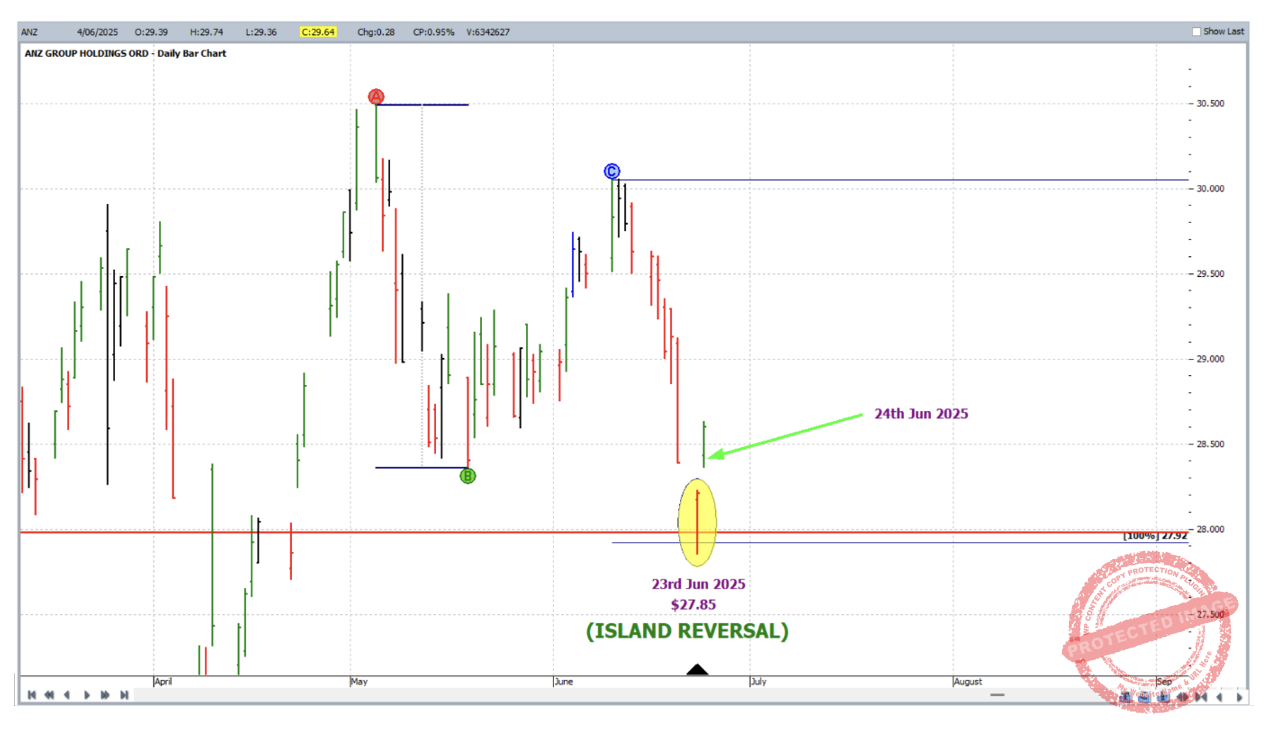
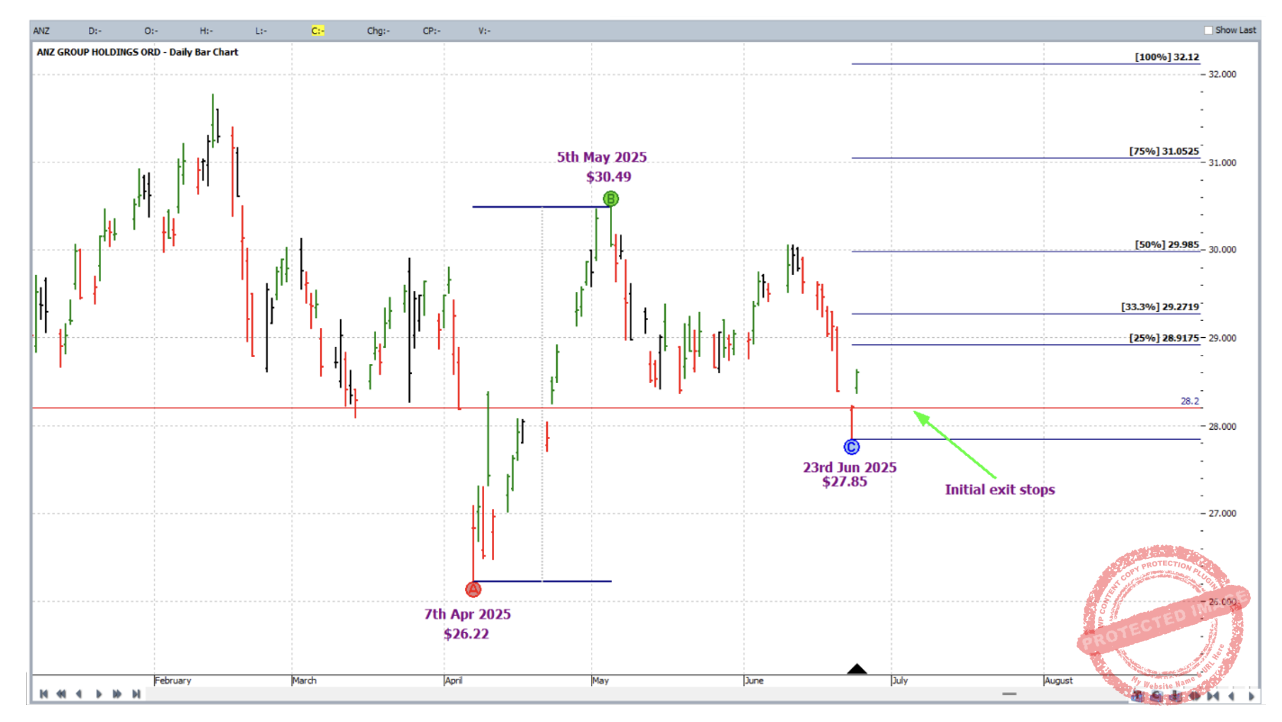
So with a few solid reasons to anticipate a reversal in the market, what about an entry signal? On 24 June 2025, the market gapped up on open creating an Island Reversal pattern – further adding to bullish sentiment. A Long the Opener’s entry would have you in at roughly $28.44 (1 point above the open of the 24th) with initial exit stops tucked away at one point below the close of the 23rd at $28.20.
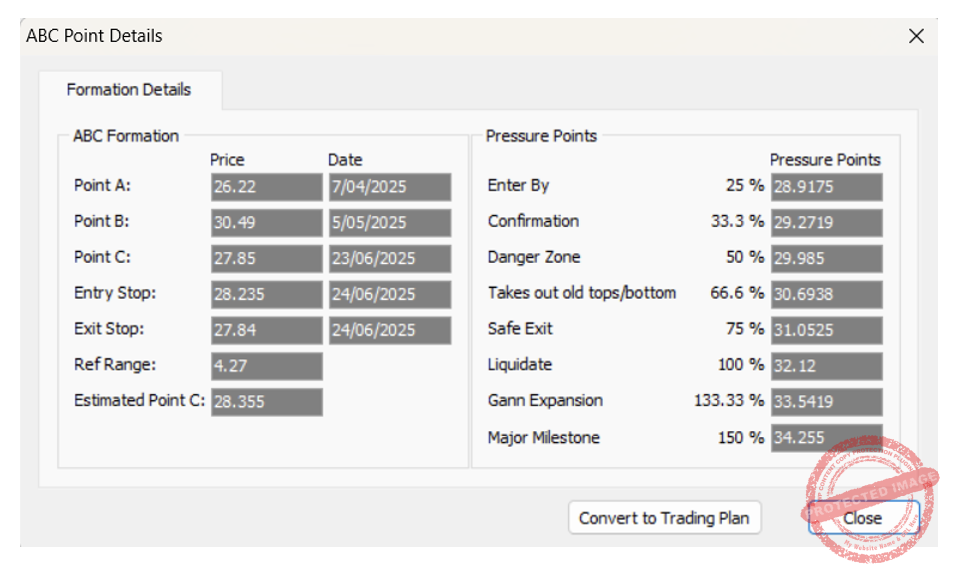
As for managing the trade, the reference range chosen was that from the April low to the May high, with Point C on our potential low of 23 June 2025 and 100% being the exit target i.e. the trade to be managed ABC Currency style. This is shown below followed by the ABC Points window.
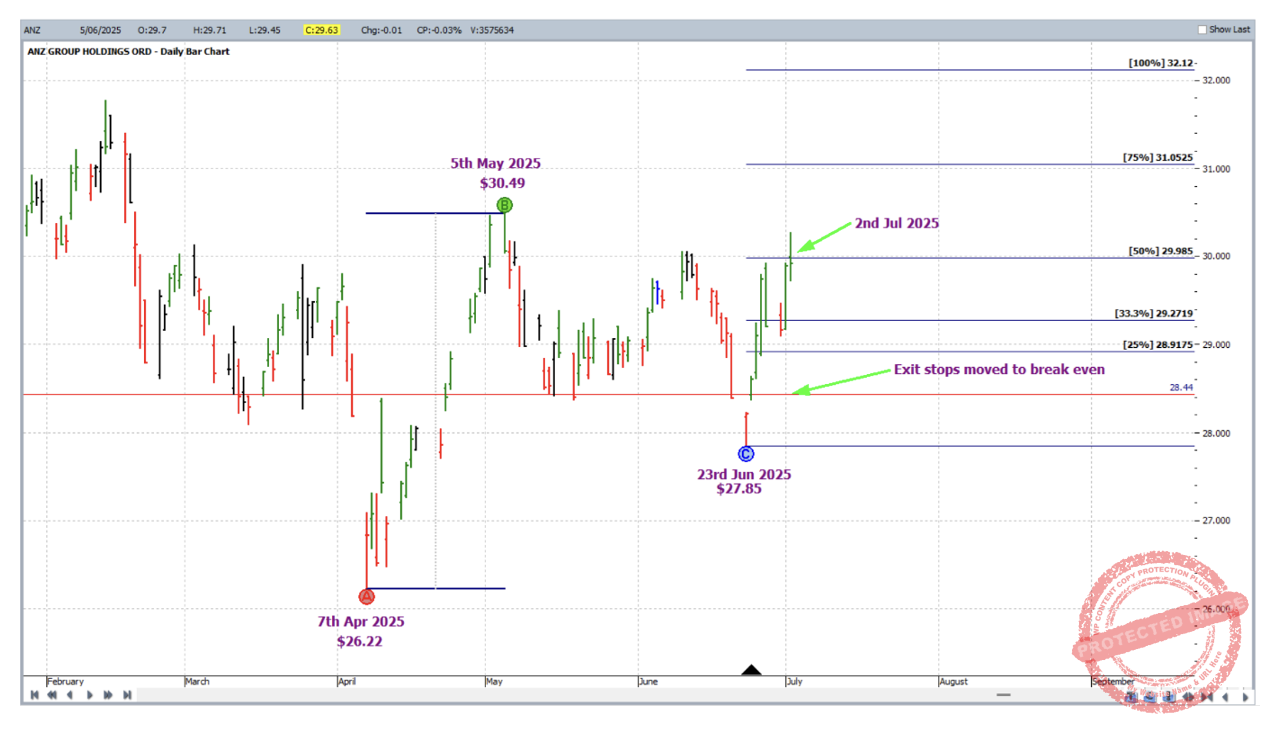
On 2 July 2025, the market reached the 50% milestone and exit stops were moved to break even.
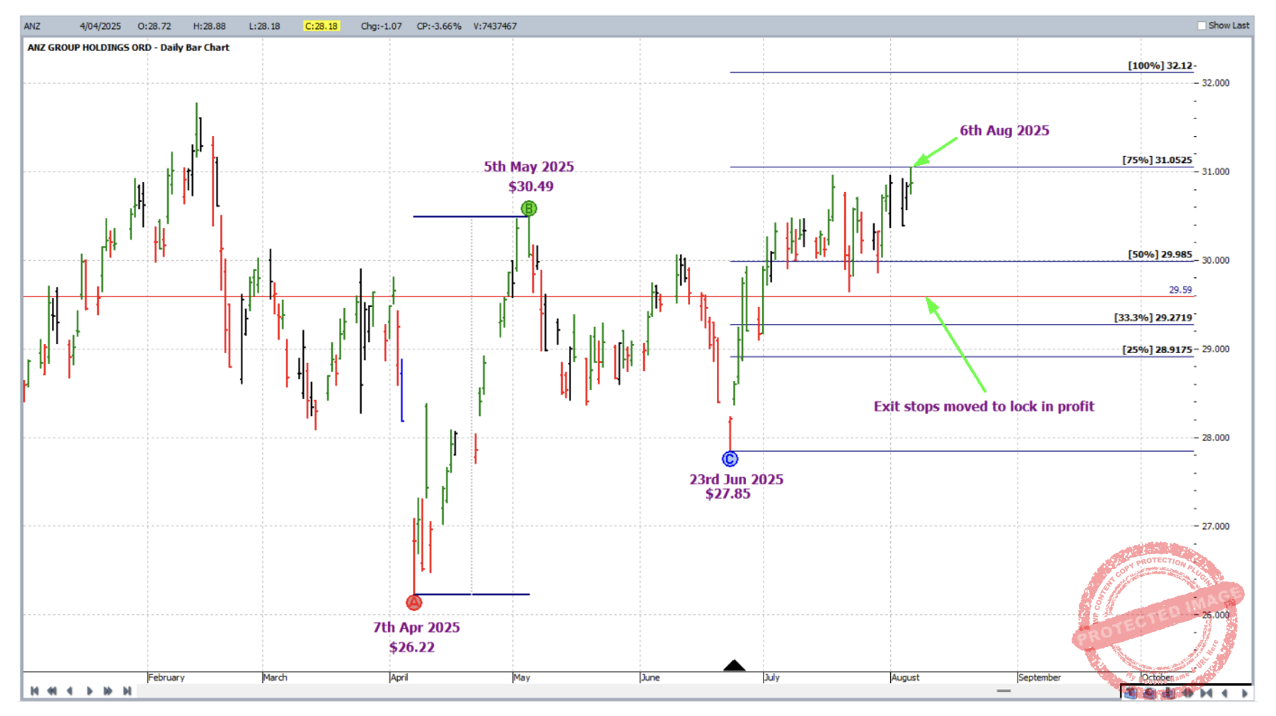
Then on 6 August 2025, the 75% milestone was reached and exit stops were moved to one third of the average weekly range (39c based on the last 60 weekly bars at the time) behind the 50% milestone to lock in profit.
And finally on 13 August 2025 the 100% milestone was reached and the trade closed at $32.12.
Analysing the rewards from a few different perspectives, first of all in terms of the reward to risk ratio:
Initial Risk: 28.44 – 28.20 = $0.24 = 24 points (point size is 0.01)
Reward: 32.12 – 28.44 = 3.68 = 368 points
Reward to Risk Ratio = 368/24 = approximately 15 to 1
If 3% of the account size was risked at entry, the gain in account size would be as follows:
15 x 3% = 45%
If 3% of a $10,000 account was risked, i.e. $300, the reward would be:
15 x $300 = $4,500
For Ultimate Gann Course students, there was at least one piece of time analysis supporting this trade.
Work hard, work smart.
Andrew Baraniak