Safety in the Market
  • Home
  • Why Choose Us
    • Why Choose Us
    • About Us
  • Why Learn To Trade
    • Why Learn to Trade?
    • How To Get Started
  • Active Trader Program
    • Active Trader Program
    • See What’s Possible
    • Further Studies
    • Frequently Asked Questions
    • Support
    • Ready to Order
  • Testimonials
  • Free Resources
  • Contact
  • Member Login
Select Page

TSLA Series – Yearly End

by SITM | Dec 12, 2019 | General Newsletter, Rob Steer, Shares

TSLA Series – Year End

Let’s take one last look at Telsa for 2019…
With less than one month left of the decade and the awaited 2020, the past 12 months have flown by. Reflecting on 2019, I believe it shaped up to be a very opportunistic year with plenty of markets to take advantage of.

As this is our final newsletter for 2019, we will review the bigger picture of TSLA in order to provide some bigger picture direction for 2020. For those who have not yet taken the time to review the past couple of TSLA Series newsletters, all I can say is hindsight is a beautiful thing. Let this help guide you into the new year.

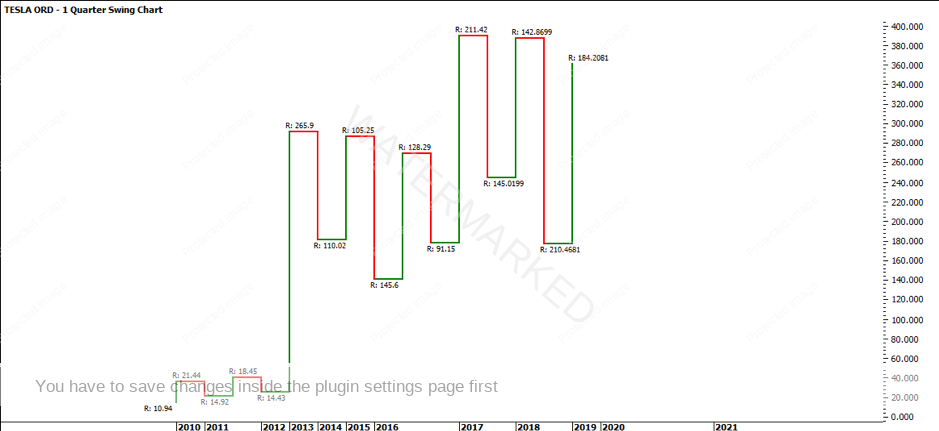
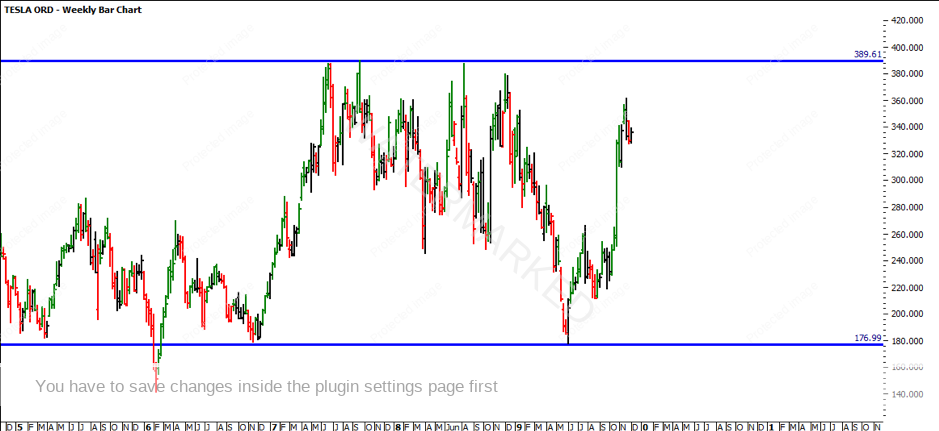
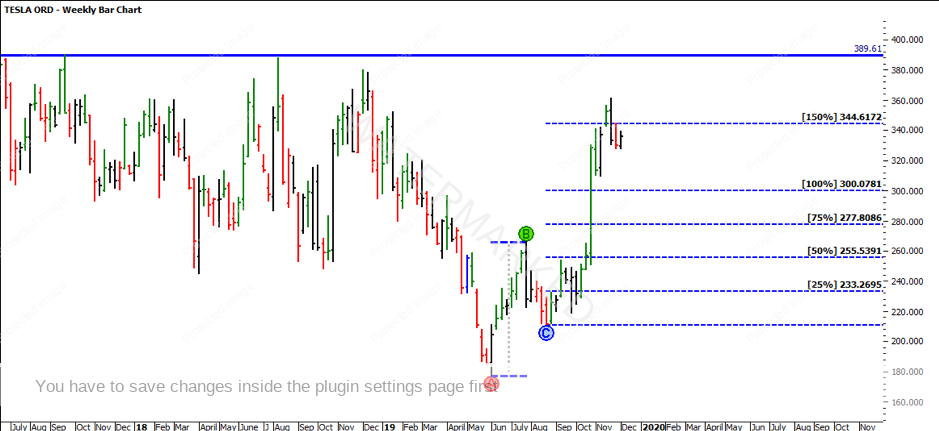
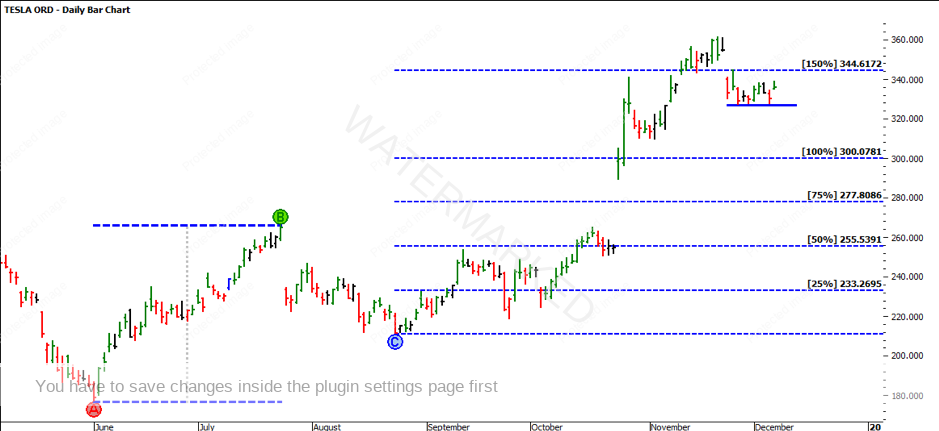
Turning to the charts below, the quarterly swing chart has not yet created a higher top. In the instance the market does not break the previous top, there could still be an opportunity for an overbalance of price trade. As you would be aware, this type of trade allows you to take the trade without ‘Point B’ exceeding the previous swing high.

As mentioned last month, the previous monthly swing range down showed an over-extended range of $202.49. The next downswing was clearly a contracting range, coming in at $55.07 and making a higher swing bottom. We are yet to see another monthly swing bottom be established. The most recent monthly swing top provided a range of $150.20. This is closing in on 200% of the previous swing. Assuming there is a continuation of the monthly up trend, it might be worth watching for the previous tops to see how the market reacts. This might be a subtle sign that there is an exhaustion in the upside if it is over extended.
Turning to the weekly swing chart, the market continues to produce higher tops and higher bottoms. The most recent swing high produced a range of $51.94. This range failed at below 50% of the previous range of $122.48. The most current pull back is showing harmony amongst the previous down swings. The previous swing low was $31.58 and the swing before that was $35.14. The fact the most recent pullback is $34.10 doesn’t mean the trend is over, however you can be on alert that we might see some further pullbacks before it finds its support to move higher again.
Instead of putting the 1-day swing chart in this month, we will review both the 2 day and 3-day swing charts. The 3-day swing chart has clearly continued to move higher. Obvious swing resistance was broken at approximately $270, and since then the market continued to move higher. The current range of $142.84 is the strongest swing range since the early parts of 2018.
There is clearly a lot more harmony in the 2-day swing chart. What is meant by harmony is that there is balance in the swing ranges. Whilst some swings are obviously larger to the naked eye, the overall movement of the trend looks a lot healthier than the 3-day swing chart as this looks overextended from that perspective.

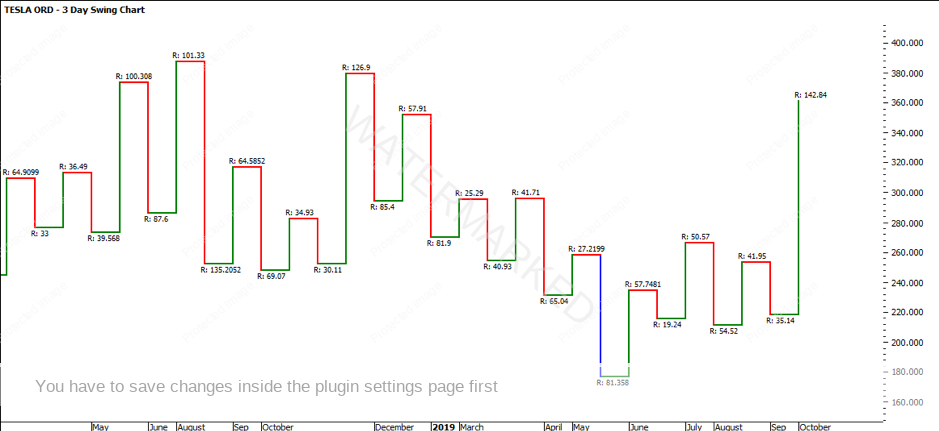
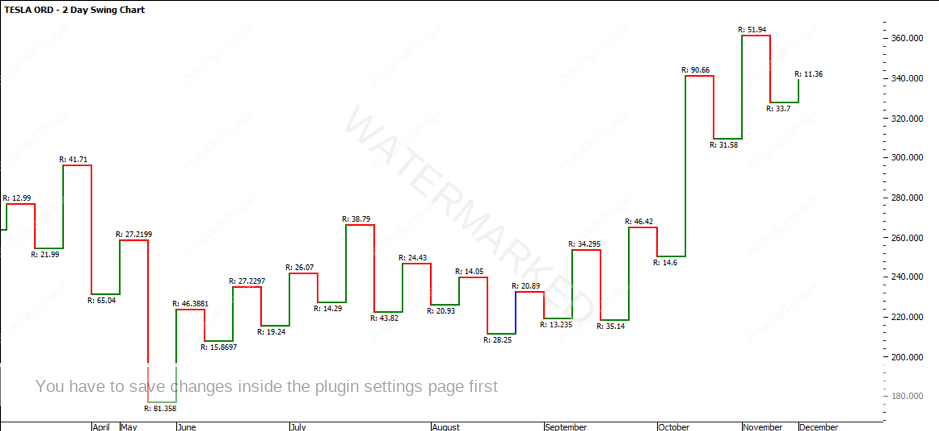
The 2-day swing ranges are still pulling back with similar ranges, so again there is no cause for concern at this stage, but it is something to monitor and be aware of if the market starts to change.

Understanding the trend of the market can provide some insight into what we can expect with TSLA. In the chart below, a blue line has been placed on the all-time high (ATH) level at $389.61. Assuming the market was prepared to break this level, it would want to test it. Currently the market action sits around some previous ‘minor’ tops at $360, which is a psychological level. If there was to be a pull back before the market wanted to re-test the ATH, a pullback would be considered healthy at these levels.
The very first weekly ABC level that was investigated back in August 2019, has now held the market up at its 150% level. David Bowden talks about the 150% level as being a place for a potential change in trend yet focusing on the fact that the majority of the swing charts are pointing up, it will be going against the trend to take a short position. Do you think it would be healthier to watch for a new weekly ABC trade?
There is currently a weekly ABC trade present. We have seen a very small inside bar produced which often is a sign of accumulation prior to the bull or bears push to win the direction of the trend. While a new weekly ABC is present, you will need to be aware that we currently have run 150% of the previous weekly ABC trade. Assuming there is potential to go long, the 100% level will allow you to take profit before it retests the ATH
Finally, zooming into the daily chart you can see the market was able to jump aggressively from the 50% level up to the 100% level and continue onto the 150% level. It spent a few days hanging about the 150% level at $344.61 before it gapped down and is now holding at $320. This pull back in the context of the full run is very minor and if we do see a break of the few daily lows, there would be no surprise.

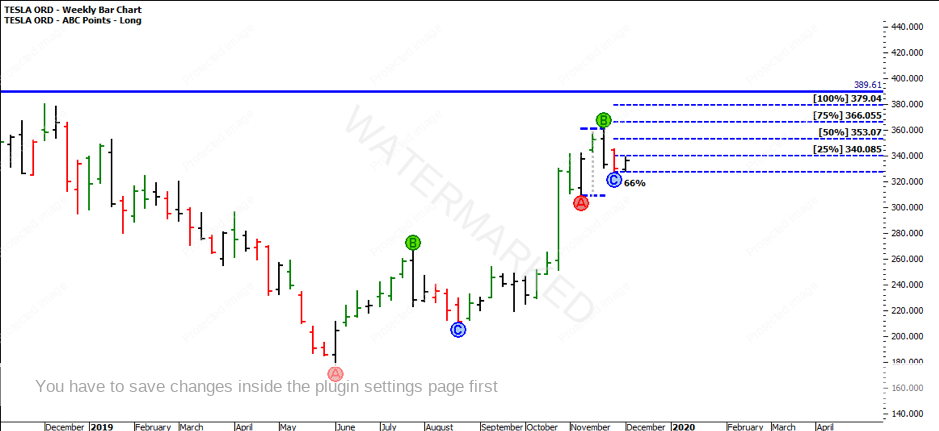
In saying that, this does not mean the overall bull trend is over. It might mean it needs a healthy pullback in order to build the momentum to push higher again. The subtle signs are often very helpful when collaborating the roadmap.

In closing, I would like to say a huge thank you to everyone who reads the newsletter, wherever you are on this wonderful trading journey. From all the team at Safety in the Market we wish you a wonderful festive season and look forward to touching base with everyone in 2020.

It’s Your Perception,

Robert Steer

Search

Resent Posts

  • Feeling Abundant February 27, 2026
  • What’s in a Number? February 27, 2026
  • Most Traders Focus on Being Right – Professional Traders Focus on This Instead February 18, 2026
  • Home
  • Terms and Conditions
  • Privacy Policy
  • Financial Services Guide
  • Legals

Copyright © 2025 T&D Global Pty Ltd as trustee for T&D Business Trust 1 | www.safetyinthemarket.com.au | Web Solution by Dsynit