
A Quest for Harmony
If I cast your mind back to last month’s article, ‘Sitting On Old Swing Highs’ you’ll see that I had my two Price Forecasting scenarios for the SPI200. Being fortunate enough to have time in my bag of trading tricks I also had a pressure date to watch, being 9 October.
Scenario 1: 8538 – 200% Weekly First Range Out price target
Scenario 2: 8667 – 8685 – Daily higher bottom target.
Now my pressure date was good, and we did see Scenario 2 play out, however my price forecast was a bit off and the SPI200 actually made it’s higher bottom at 8619, within 1 point of an exact 75% retracement.
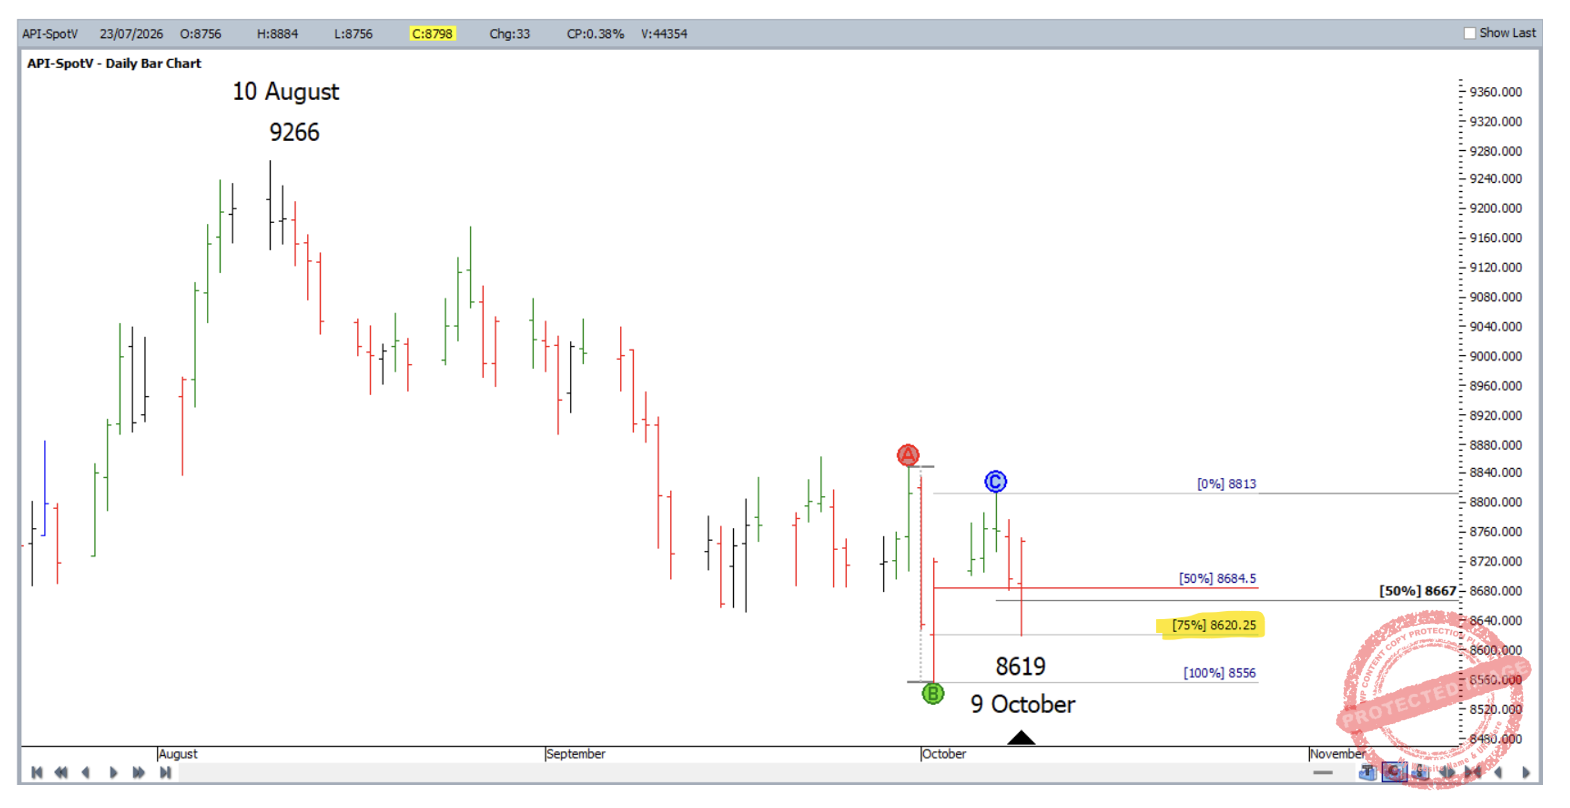
Chart 1
The main question should be, how would you know at the time (on 9 October) that the market might be putting in a higher bottom and that’s a place to trade long out of.
The best place to look is on the daily swing chart and to examine the ranges. What you should notice in Chart 2 below is three weekly sections down, followed buy a daily swing up of 257 points. If you look at the daily swing ranges after 10 August, you will see that 257 points is the biggest daily range up in the last two months. This is a good sign that the market is overbalancing in price to the upside.
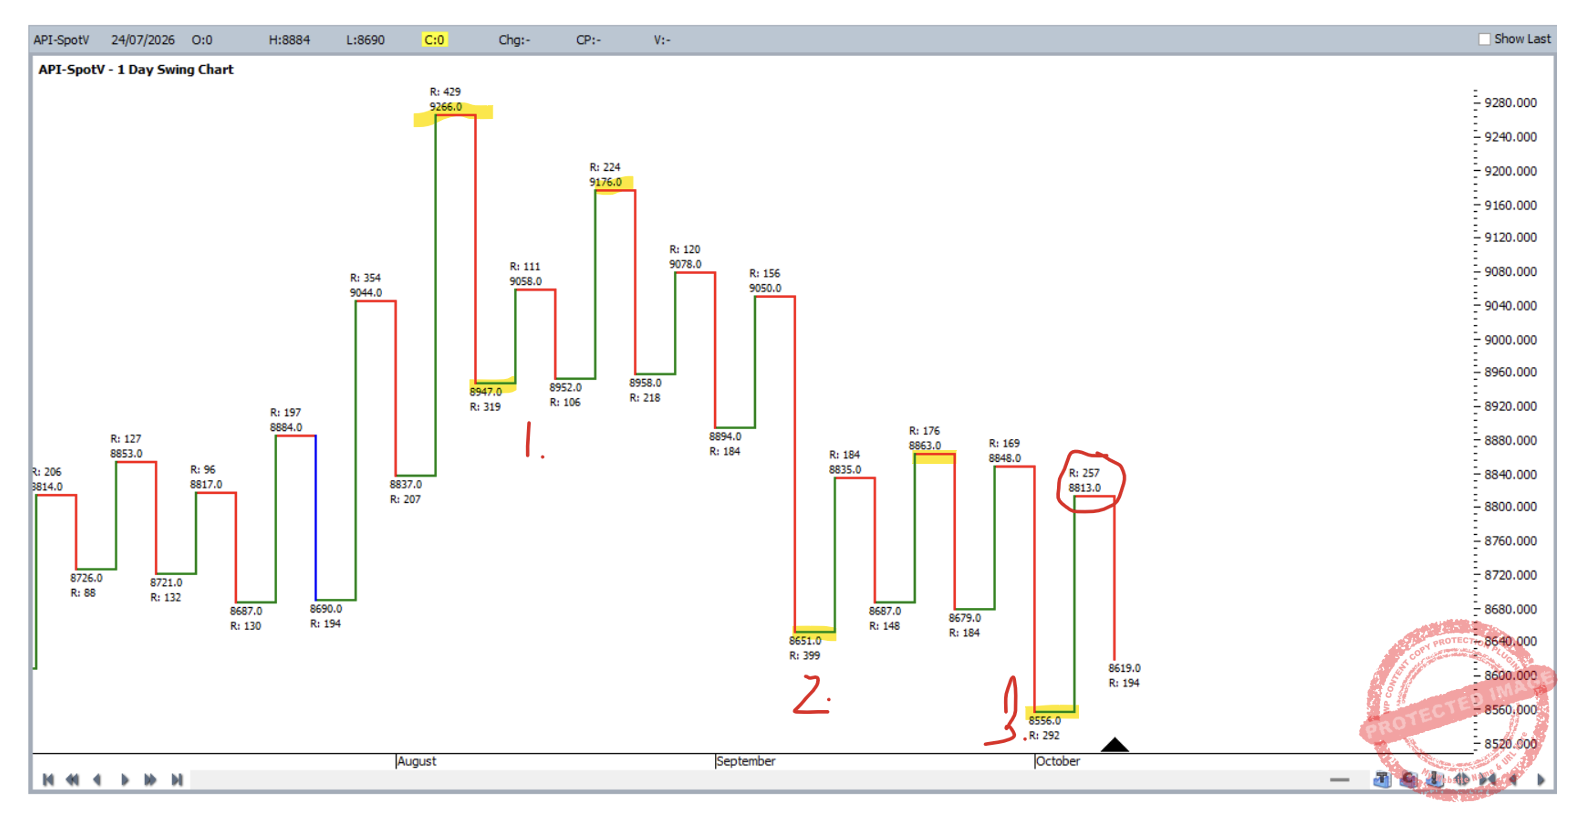
Chart 2
Now the market has pulled back into a 75% retracement but don’t count out the 50% milestone yet at 8667, keep this number in mind. What often happens is the market pushes through the important 50% levels then comes back to sit on these levels which is often where you can find a trade.
After seeing the 257 point daily swing up and watching the pullback, we can apply the exact same Price Forecasting approach on the next time frame down, the 4 hour bar chart to get an understanding of where the daily swing might finish.
Looking at Chart 3 below, the 4-hour First Range Out from 8813 gave us a 200% price forecasting target of 8627.
Also, Section 3 came in at 100% of Section 2 with a price target of 8637.
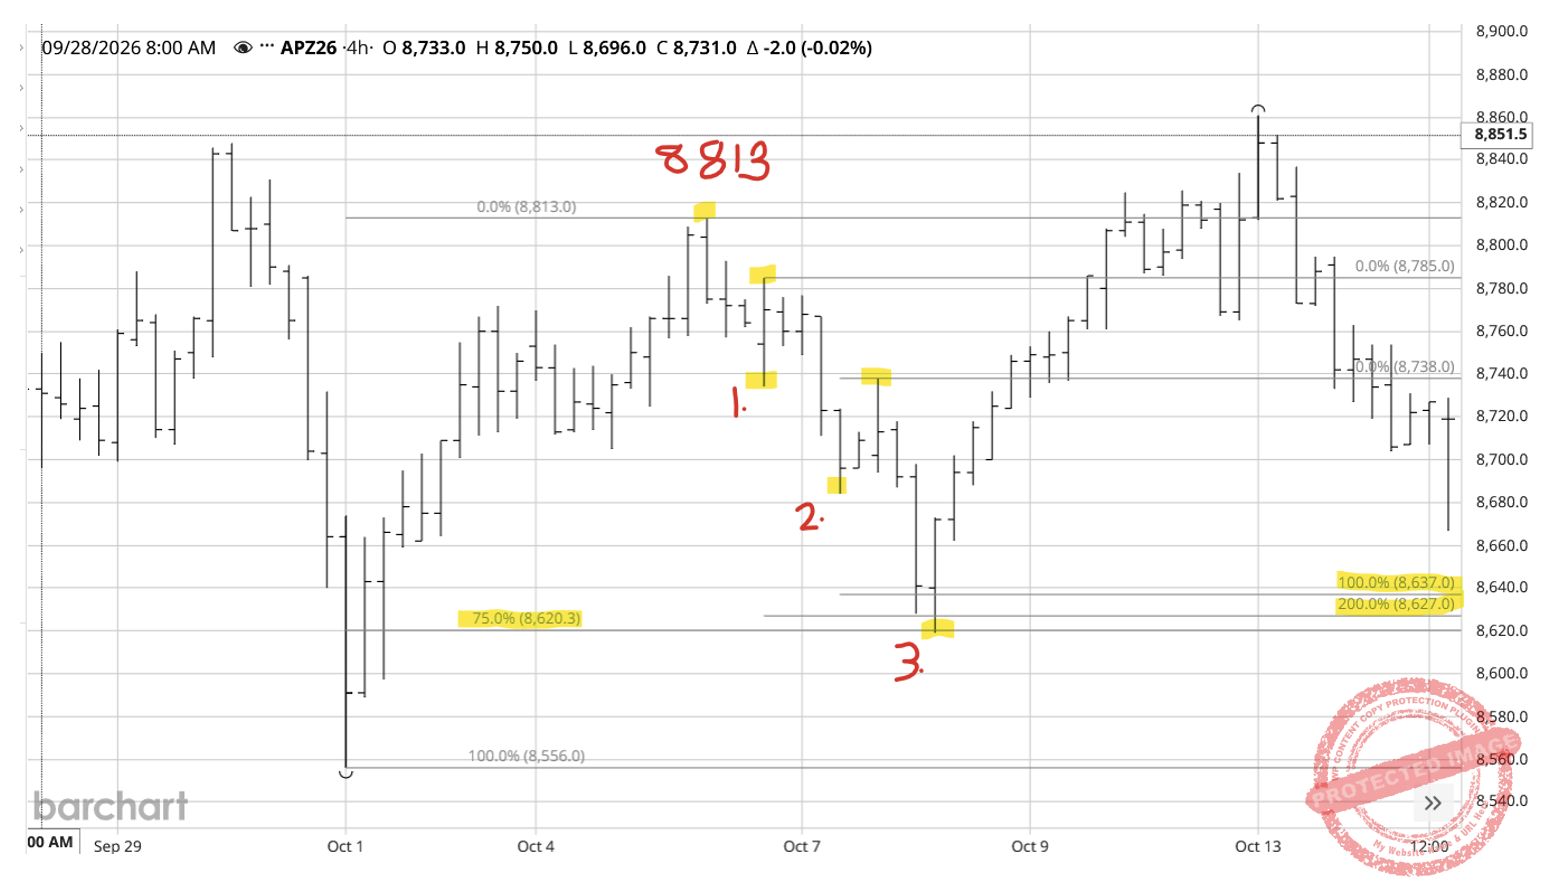
Chart 3
So just to recap, within this daily swing you have:
- 3 x 4-hour swings down
- 75% retracement = 8620
- 200% of the 4-hour First Range Out = 8627
- 100% of Section 2 = 8637
Now remember I said don’t count out the 50% price milestone of 8667!
If you were watching this at the time as the 4-hour swing turned back up it crossed back through 8667, so you could have entered on the 4hour swing chart as it turned back up with a risk of 56 points. This daily swing low still holds, so it’s possible that you could still be in this trade.
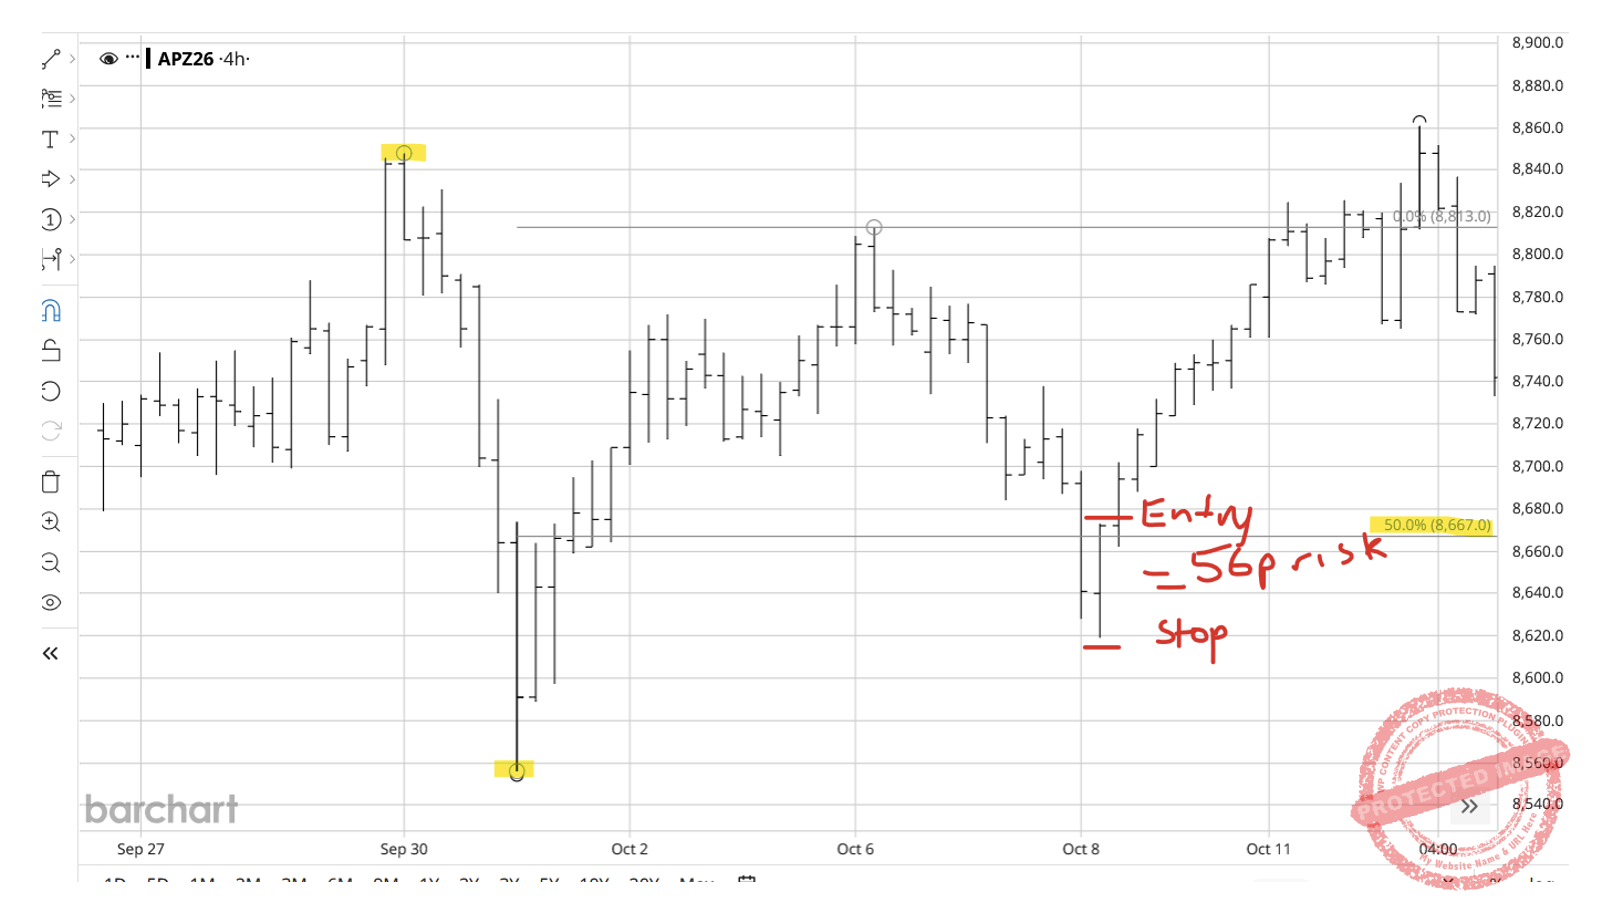
Chart 4
Or if you prefer a smaller time frame the 1-hour bar chart had a first higher bottom that came to rest on 8667, if you had taken this entry, you could have been in the market with 17 points of risk (not including spread). This stop at 8661 has also not been taken out.
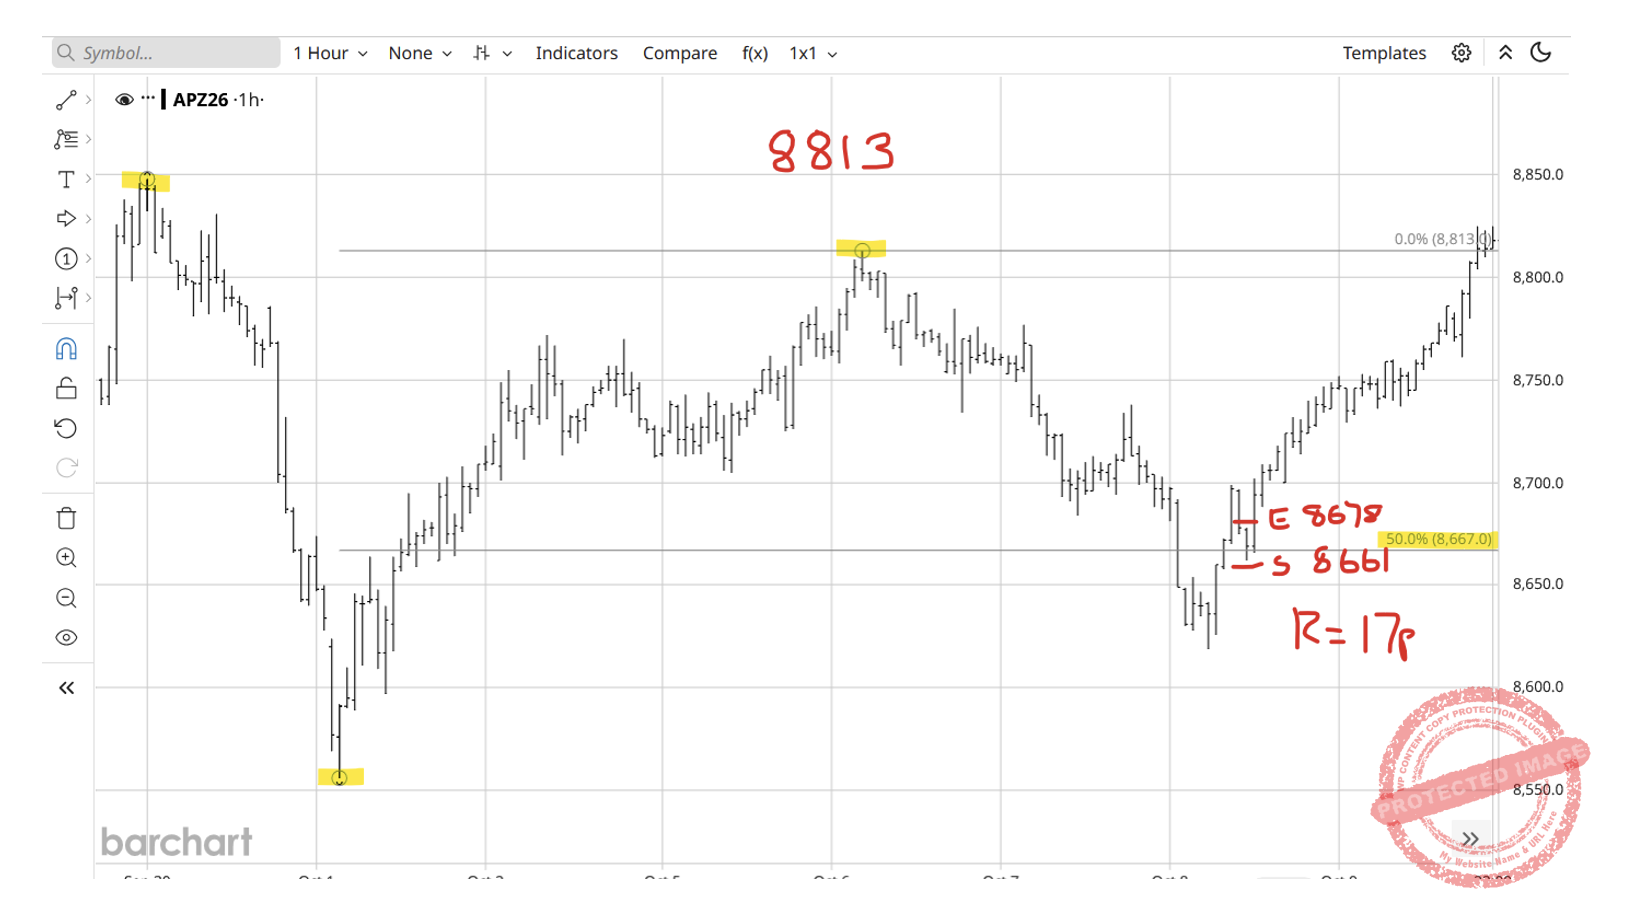
Chart 5
An important point here is that certain numbers have a way of staying relevant to the market and it’s our job to track them and be on top of them when they come around. I can only track these numbers if I set it out the same way as David did, that is by hand charts!
Funny enough, the current 4 November low of 8808 came to rest on 8813 before moving away quickly.
Happy Trading,
Gus