Cocoa – Return of the Bulls?
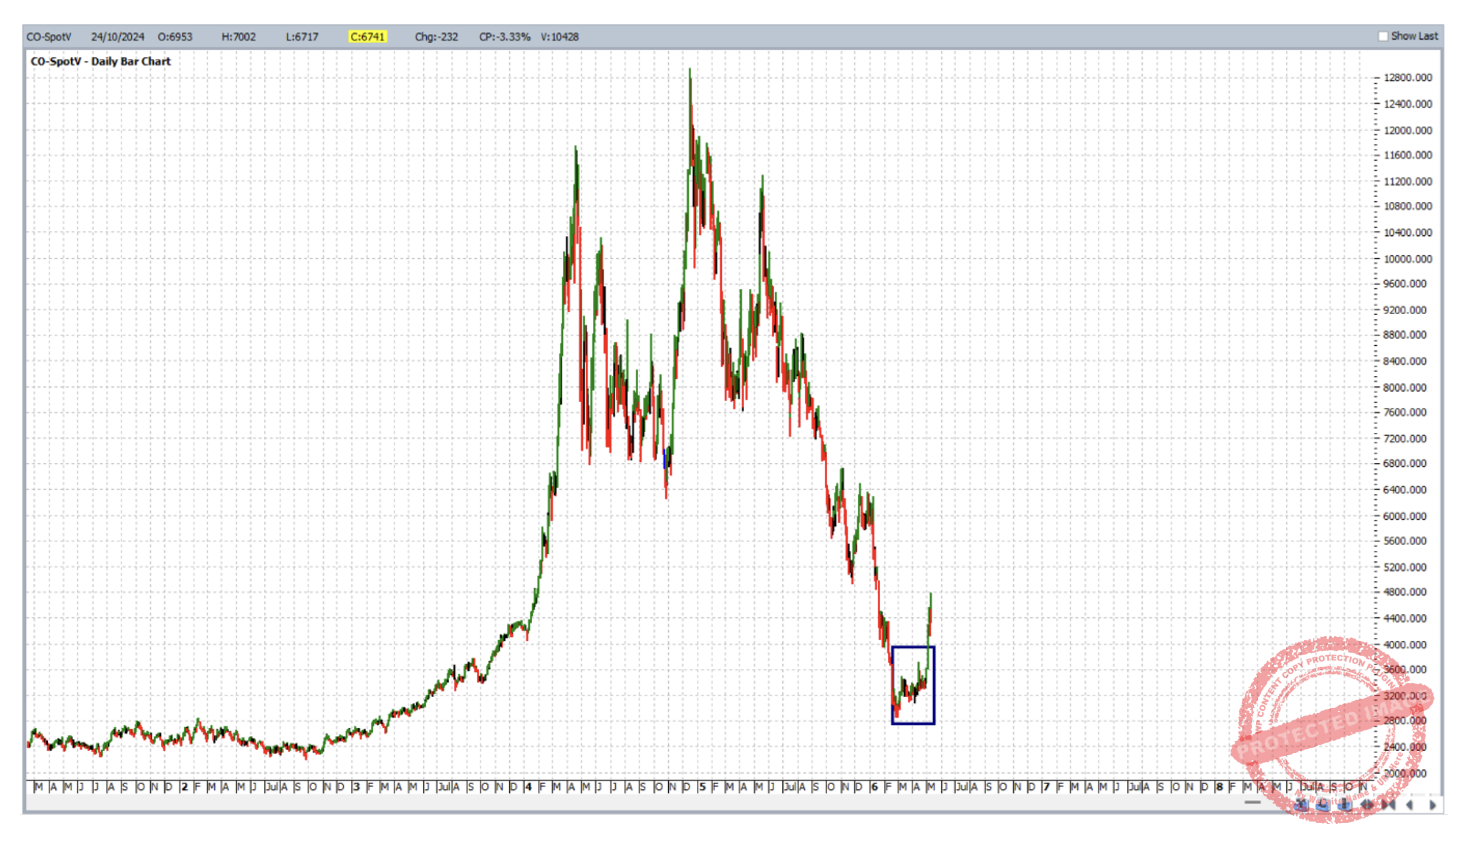
After a strong sell off from its big high of 12,931 USD per metric tonne at the end of 2024, Cocoa is back to low levels with plenty of room to move back to the upside. The current low of March 2026 sits at a price of 2,846. This is shown in the ProfitSource chart below, chart symbol CO-SpotV.
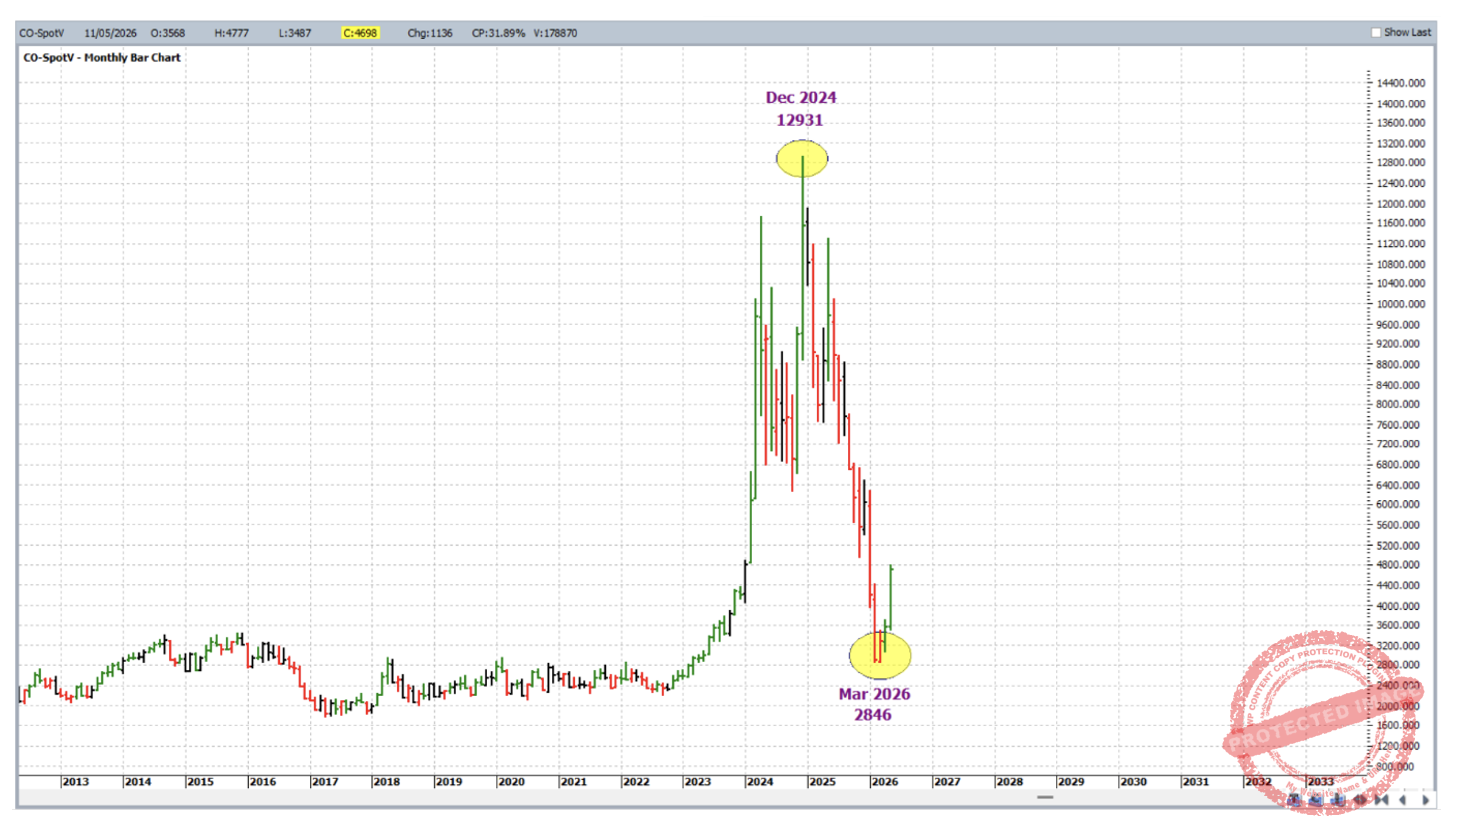
The bull market from 2022 to late 2024 and the run back down showed us the kind of moves this market is capable of, but who is in control now, the bulls or the bears?
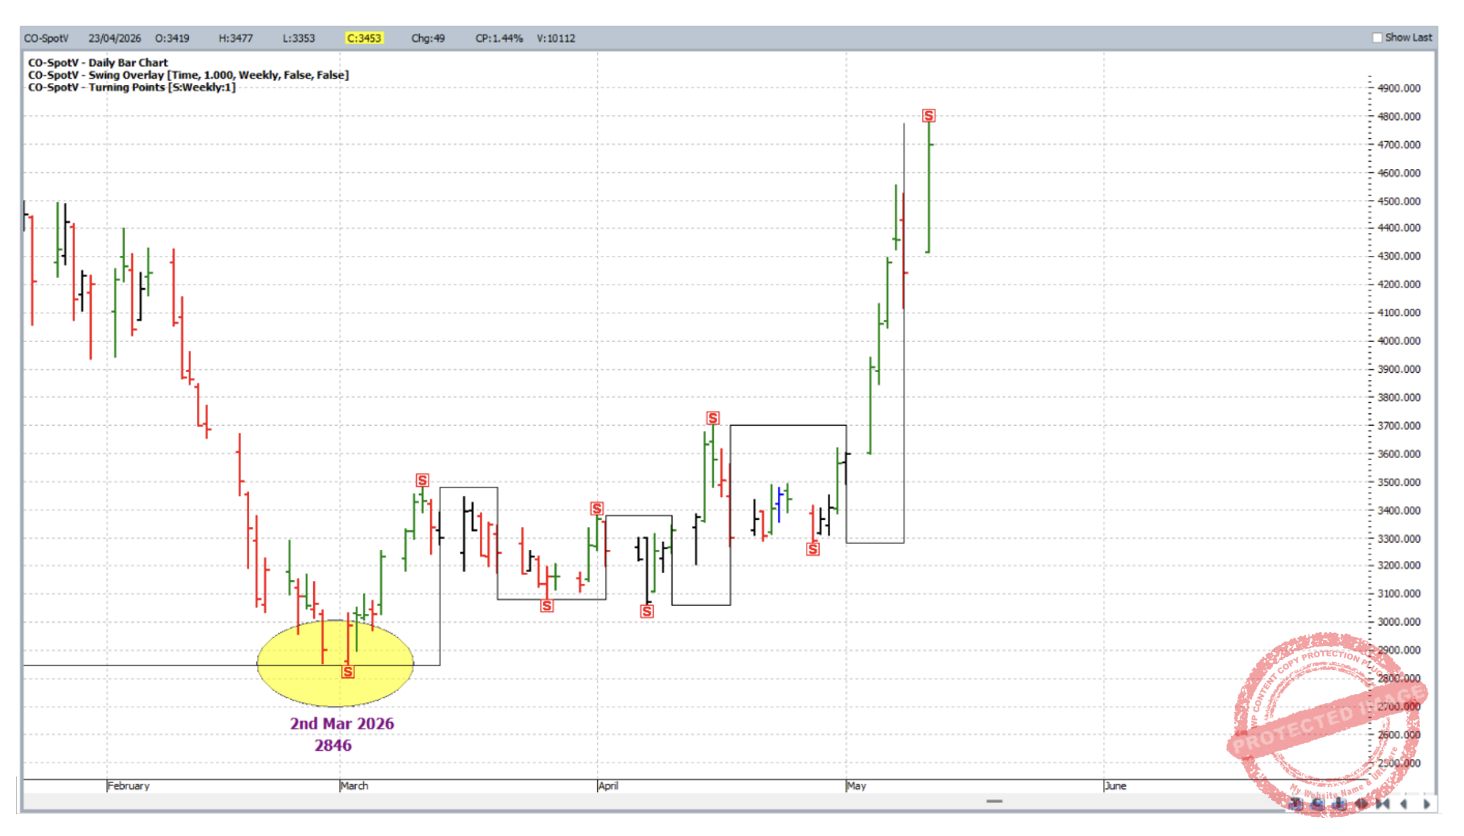
Let’s keep it simple and first apply some knowledge from the Smarter Starter Pack manual, in particular swing charts. In the chart below this is done by way of a weekly swing chart overlay (and the Weekly Turning Points Hi-lite). The current weekly swing chart trend is UP, with expanding up swings. This is bullish. If you look closely enough at the daily bar chart you would note that the daily swing chart trend would also be currently UP with higher tops and higher bottoms. The last confirmed daily upswing is well and truly expanding.
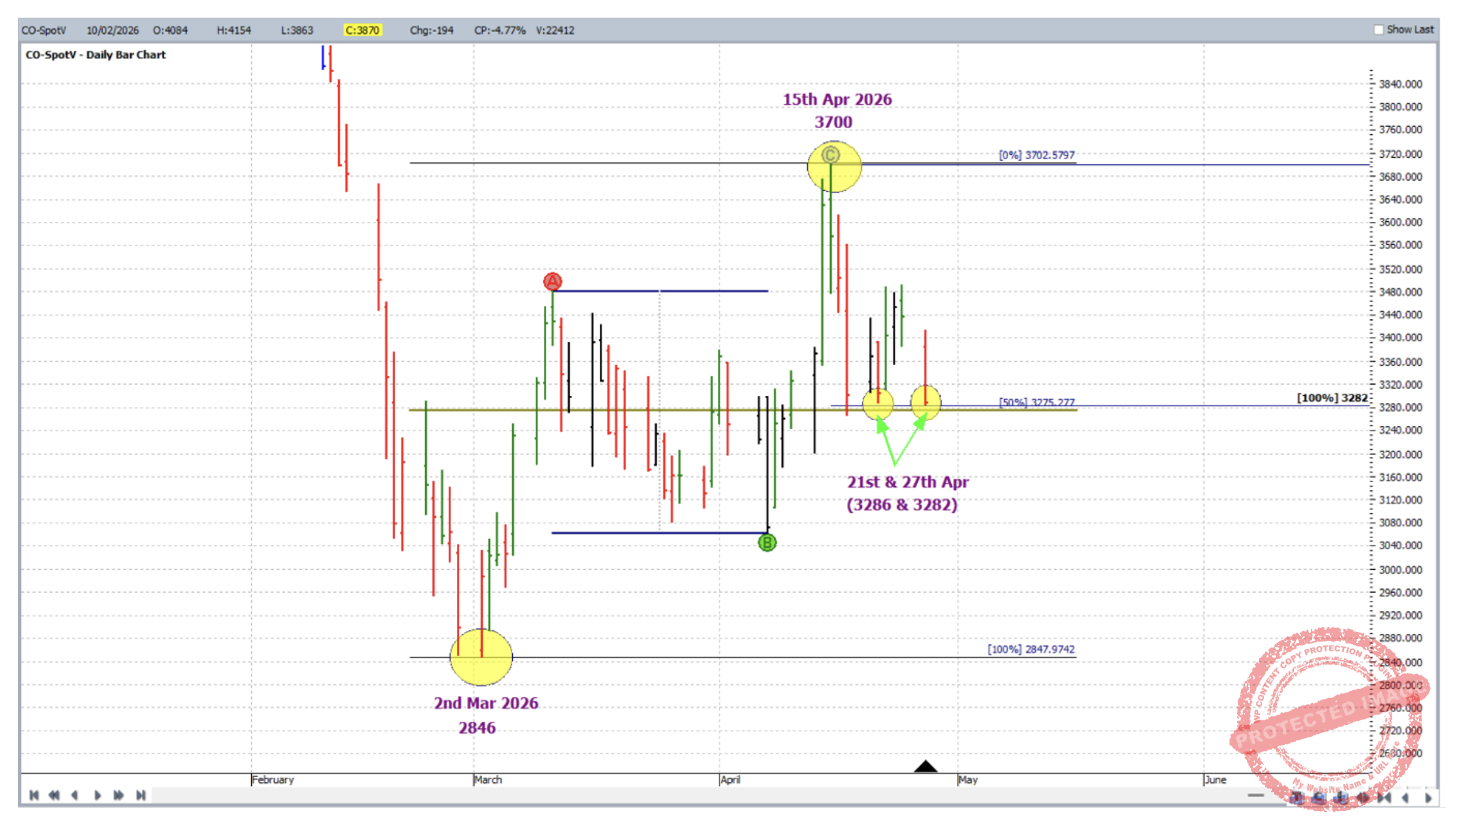
And what about something from the next manual in our series, the Number One Trading Plan? Zooming in a little more we see that there was a price cluster which became of interest towards the end of April. In particular the 21 April 2026 and 27 April 2026 lows were potential (small picture) double bottom partners. These two small lows clustered with the following:
- The 50% resistance level on the Ranges Resistance Card applied from the March low to the April high.
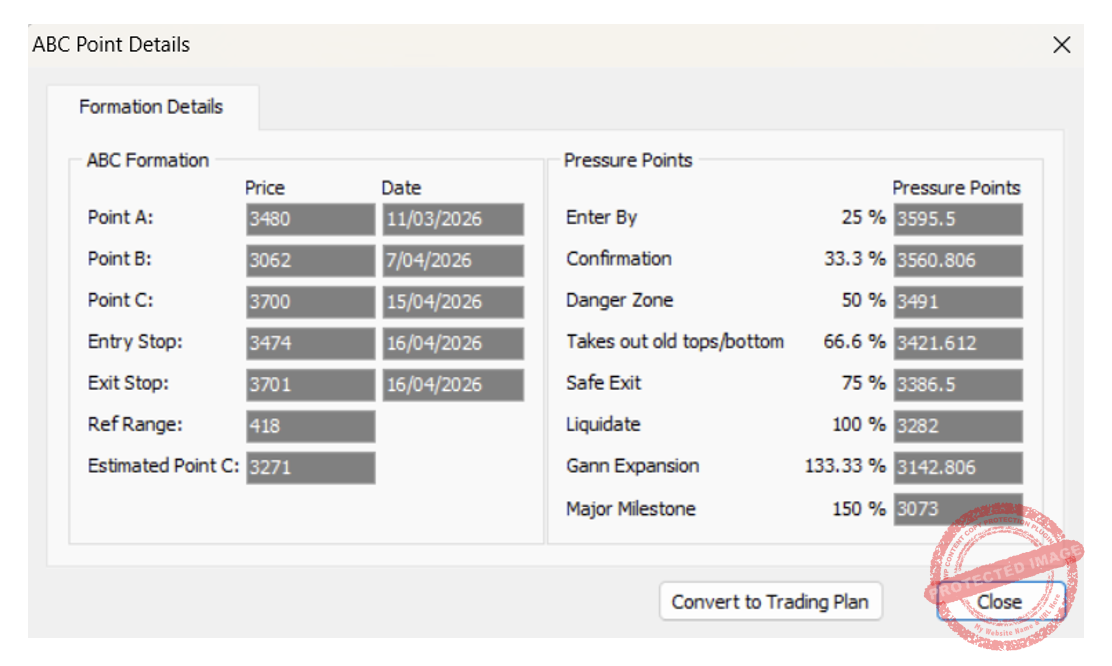
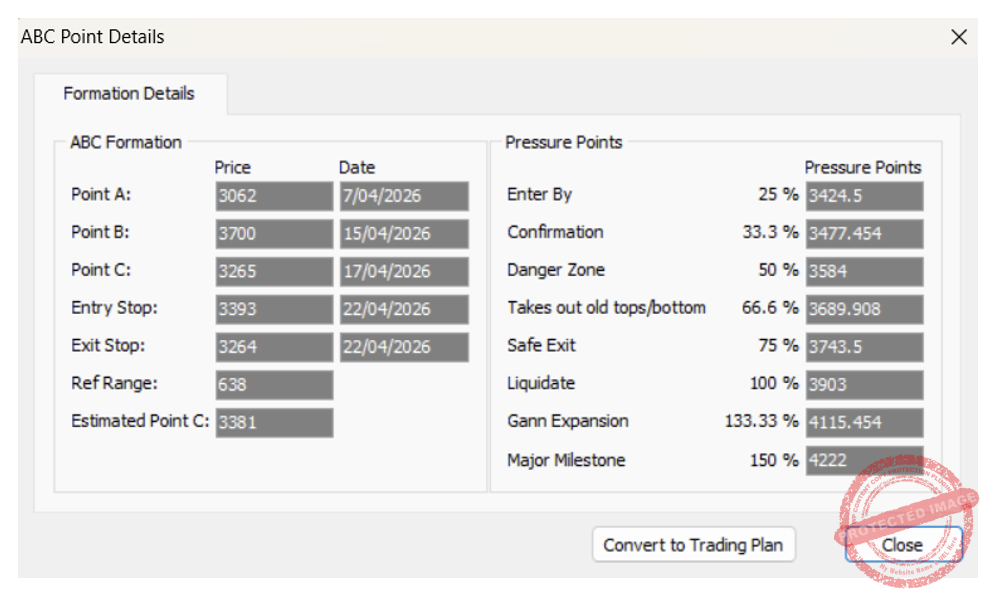
- The 100% milestone of the ABC Pressure Points tool application (shown in the chart below (in Walk Thru mode) which is followed by the details window.
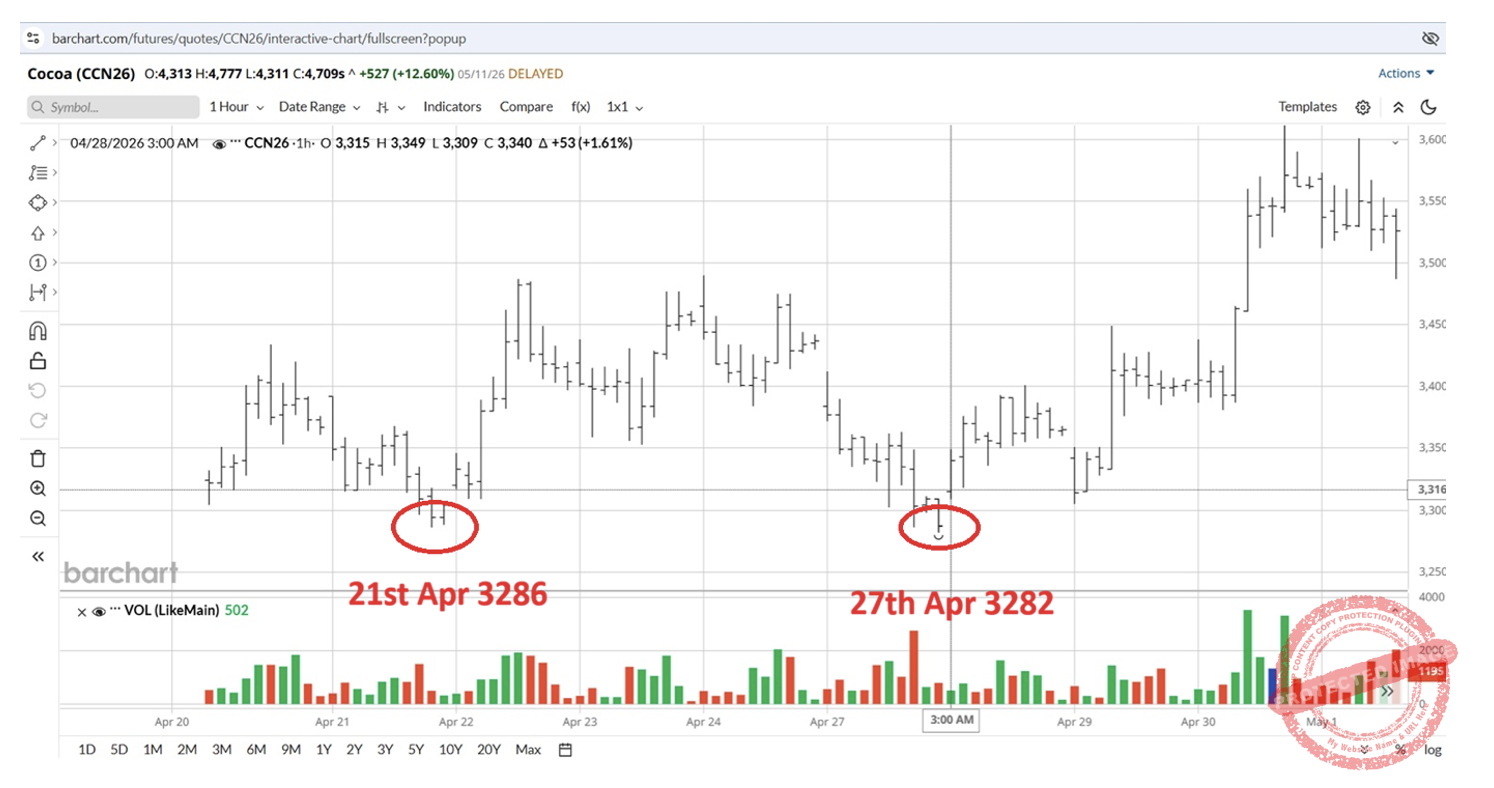
What about a trade then? For those who have a tendency to trade with a higher frequency and like to get close to the market, there was an intraday entry on the hourly bar chart right at the low of 27 April 2026; this is shown in the chart below from www.barchart.com; The upturning of the hourly swing chart at 3am New York time on 28 April 2026 had you long July 2026 Cocoa at 3,315 with an initial exit stop at 3,281.
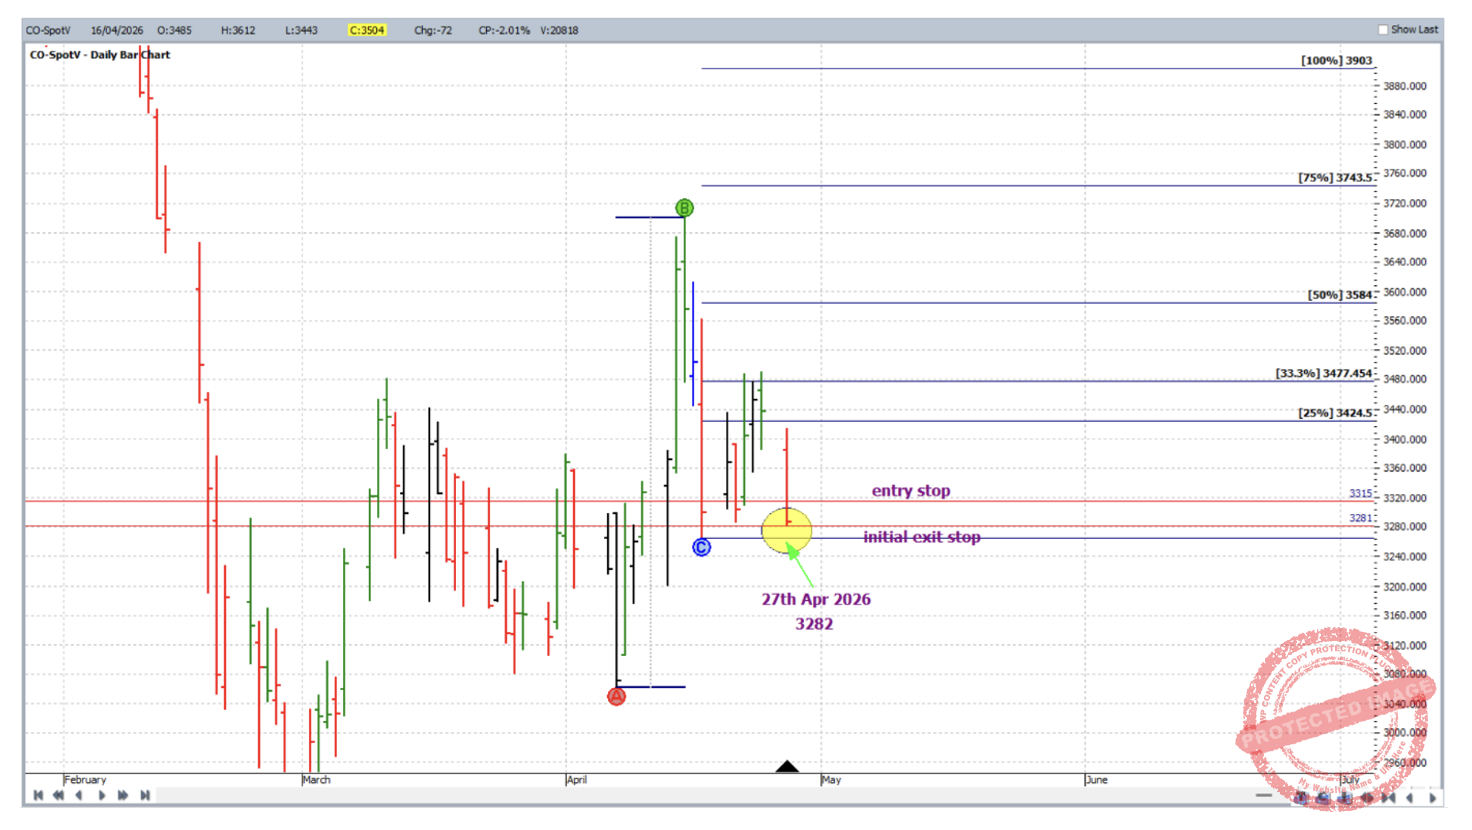
Now to the trading plan. The AB reference range as illustrated below will be used; initial entry parameters are shown and the trade was managed like a standard ABC Currency style (the chart is followed by the ABC details window).
On 30 April 2026 the market reached the 50% milestone and exit stops were moved to break even.
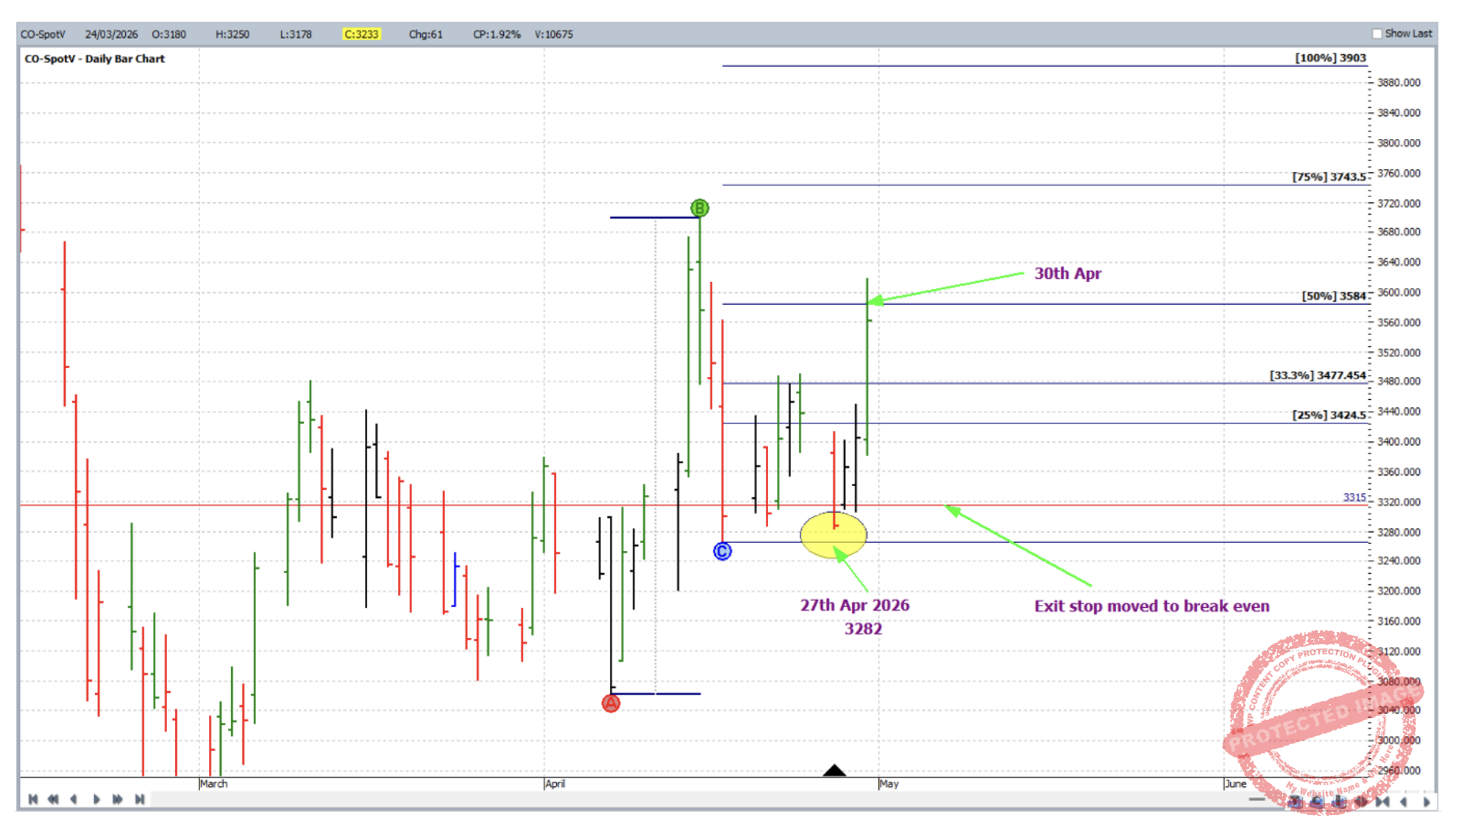
And on 4 May 2026, in one big generous up day, the market broke through both the 75% and 100% milestones, locking in profit on the way with the trade closing at 3903.
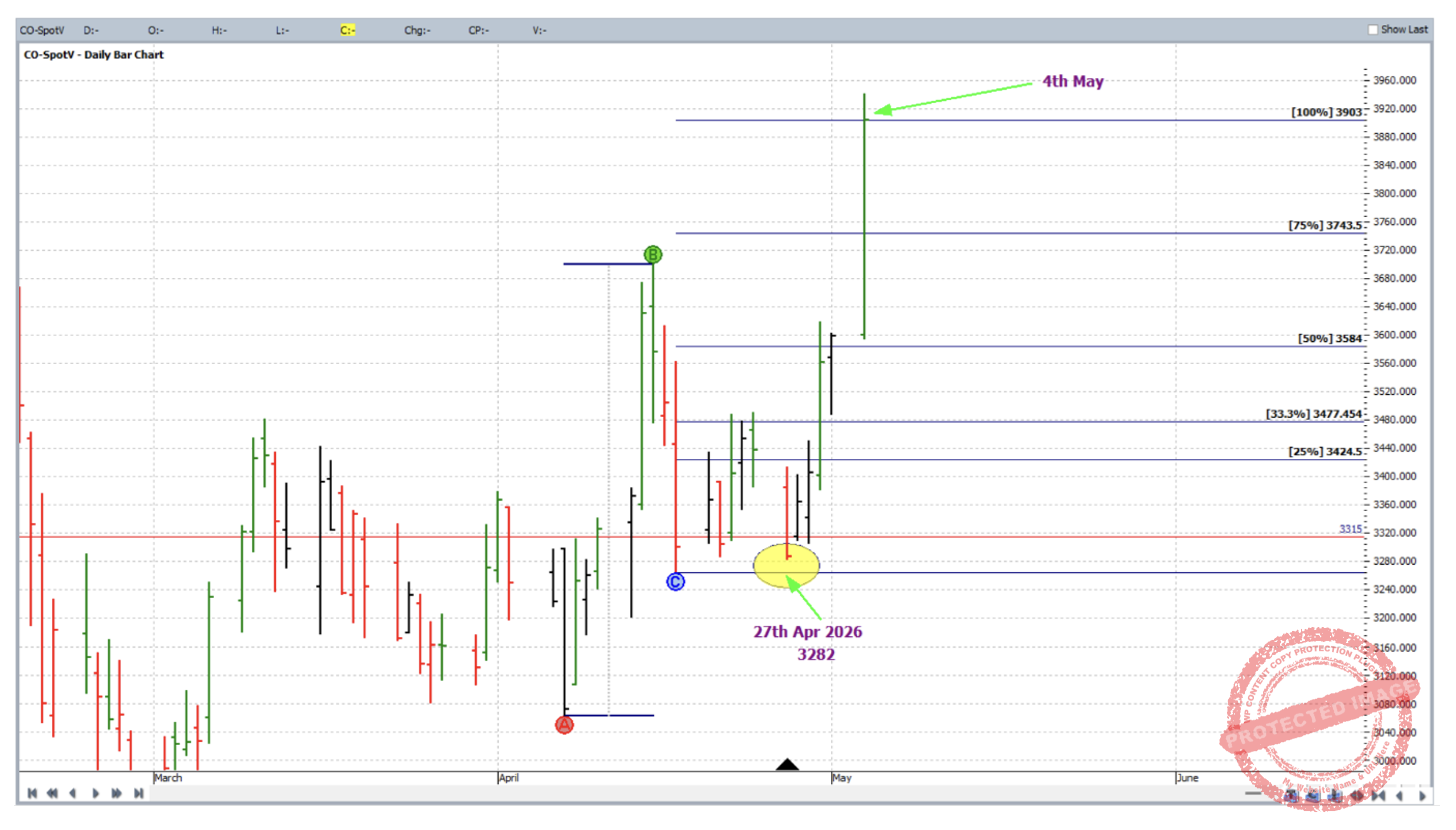
One thing to note here is that the analysis inputs, and for that matter the trading reference range were very small picture. In fact it all fit within the small box in the chart below. More often it is encouraged to engage the more major turning points and reference ranges in the analysis and trade execution.
Finally, to break down the rewards. In terms of the reward to risk ratio:
Initial risk: 3315 – 3281 = 34 = 34 points (point size is 1)
Reward: 3903 – 3315 = 588 points
Reward to Risk Ratio = 588/34 = approximately 17 to 1
Let’s assume that a more conservative 2% of the account size was risked across the range of the hourly bar at entry. The gain in account size would be as follows:
17 x 2% = 34%
Each point of price movement changes the value of one Cocoa futures contract by $10USD. Therefore in absolute USD terms the risk and reward for each contract of the trade is determined as:
Risk = $10 x 34 = $340
Reward = $10 x 588 = $5,880
In AUD terms this reward was approximately $8,200 for each contract traded. One can also access this strongly trending market via CFDs where much smaller minimum positions sizes are available.
Work hard, work smart.
Andrew Baraniak