Steady, Steady
How do you cope waiting patiently for a trade setup? If you’re entering trades and being stopped out early, then perhaps you need to:
- Look if the emotion ‘Fear’ is creeping in and if the ‘Fear Of Missing Out’ is causing an early trade entry.
- Maybe you’re not waiting for confirmation that the move is over.
It’s been interesting watching the S&P500 and the Nasdaq have explosive moves to the upside, while at the same time watching the SPI200 retest old lows, and just recently the 5 May higher bottom which was taken out on 14 May. Does this now give us the potential for a false break triple bottom?
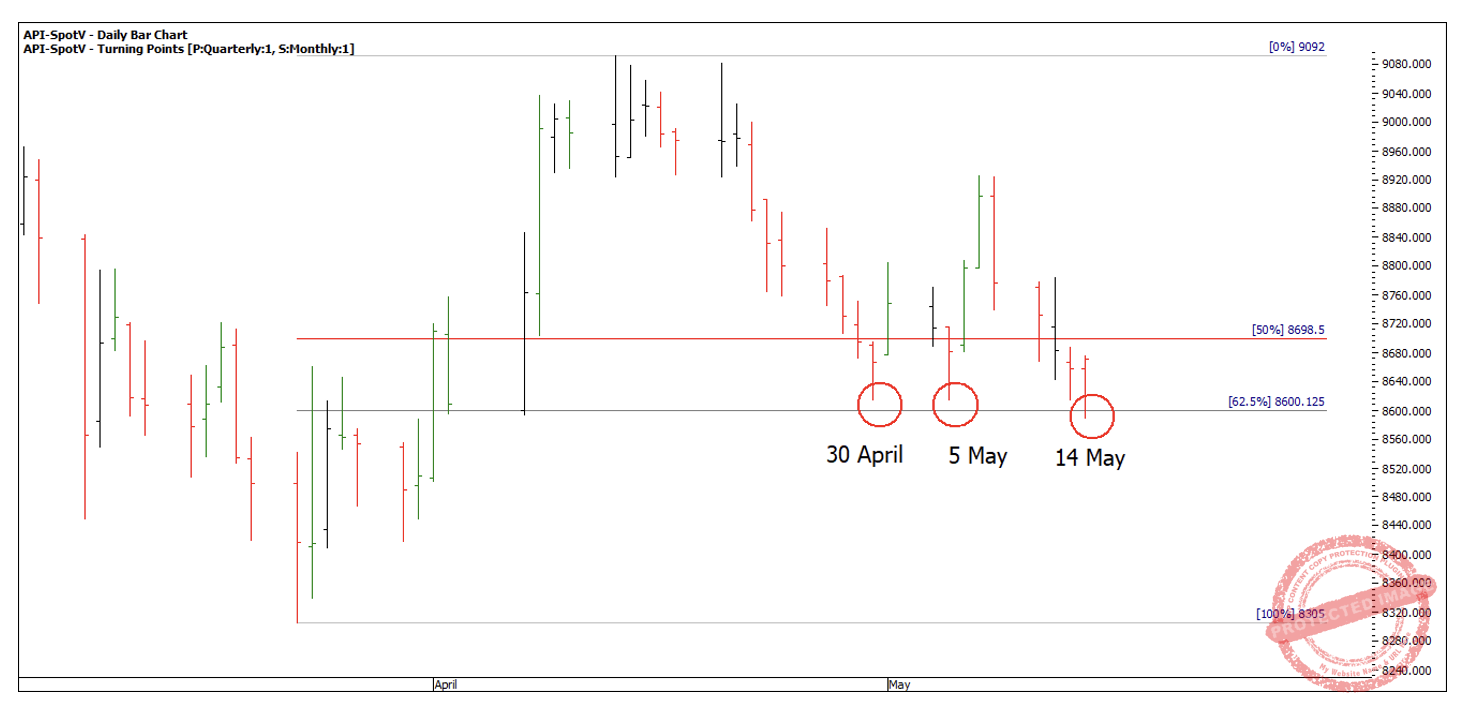
Chart 1
Looking to understand why the 5 May low was broken, using my Ranges Resistance Card, the 14 May low is finding support on a 62.5% retracement. This can be a normal retracement level for this market. See Chart 1 above.
In Chart 2 below, you can see two very important 50% levels.
- 50% of the previous major range down = 8,651
- 50% retracement = 8,698.5
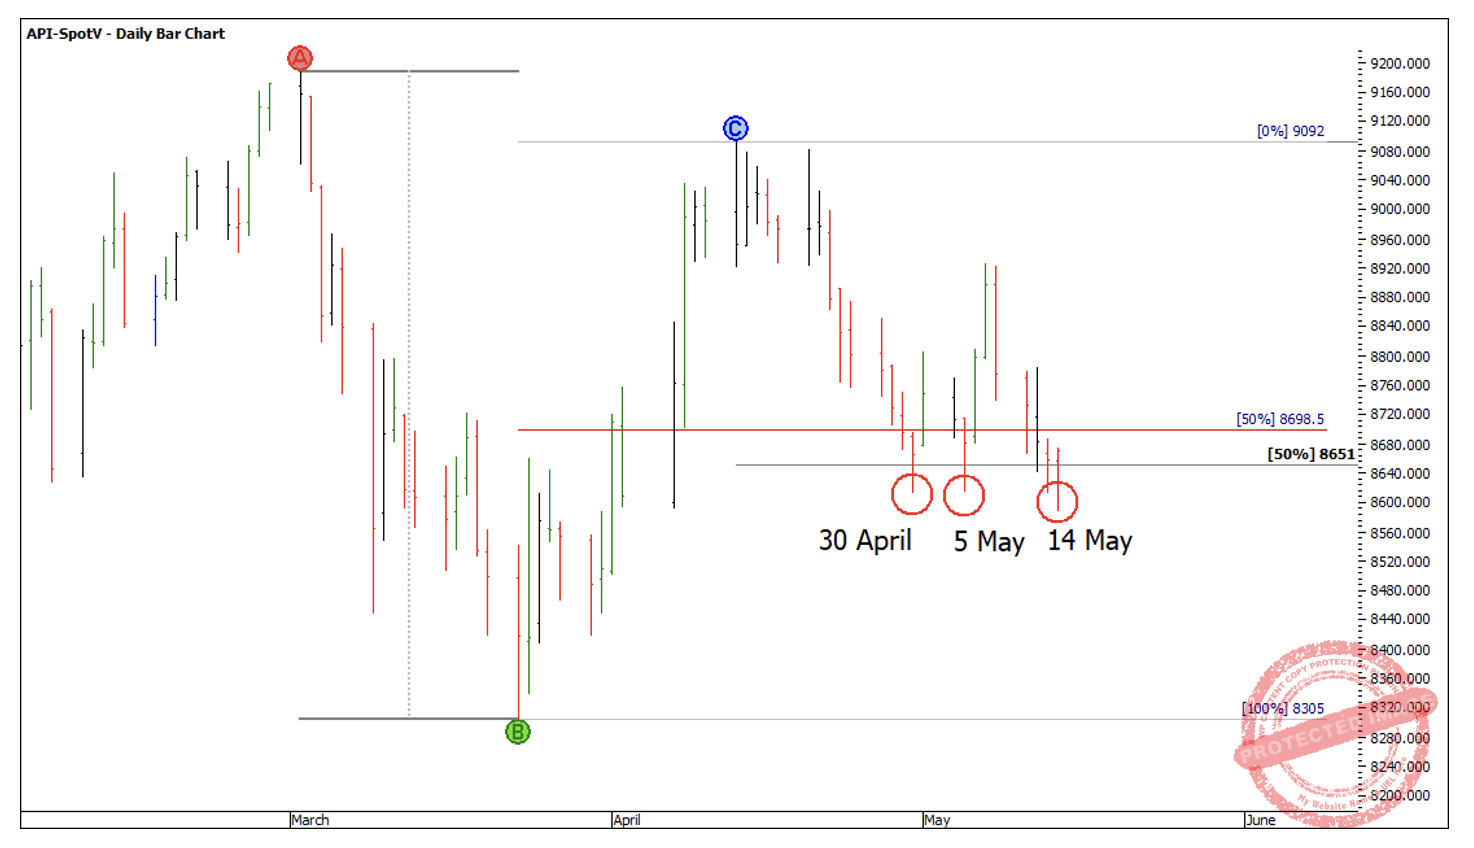
Chart 2
What’s interesting now is if we put the weekly swing overlay on, I see a second and a potential failed weekly swing down, which give us another 50% milestone support level of 8,686.
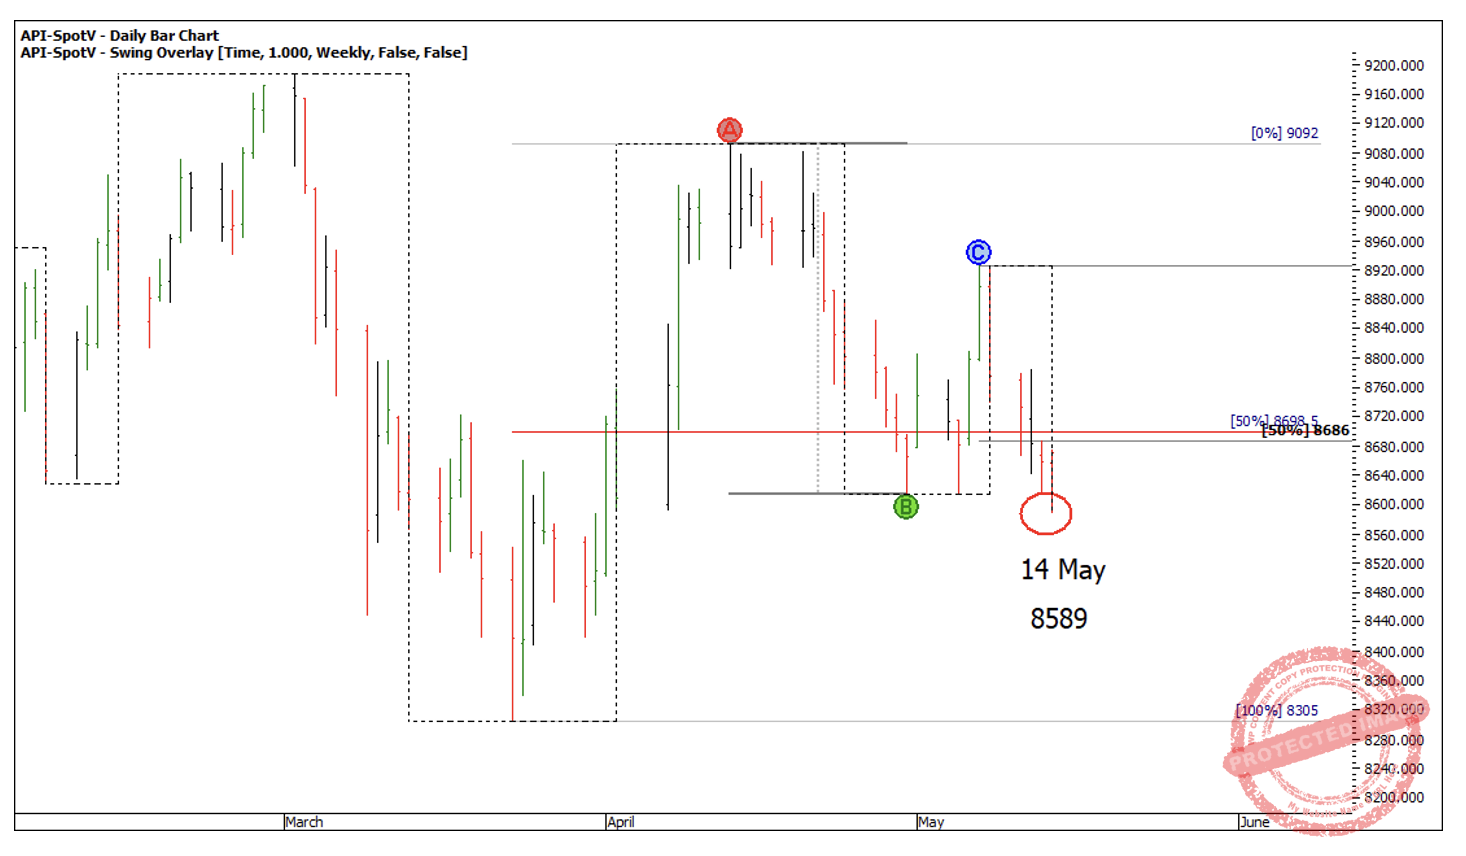
Chart 3
Within this current weekly swing down, I see two daily swings down with the second swing into 14 May a contracting range of 195 points.
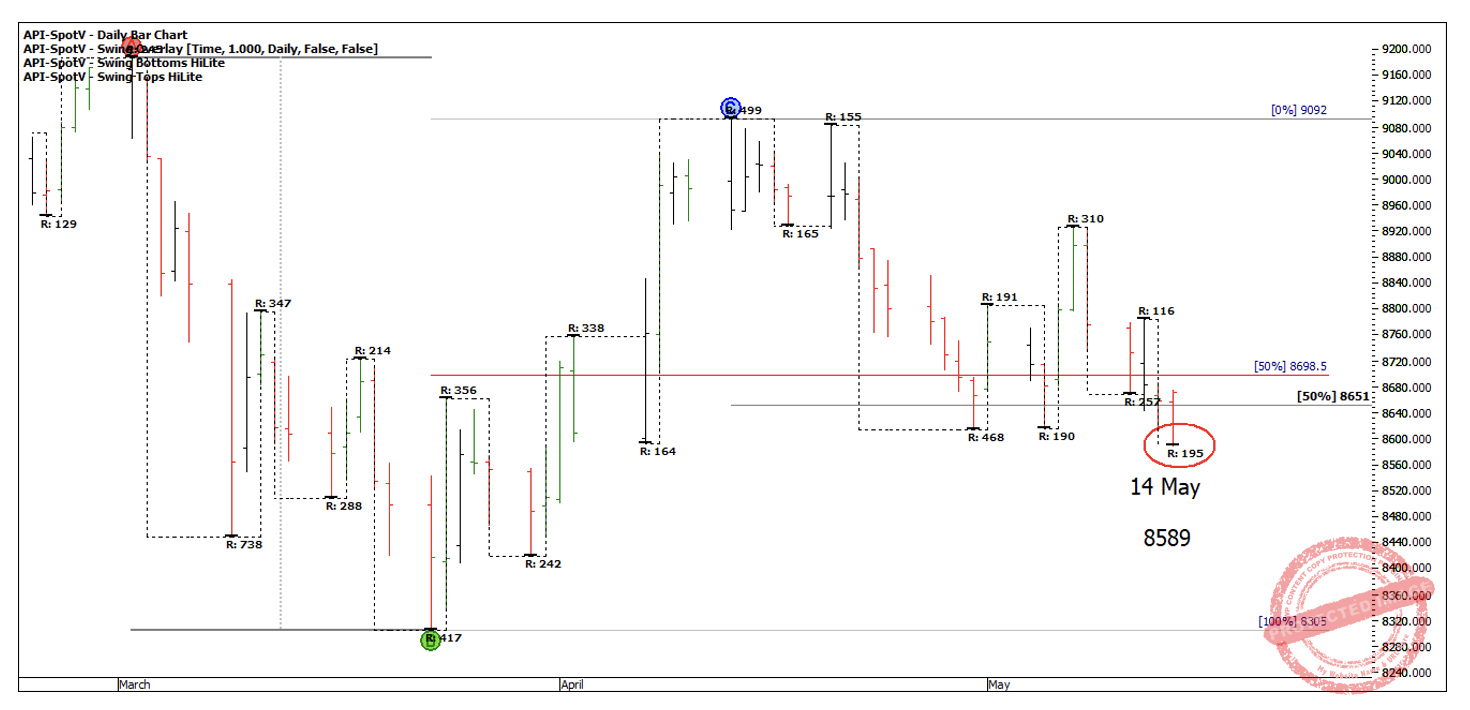
Chart 4
The last weekly swing down is contracting, and within this weekly swing range the last daily swing down is contracting, so will the 14 May low prove to be a weekly Point C? If it is a weekly Point C, there should be at least one good opportunity to enter into a trade.
I like 62.5% retracements, because if the market is going to show signs of strength, then it needs to trade back above the 50% retracement. Personally, I would then like to see:
- A daily overbalance in price swing to the upside into Point B (greater than 116 points)
- Point C siting on or above the 50% retracement level
- Stronger volume on the A-B move. See Chart 5 below
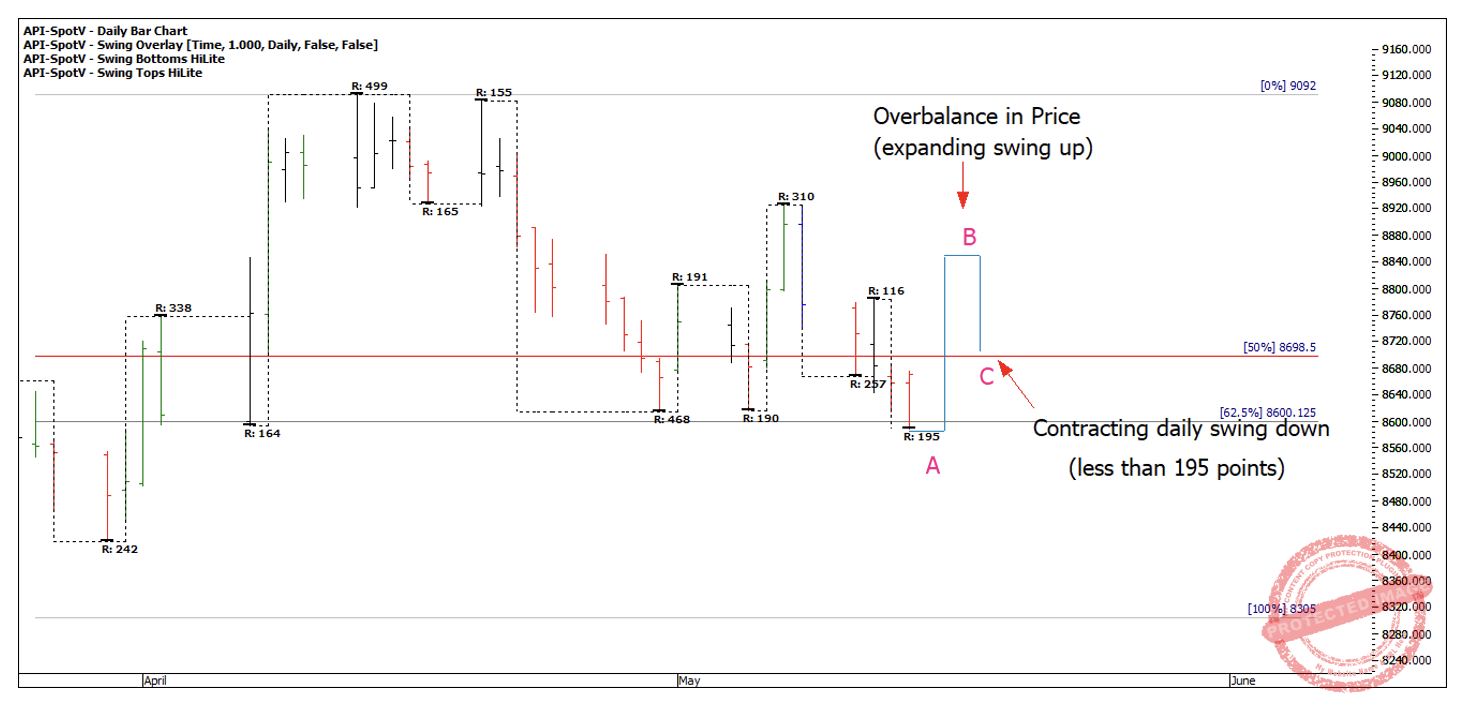
Chart 5
Can you see that you’re really just looking for the first daily ABC out of a weekly ABC?
Now this 50% retracement level is also significant for another reason! If you look at the ATL resistance card of 458, 19 multiples of 458 = 8,702. The 14 May low is also sitting in the strong part of this square.
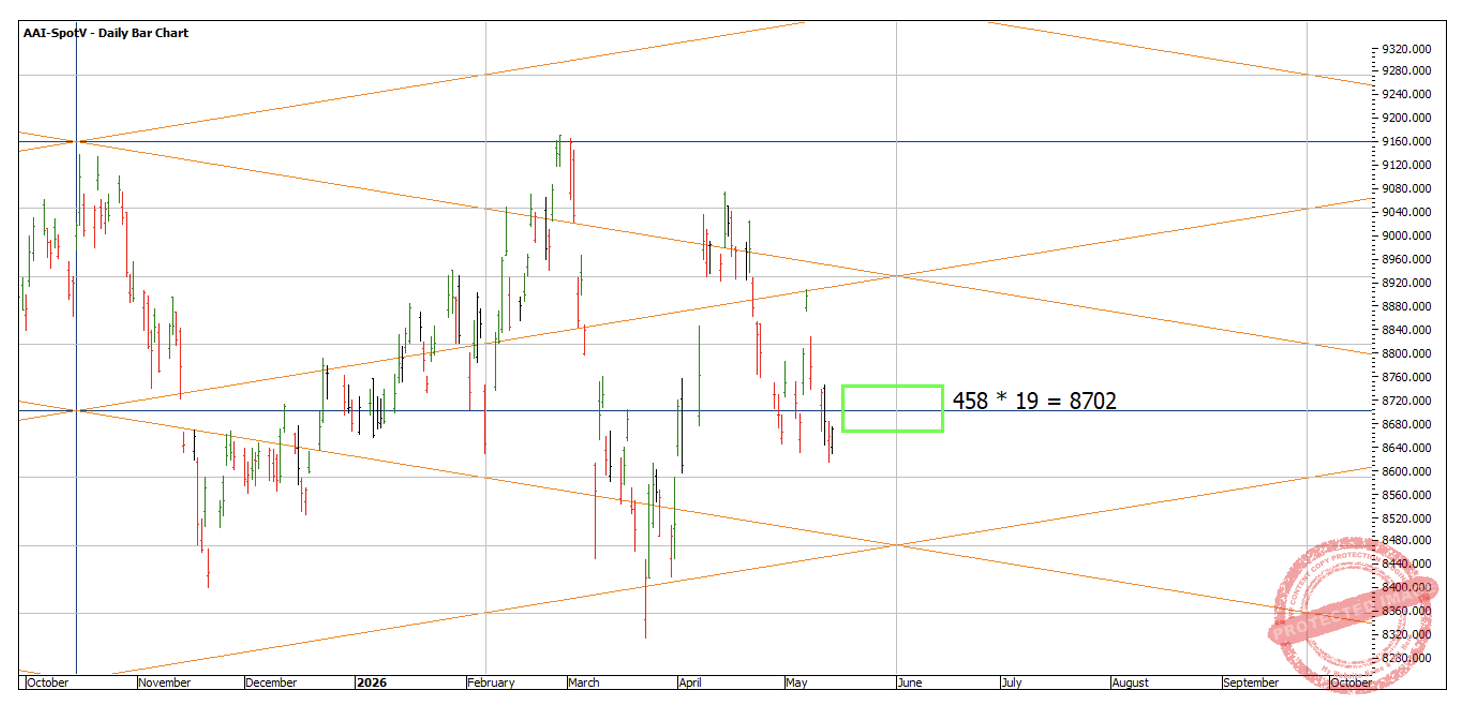
Chart 6
Swing charts, Form Reading, Resistance Cards, the 50% rule, Overbalance in Price, All Time Lows Card and Volume are all techniques straight out of the Active Trader Program and should form the foundation of your analysis!
Happy Trading
Gus