Seasonal Volatility
A lot has changed since the last time the Platinum newsletter hit your inbox. The globe has seen a seismic shift in terms of volatility and geopolitical instability. The news cycle we now inhabit has caused us to become numb to much of the information, so I won’t look to add anything more to the pile. Suffice to say markets have roared back into focus, oil that was seen as an aging apparatus of society has reminded us how important it remains to most things.
I detailed earlier in the month that participating in these volatile moves often requires us to be set in the position before the rocket fires and moves at pace. This is clear with the likes of the Crude Oil market where the recent session of 9 March produced a range of $40 intraday and a $3 gap on the open. There is not much I can share with you that will allow you to ride that wave successfully.
Its worth noting that the March seasonal date is about to appear on the horizon and has proved useful across many markets over the years, so keep that in your focus. The aspect of trade management also comes to mind in times like this as volatility increases, your options are to zoom into closer time frames to manage risk on entry, but also there is a case for reducing position sizes and moving stops to a wider range, say above or below 2 day swing tops or bottoms.
I wanted to revisit Boeing as this market is really singing to me, at the moment. I hope you have reviewed last month’s articles, and the time frames and day counts that we discussed.
Chart 1 looks at the days post that article where the safest place to sell in Gann’s terminology came into play, with a first lower swing top entry offering a simple entry as the market fell away.
The B to C retracement was greater than 50% and entering within limits made it challenging with the outside day in the A to B range. This setup used a broader base of thinking outside a standard ABC pattern.
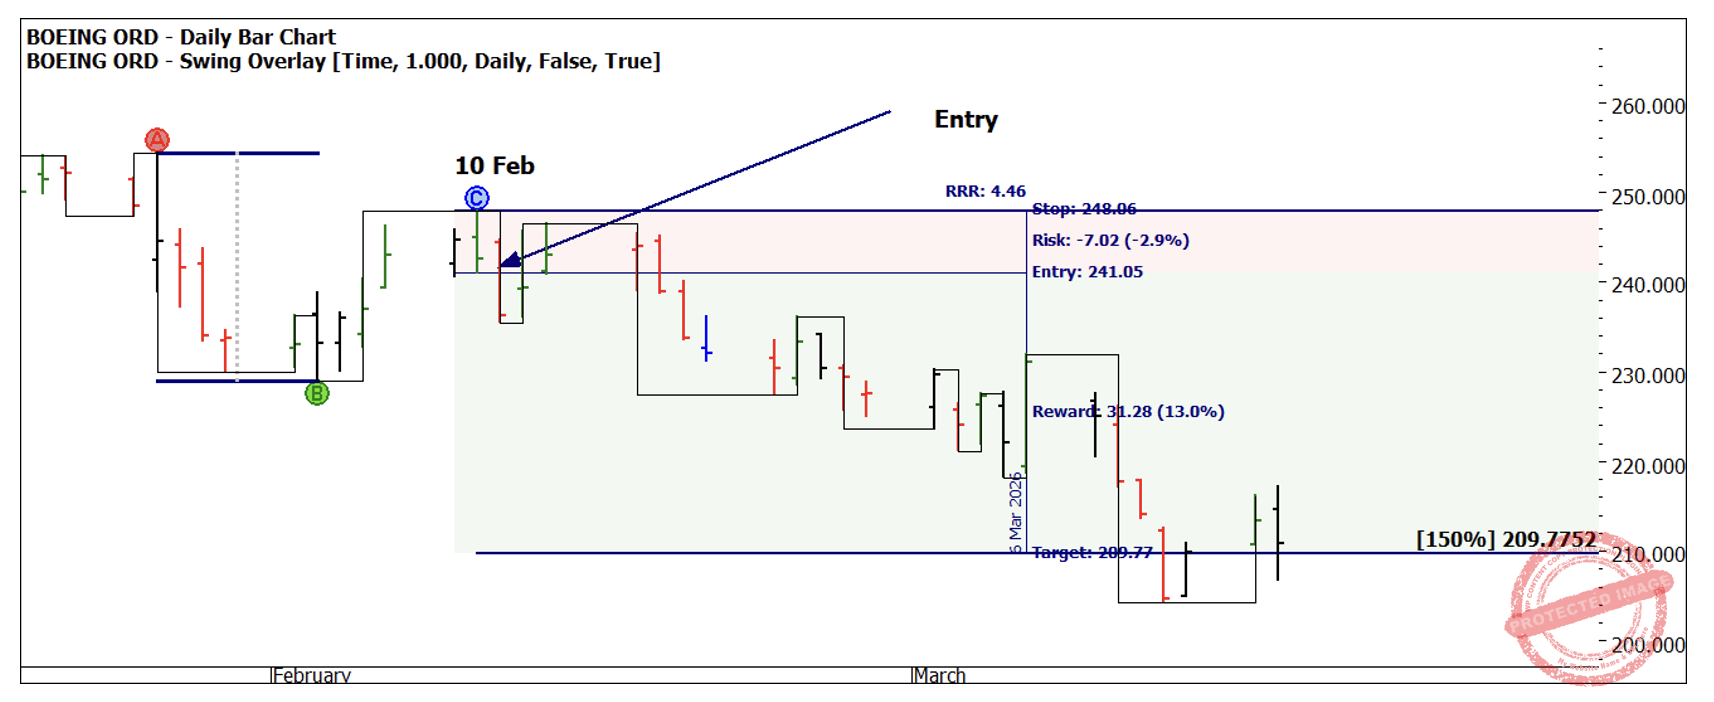
Chart 1 – Boeing Daily Bar Chart
Based on the work from last month, your project now would be to study the highs on the 27 January and 10 February to see what price and 3rd dimension techniques could have added as support for the first lower top entry.
Chart 2 has two aspects to consider, using what I consider the First Range Out in 2022 we can see the move in 2025 has moved approximately 200% of that price range.
The second technique uses a Gann Angle on a weekly chart (typically we use it on daily charts as a starting point). The 1 x 1 angle in orange has acted as a strong resistance point on three occasions. We might consider the implications of support being found on an angle in the future.
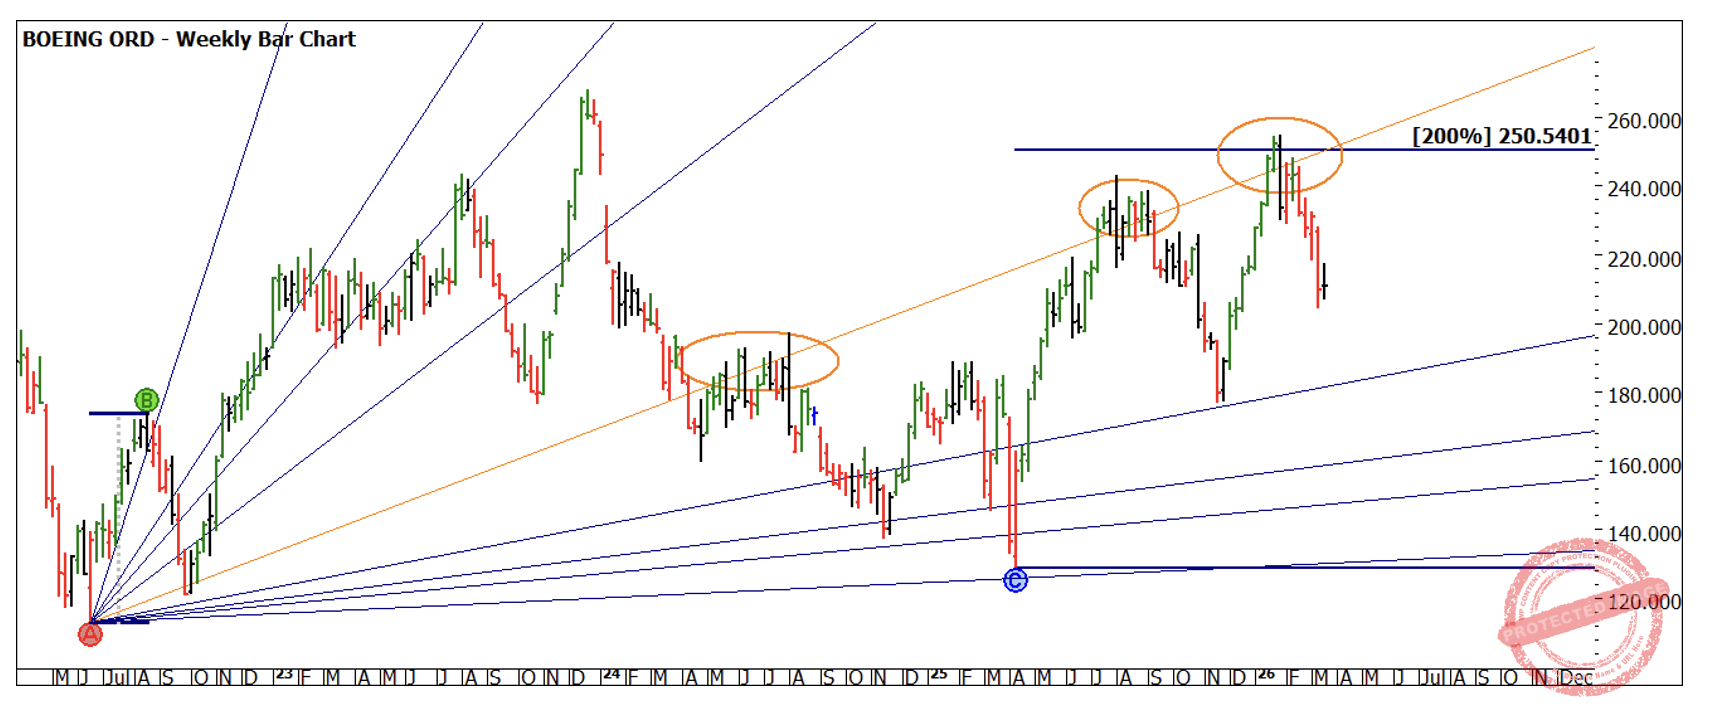
Chart 2 – Boeing Weekly Bar Chart
One of the lessons we are unpacking as part of our Ultimate Gann Course Coaching is Time by Degrees. If you are looking for a good market to unpack a Degree Vibration Wall Chart on as a practical exercise, then this could be a good one.
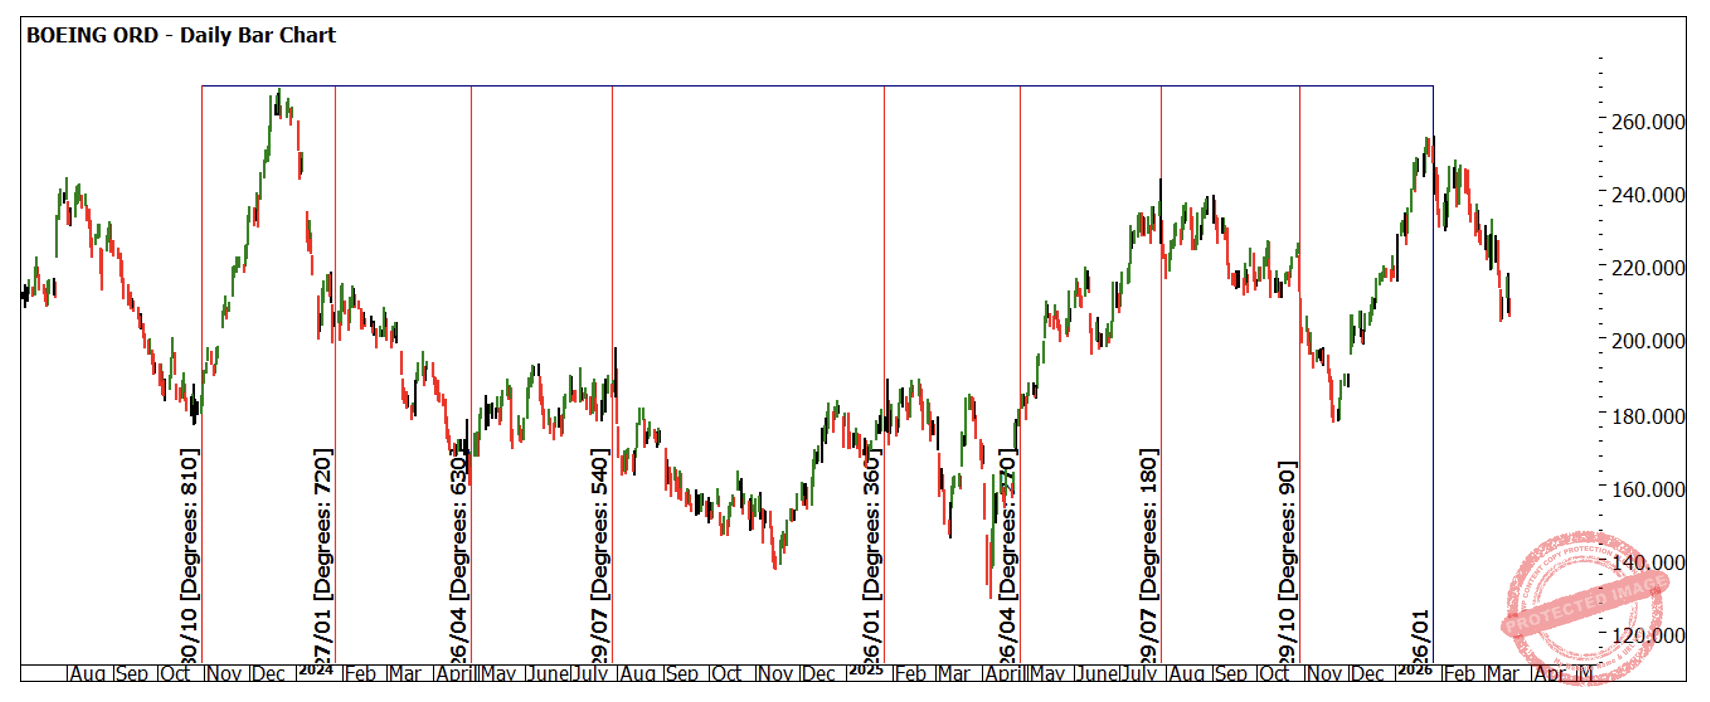
Chart 3 – Boeing Daily Bar Chart
This stock produces a lot a harmony with a variety of tools from our kit. As mentioned, there will be value in analysing the February high and what other clusters you can identify.
If you are part of Ultimate Gann Course Coaching this year, feel free to drop them in the forum and we can pick up the discussion there. I will be watching closely to see how this continues to develop through March.
Good Trading
Aaron Lynch