Will the Stars Align?
This time last month I was driving across the Nullarbor, writing an article not far from the small town of Penong in South Australia. The most I paid was $2.20 per litre for diesel. Now, with prices pushing $3.07 in my area, I’m pretty glad I made that trip when I did!
We’re now in the window of the March seasonal date, and for many markets this is a prime time to watch for a strong cluster to come together. That’s one of the great advantages of trading W.D. Gann’s seasonal dates – you wait patiently for the date, then watch for price to confirm with a cluster to trade out of.
Statistically, the March seasonal date isn’t as strong on the Aussie Dollar compared to other markets. However, price may already be testing resistance, and there are early signs that a cluster could be forming.
Looking at the swing charts, the current top at 7189 sits right on the 50% milestone of the yearly swing. The question now becomes: is this a yearly swing that fails at 50%, or is the current higher bottom setting the foundation for further upside?
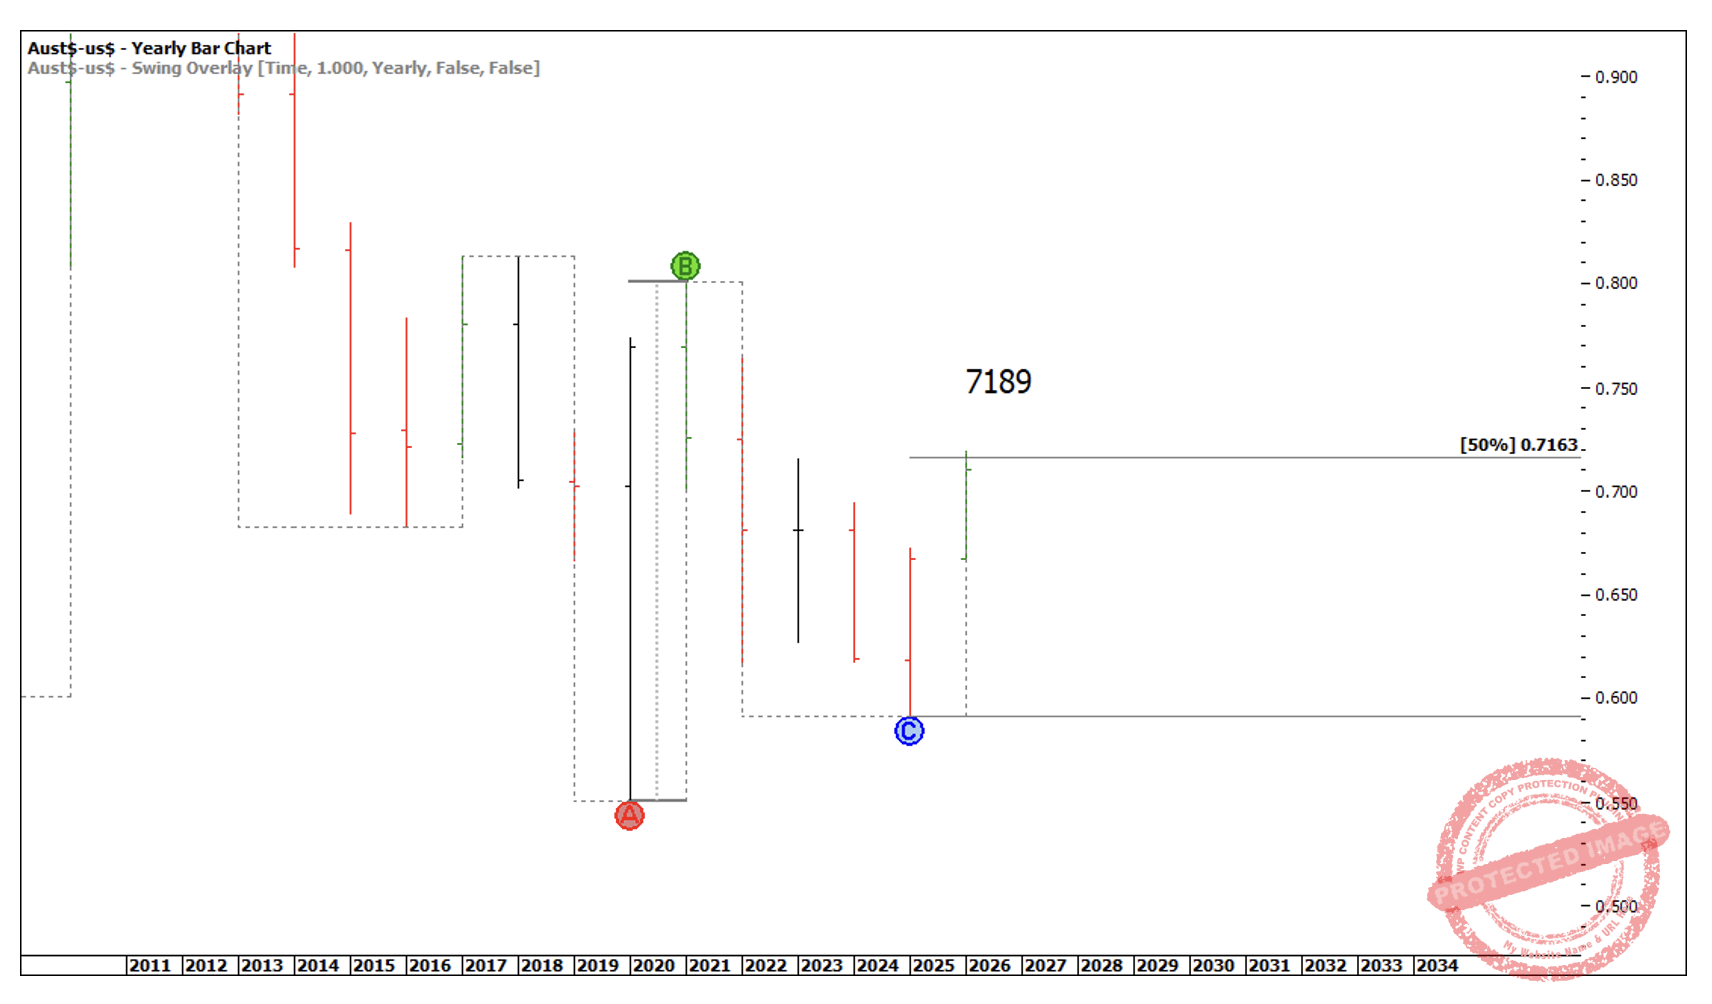
Chart 1
From a pure swing chart perspective, the higher bottom sits on an old 50% milestone and is a second contracting yearly swing down.
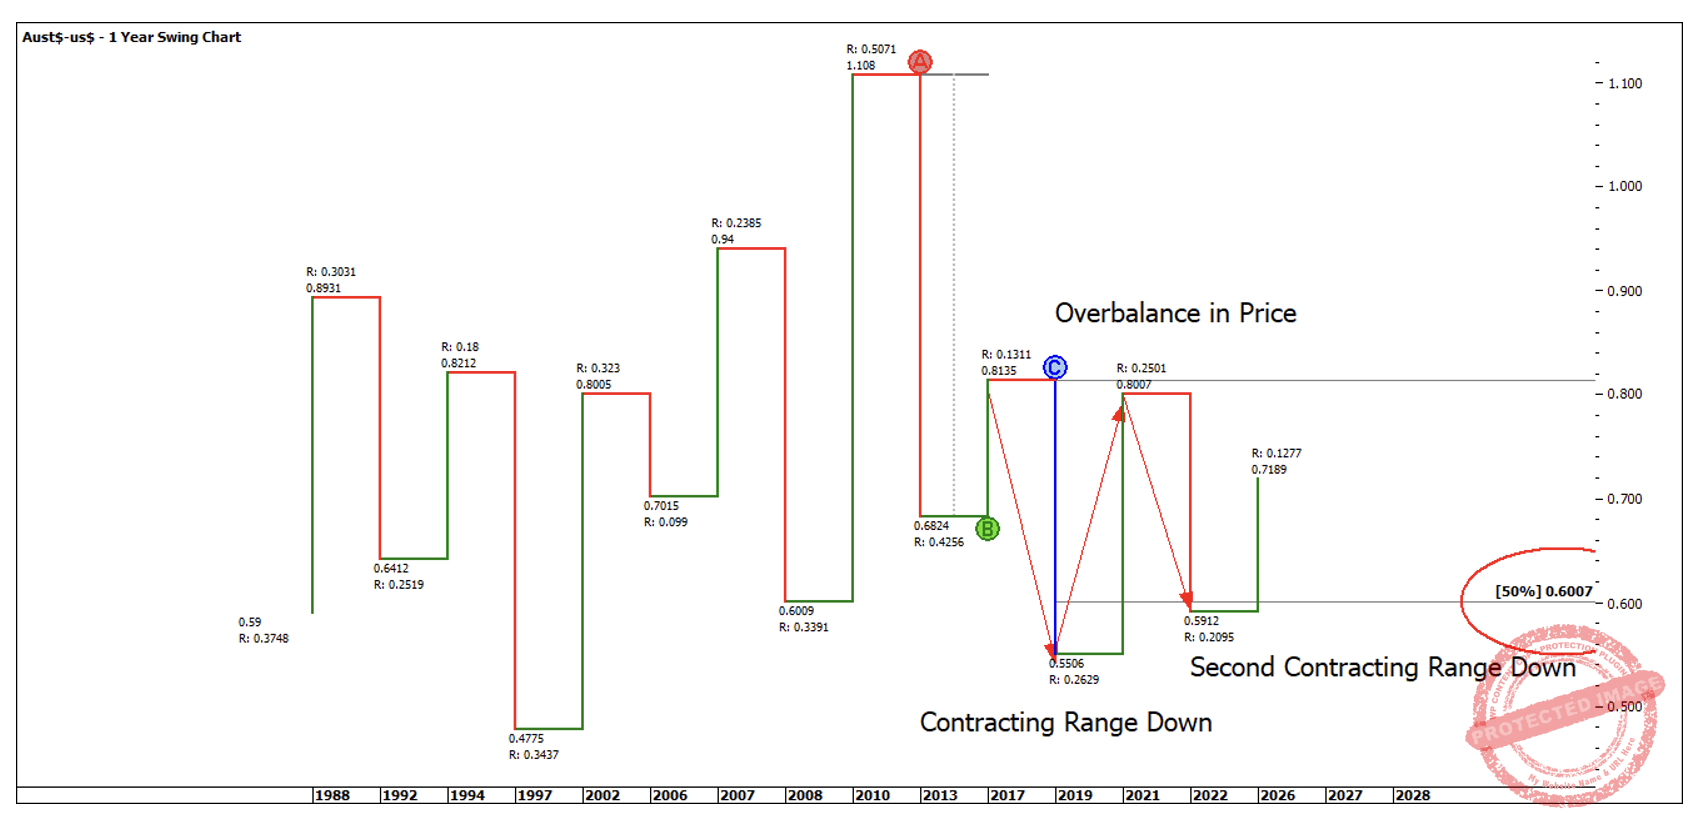
Chart 2
Being the big time frame swing chart, a lot can happen and it’s very much a slow mover but this says to me that long term, there could be more upside.
Within this last yearly swing down of 2095 points, (depending on how you call it) I see 4 sections down on the quarterly swing chart with the current swing up an Overbalance in Price that has gone just through the 200% milestone. The 4 sections down shows signs of completion to the downside and the Overbalance in Price confirms this and shows strength to the upside.
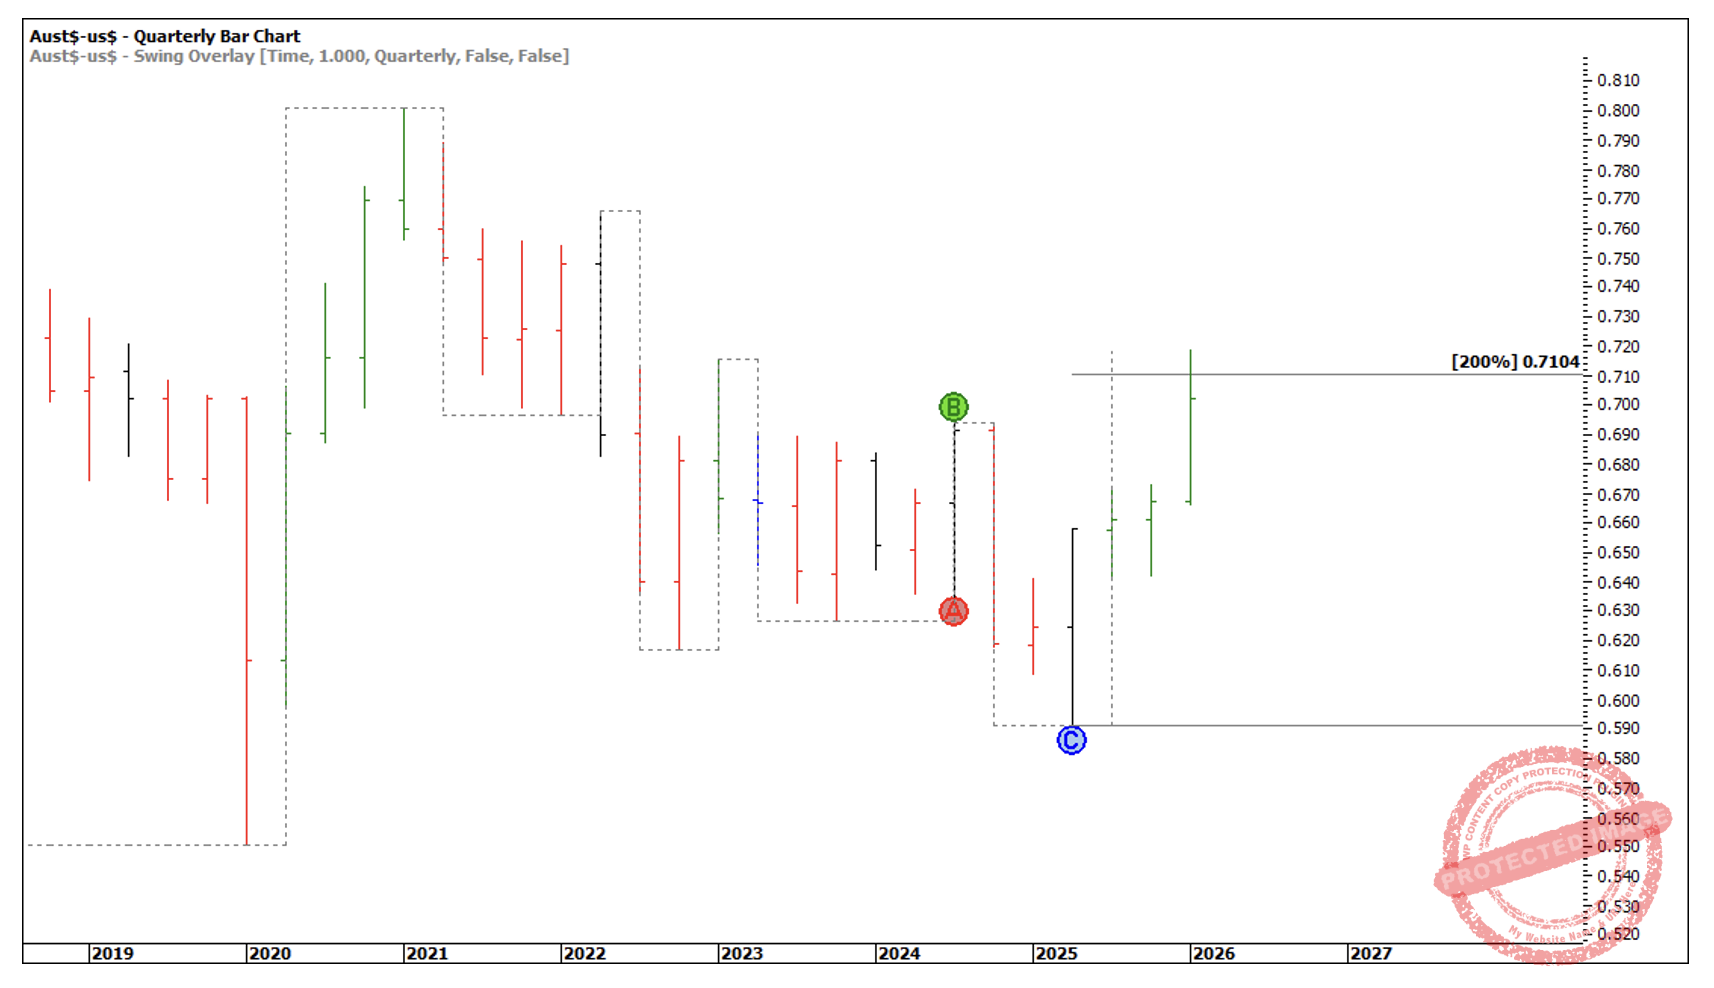
Chart 3
I still need to combine the big picture with the smaller picture. With the above quarterly swing at 200%, odds are increased of the market turning. So, dropping down to the monthly swing chart, I see two big milestones have been hit.
- 100% of the monthly First Range Out at 7124
- 250% of the double bottoms at 7154
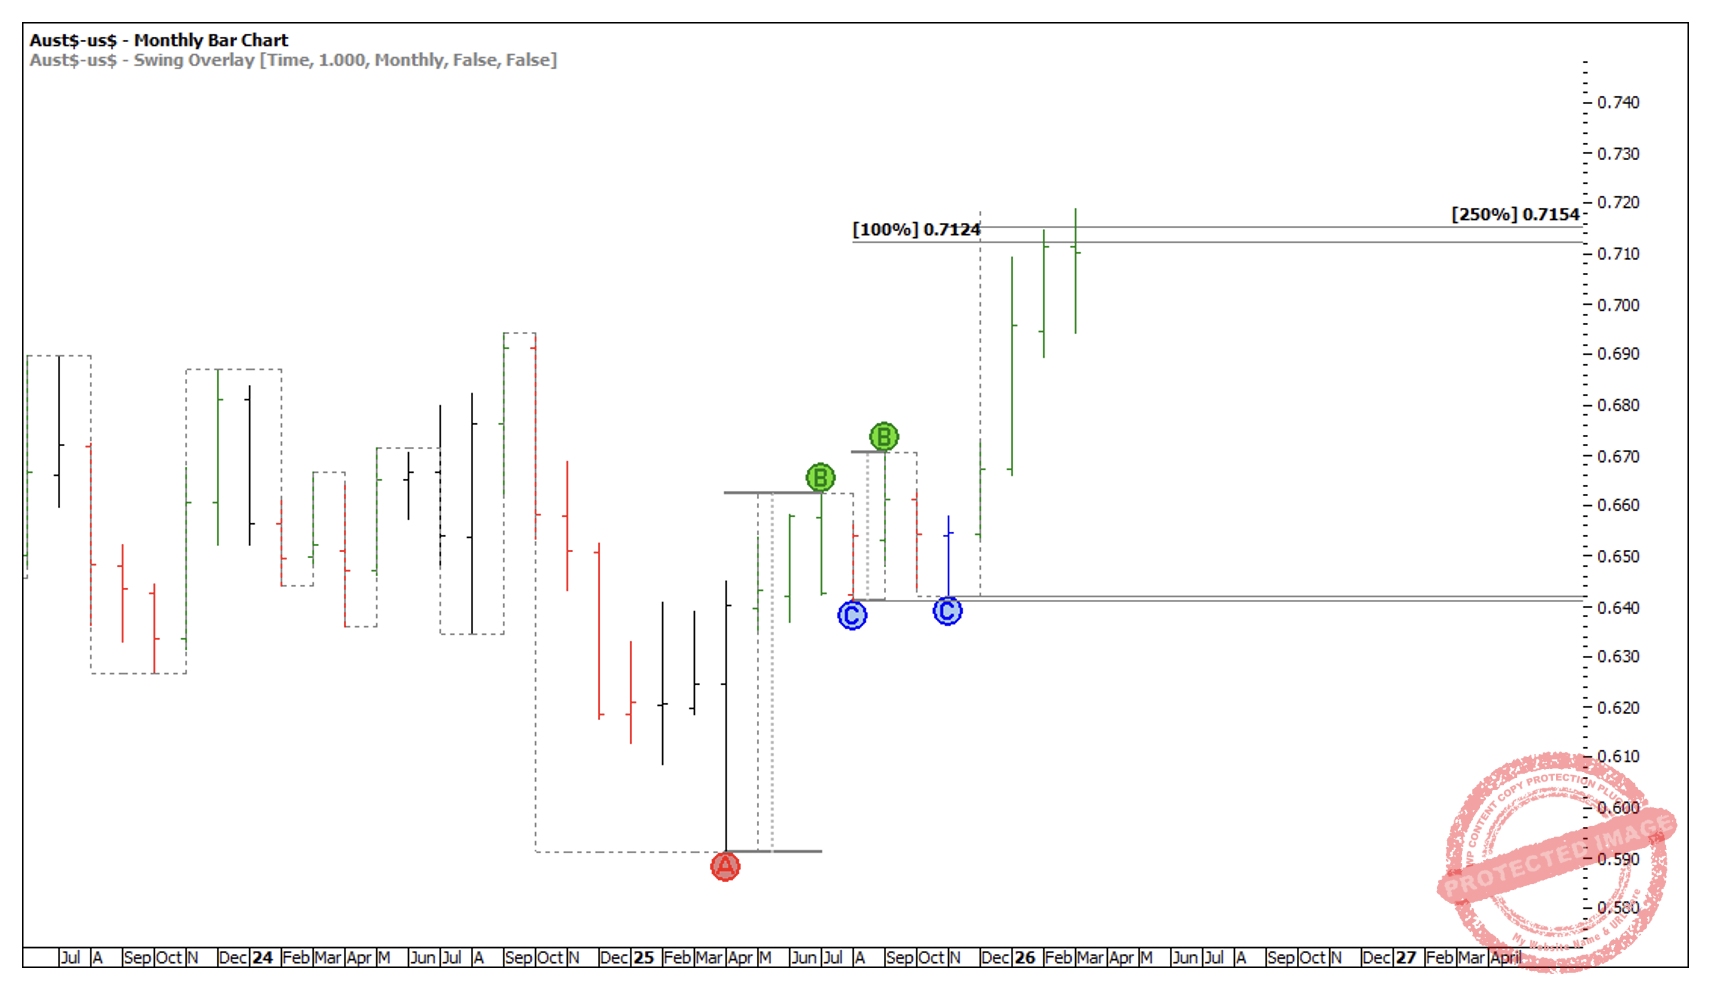
Chart 4
Remembering our Wheels Within Wheels and Sections of the Market being one of the best tools for reading signs of completion, dropping down to the weekly swing chart, I count the AUD is in the third weekly swing up. But has this third swing come to completion?
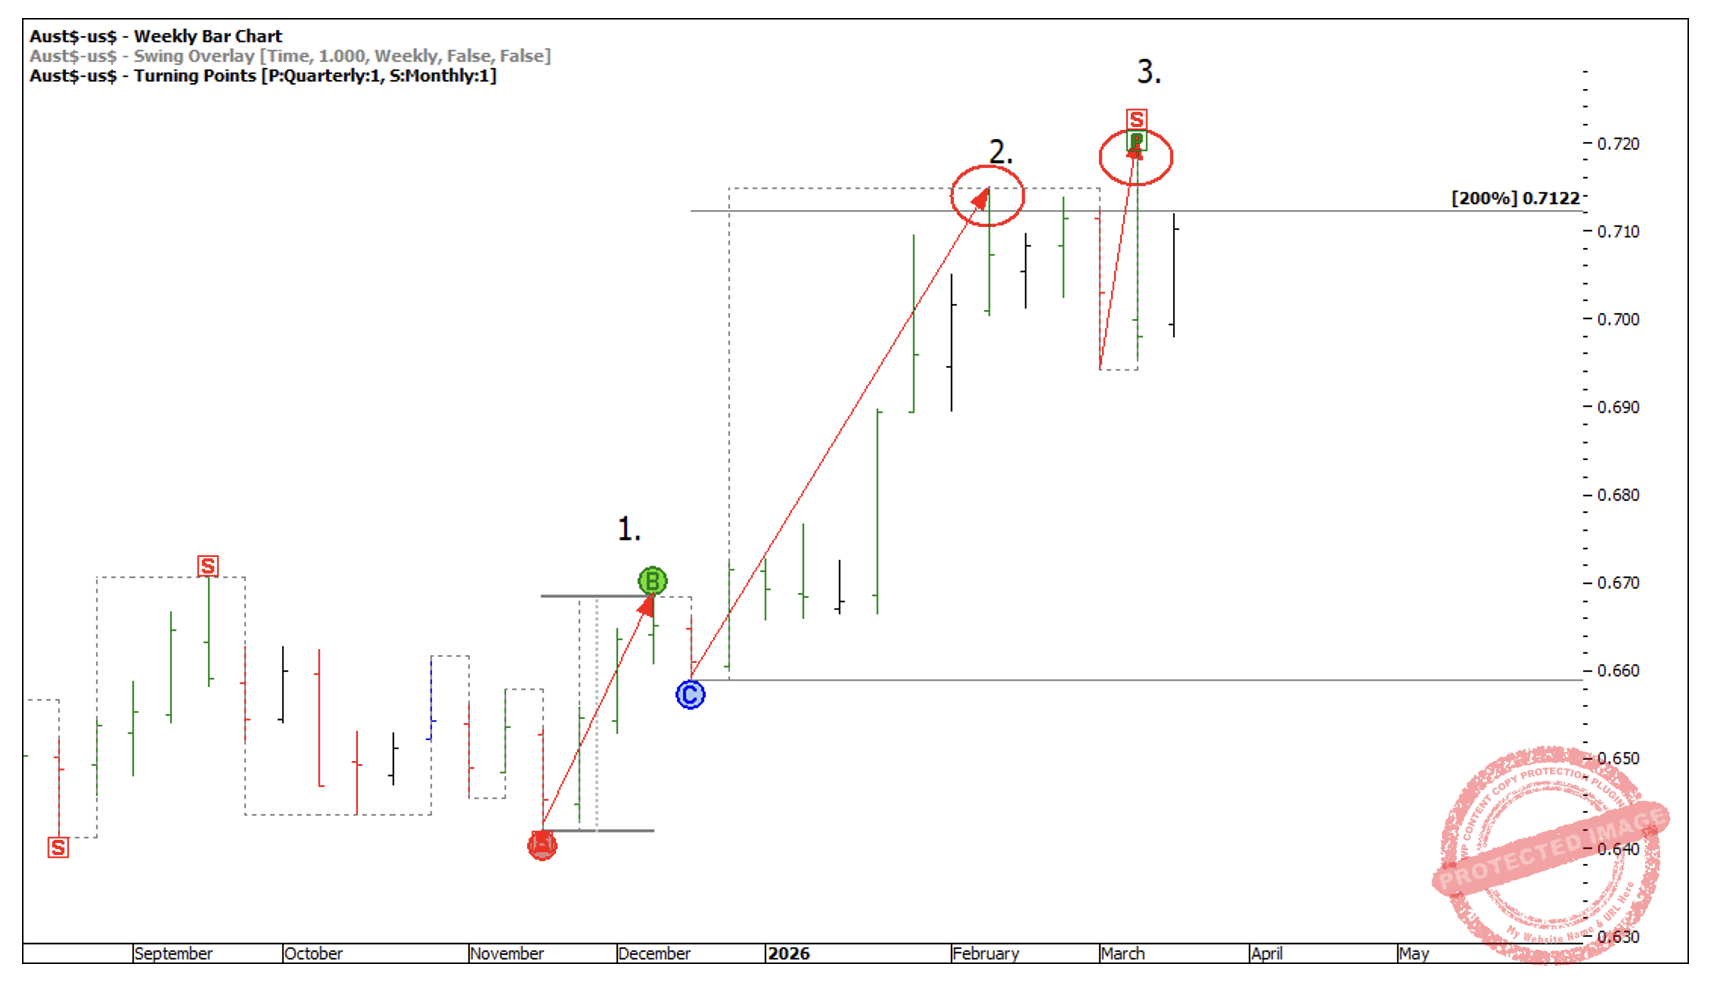
Chart 5
In this 3rd weekly section up, I would like to see 3 or 4 daily swings up with extra price milestones adding to this cluster. This would give me signs of completion that the weekly swing is over. However, so far, we’ve only got 2 sections, and the daily section 2 went to 150% of the First Range Out.
This is harder to interpret. David Bowden does say on the Milestone chart that 150% can be a possible Point A! But David also say’s “Tattoo on your arm, I will not short the second leg out”!
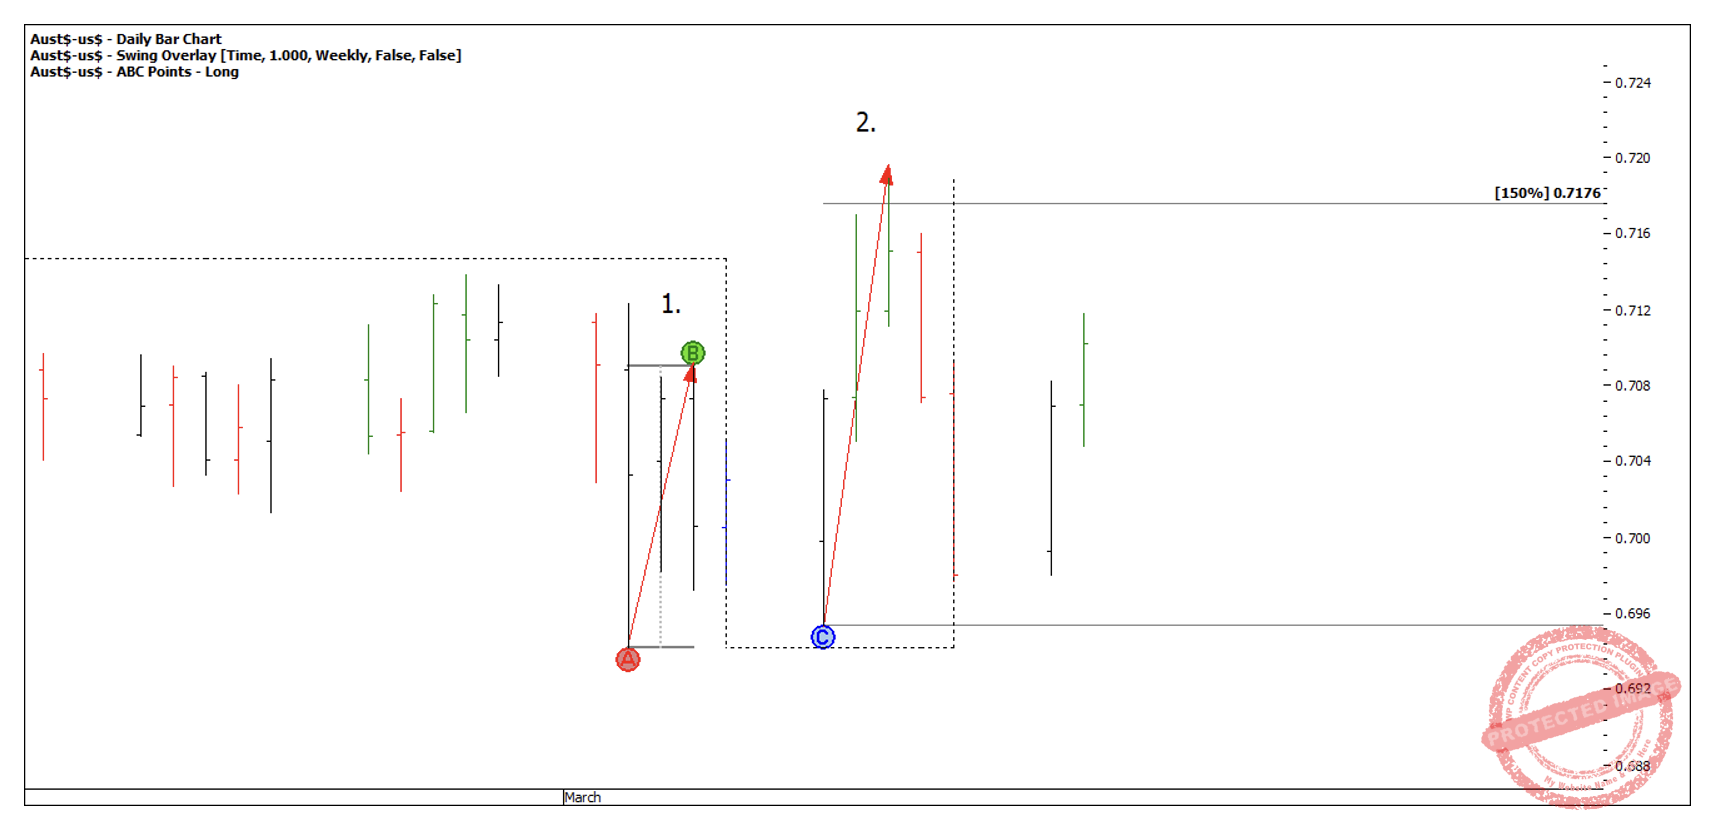
Chart 6
We may have seen the top however it doesn’t quite fit my trading plan, so I’ll be patient and wait to see if we get a third or fourth daily swing up. If the market does continue up, I see:
- 50% of the weekly swing gives 7221and,
- 100% of the current daily swing gives us 7212, only 9 points apart.
So, could a repeating third daily swing up signal the end of this weekly swing?
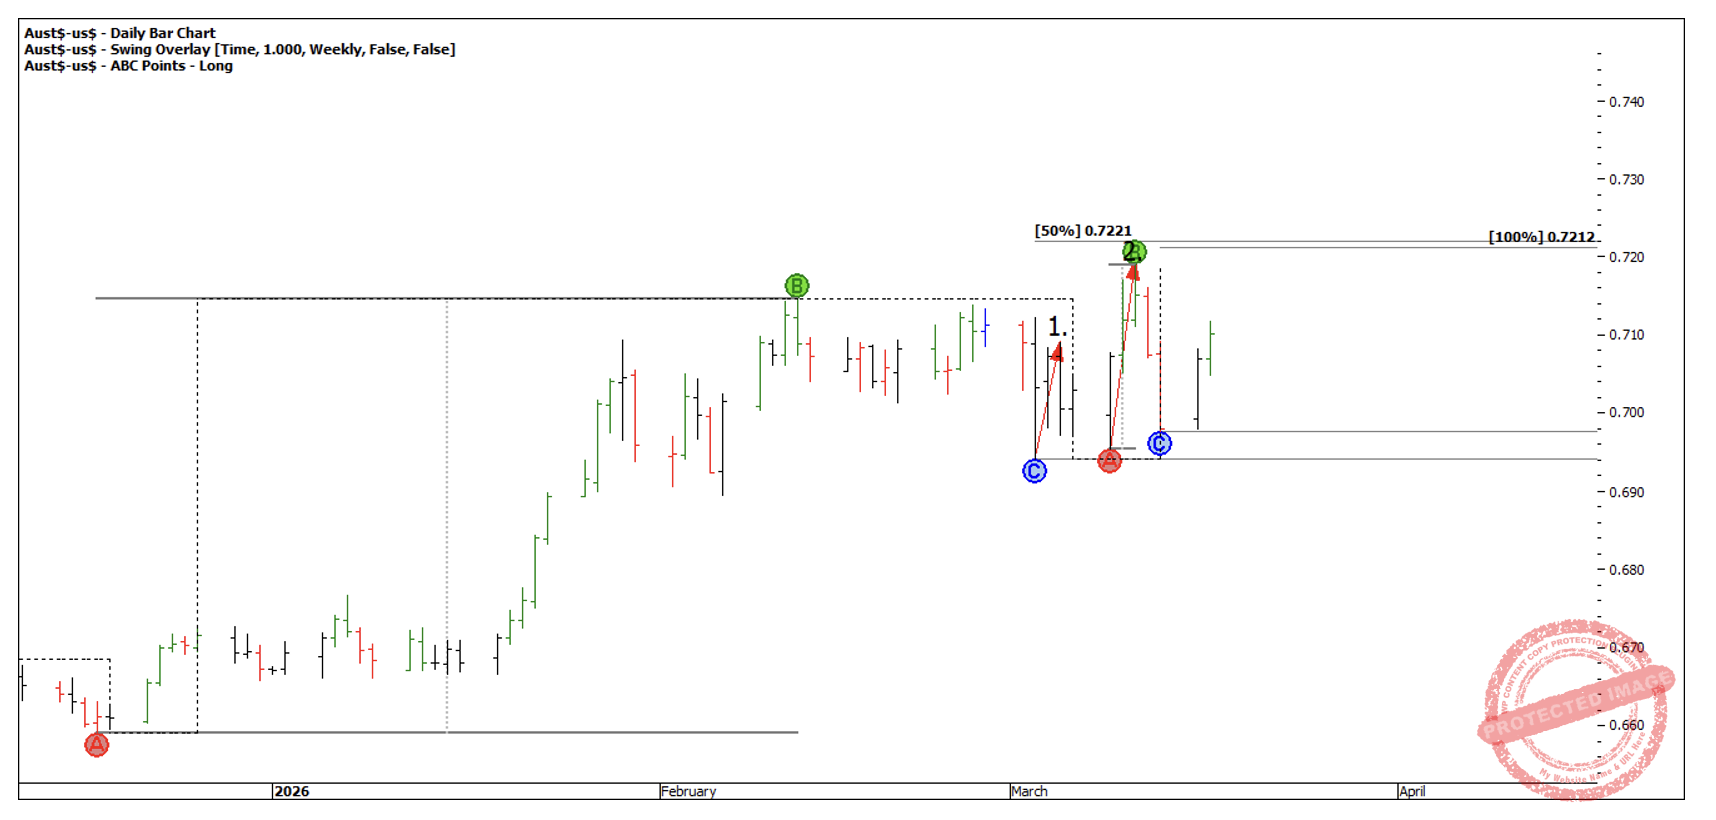
Chart 7
Anticipating that it might be, you can drop down to the 4-hour swing chart and look for 3-4 sections to unfold within this time frame and look for swing milestones that add to 7212/7221.
Entering on the 4-hour swing chart reduces the risk, increases your position size for a larger Reward to Risk Ratio, but also allows you to move your stop to breakeven sooner to remove all risk from the trade.
As the 4-hour swing chart develops over the next few days I can assess if this is a potential trading opportunity or not!
Happy Trading,
Gus